Education in the United States
Education in the United States is provided in public, private, and home schools. State governments set overall educational standards, often mandate standardized tests for K–12 public school systems and supervise, usually through a board of regents, state colleges, and universities. The bulk of the $1.3 trillion in funding comes from state and local governments, with federal funding accounting for only about $200 billion.[1] Private schools are generally free to determine their own curriculum and staffing policies, with voluntary accreditation available through independent regional accreditation authorities, although some state regulation can apply.
| National education budget (2016–17) | |
|---|---|
| Budget | $1.3 trillion (7.2% of GDP) (public and private, all levels)[1] |
| General details | |
| Primary languages | English |
| Literacy | |
| Male | 100%[2] |
| Female | 100%[2] |
| Enrollment | |
| Total | 81.5 million |
| Primary | 37.9 million1 |
| Secondary | 26.1 million (2006–2007) |
| Post secondary | 20.5 million 2 |
| Attainment | |
| Secondary diploma | 91%[3][4][5] |
| Post-secondary diploma | 46%[6][7] |
| 1 Includes kindergarten 2 Includes graduate school | |
| Education in the United States |
|---|
|
|
|
In 2013, about 87% of school-age children (those below higher education) attended state funded public schools, about 10% attended tuition- and foundation-funded private schools,[8] and roughly 3% were home-schooled.[9]
By state law, education is compulsory over an age range starting between five and eight and ending somewhere between ages sixteen and eighteen, depending on the state.[10] This requirement can be satisfied in public schools, state-certified private schools, or an approved home school program. In most schools, compulsory education is divided into three levels: elementary school, middle or junior high school, and high school. Children are usually divided by age groups into grades, ranging from kindergarten (5–6-year olds) and first grade (6-7- year olds) for the youngest children, up to twelfth grade (17–18 years old) as the final year of high school.
There is also a large number and wide variety of publicly and privately administered colleges and universities throughout the country. Post-secondary education, divided into college, as the first tertiary degree, and graduate school. Higher education includes extremely wealthy and selective universities, public research universities, private liberal arts colleges, historically-black colleges and universities, community colleges, for-profit colleges, and many other kinds and combinations of institutions. College enrollment rates in the United States have increased over the long term.[11] At the same time, student loan debt has also risen to $1.5 trillion. According to a 2016 report published by the U.S. News & World Report, of the top ten colleges and universities in the world, eight are American (the other two are Oxford and Cambridge, in the United Kingdom).[12]
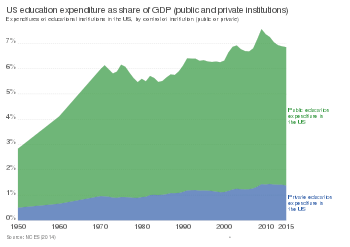
The United States spends more per student on education than any other country.[13] In 2014, the Pearson/Economist Intelligence Unit rated US education as 14th best in the world. The Programme for International Student Assessment coordinated by the OECD currently ranks the overall knowledge and skills of American 15-year-olds as 31st in the world in reading literacy, mathematics, and science with the average American student scoring 487.7, compared with the OECD average of 493.[14][15] In 2014, the country spent 6.2 percent of its GDP on all levels of education – 1.0 percentage points above the OECD average of 5.2 percent.[16] In 2017, 46.4 percent of Americans aged 25 to 64 attained some form of post-secondary education.[6][7] 48 percent of Americans aged 25 to 34 attained some form of tertiary education, about 4 percent above the OECD average of 44 percent.[17][18][19] 35 percent of Americans aged 25 and over have achieved a bachelor's degree or higher.[20] The United States ranks 3rd from the bottom among OECD nations in terms of its poverty gap, and 4th from the bottom in terms of poverty rate.[21][22]
History
19th century
Colonial New England encouraged its towns to support free public schools funded by taxation. In the early 19th century Massachusetts took the lead in education reform and public education with programs designed by Horace Mann that were widely emulated across the North. Teachers were specially trained in normal schools and taught the three Rs (of reading, writing, and arithmetic) and also history and geography. Public education was at the elementary level in most places. After the Civil War (1861–1865), the cities began building high schools. The South was far behind northern standards on every educational measure and gave weak support to its segregated all-black schools. However northern philanthropy and northern churches provided assistance to private black colleges across the South. Religious denominations across the country set up their private colleges. States also opened state universities, but they were quite small until well into the 20th century.
In 1823, the Reverend Samuel Read Hall founded the first normal school, the Columbian School in Concord, Vermont,[23][24] aimed at improving the quality of the burgeoning common school system by producing more qualified teachers.
In the mid-20th century, the rapidly increasing Catholic population led to the formation of parochial schools in the largest cities. Theologically oriented Episcopalian, Lutheran, and Jewish bodies on a smaller scale set up their own parochial schools. There were debates over whether tax money could be used to support them, with the answer typically being no. From about 1876, thirty-nine states passed a constitutional amendment to their state constitutions, called Blaine Amendments after James G. Blaine, one of their chief promoters, forbidding the use of public tax money to fund local parochial schools.
States passed laws to make schooling compulsory between 1852 (Massachusetts) and 1917 (Mississippi). They also used federal funding designated by the Morrill Land-Grant Colleges Acts of 1862 and 1890 to set up land grant colleges specializing in agriculture and engineering. By 1870, every state had free elementary schools,[25] albeit only in urban centers. According to a 2018 study in the Economic Journal, states were more likely to adopt compulsory education laws during the Age of Mass Migration (1850–1914) if they hosted more European immigrants with lower exposure to civic values.[26]
Following Reconstruction the Tuskegee Normal and Industrial Institute was founded in 1881 as a state college, in Tuskegee, Alabama, to train "Colored Teachers," led by Booker T. Washington, (1856–1915), who was himself a freed slave. His movement spread, leading many other Southern states to establish small colleges for "Colored or Negro" students entitled "A. & M." ("Agricultural and Mechanical") or "A. & T." ("Agricultural and Technical"), some of which later developed into state universities. Before the 1940s, there were very few black students at private or state colleges in the North, and almost none in the South.[27]
Responding to the many competing academic philosophies being promoted at the time, an influential working group of educators, known as the Committee of Ten and established in 1892 by the National Education Association, recommended that children should receive twelve years of instruction, consisting of eight years of elementary education (in what were also known as "grammar schools") followed by four years in high school ("freshmen," "sophomores," "juniors," and "seniors").
Gradually by the late 1890s, regional associations of high schools, colleges and universities were being organized to coordinate proper accrediting standards, examinations, and regular surveys of various institutions in order to assure equal treatment in graduation and admissions requirements, as well as course completion and transfer procedures.
20th century
By 1910, 72 percent of children were attending school. Private schools spread during this time, as well as colleges and – in the rural centers – land grant colleges also. Between 1910 and 1940 the high school movement resulted in a rapid increase in public high school enrollment and graduations. By 1930, 100 percent of children were attending school (excluding children with significant disabilities or medical concerns).[28]
By 1938 there was a movement to bring education to six years of elementary school, four years of junior high school, and four years of high school.[29]
During World War II, enrollment in high schools and colleges plummeted as many high school and college students—and teachers—dropped out to enlist or take war jobs.[30][31][32]
The 1946 National School Lunch Act, which is still in operation, provided low-cost or free school lunch meals to qualified low-income students through subsidies to schools, based on the idea that a "full stomach" during the day supported class attention and studying.
The 1954 Supreme Court case Brown v. Board of Education of Topeka, Kansas made racial desegregation of public elementary and high schools mandatory, although white families often attempted to avoid desegregation by sending their children to private secular or religious schools.[33][34][35] In the years following this decision, the number of Black teachers rose in the North but dropped in the South.[36]
In 1965, the far-reaching Elementary and Secondary Education Act ('ESEA'), passed as a part of President Lyndon B. Johnson's War on Poverty, provided funds for primary and secondary education ('Title I funding'). Title VI explicitly forbade the establishment of a national curriculum.[37] Title IV of the Higher Education Act of 1965 created the Pell Grant program which provides financial support to students from low-income families to access higher education.
In 1975, the Education for All Handicapped Children Act established funding for special education in schools.
The Elementary and Secondary Education Act of 1965 made standardized testing a requirement. The Higher Education Amendments of 1972 made changes to the Pell Grants. The 1975 Education for All Handicapped Children Act (EHA) required all public schools accepting federal funds to provide equal access to education and one free meal a day for children with physical and mental disabilities. The 1983 National Commission on Excellence in Education report, famously titled A Nation at Risk, touched off a wave of local, state, and federal reform efforts, but by 1990 the country still spent only 2 percent of its budget on education, compared with 30 percent on support for the elderly.[38] In 1990, the EHA was replaced with the Individuals with Disabilities Education Act (IDEA), which placed more focus on students as individuals, and also provided for more post-high school transition services.
21st century
The 2002 No Child Left Behind Act, passed by a bipartisan coalition in Congress provided federal aid to the states in exchange for measures to penalize schools that were not meeting the goals as measured by standardized state exams in mathematics and language skills.[39][40][41] In the same year, the U.S. Supreme Court diluted some of the century-old "Blaine" laws upheld an Ohio law allowing aid to parochial schools under specific circumstances.[42] The 2006 Commission on the Future of Higher Education evaluated higher education. In December 2015, President Barack Obama signed legislation replacing No Child Left Behind with the Every Student Succeeds Act.[43]
The Great Recession of 2008–09 caused a sharp decline in tax revenues in all cities and states. The response was to cut education budgets. Obama's $800 billion stimulus package included $100 billion for public schools, which every state used to protect its education budget. In terms of sponsoring innovation, however, Obama and his Education Secretary Arne Duncan pursued K-12 education reform through the Race to the Top grant program. With over $15 billion of grants at stake, 34 states quickly revised their education laws according to the proposals of advanced educational reformers. In the competition, points were awarded for allowing charter schools to multiply, for compensating teachers on a merit basis including student test scores, and for adopting higher educational standards. There were incentives for states to establish college and career-ready standards, which in practice meant adopting the Common Core State Standards Initiative that had been developed on a bipartisan basis by the National Governors Association, and the Council of Chief State School Officers. The criteria were not mandatory, they were incentives to improve opportunities to get a grant. Most states revised their laws accordingly, even though they realized it was unlikely they would win a highly competitive new grant. Race to the Top had strong bipartisan support, with centrist elements from both parties. It was opposed by the left wing of the Democratic Party, and by the right wing of the Republican Party, and criticized for centralizing too much power in Washington. Complaints also came from middle-class families, who were annoyed at the increasing emphasis on teaching to the test, rather than encouraging teachers to show creativity and stimulating students' imagination.[44][45]
In the 2010s, student loan debt became recognized as a social problem.[46][47][48][49][50]
In the past centuries, education has been labeled a priority for the future of the United States. Therefore, the continuation of learning is crucial no matter the economic standing of the United States. While the United States has questioned the continuation of education in the past, the unexpected introduction of the coronavirus pandemic (COVID-19) has proposed a threat to traditional public and private school systems. As of March 16, 2020 more than half of the 50 states in the United States have shut down all of their schools[51] in response to COVID-19. With the rest of the school semester being unclear, school systems have been taking a remote approach. By March 26th and May 27th, schools are transitioning classes to online, homeschool style learning[52]. This transition has challenged the United States Education System to adapt to at-home or home-school style learning utilizing technology. In the 21st Century, technology has been a leading recipe to education, and this pandemic shows just that. Although the global coronavirus pandemic forced United States schools' to depend on technology, studies have proved the success with using technology as an educational tool. Technology offers students high quality, current, and relevant information making it easier to process[53]. While it is important for students to receive the most up-to-date information whether learning from home or at school, teachers can also direct students to trusted and informal sources to prevent confusion or misunderstandings. Over the years, data analytics has become embedded in almost every industry's data management, including education[54]. Data Analytics is the science of collecting and analyzing raw data to come up with conclusions based specifically on the data[55]. Educational platforms use data analytics to pinpoint areas of concern for particular students. Based on the students performance, teachers can alter their teaching styles and strategies to accommodate students based on their areas of concerns[56]. Utilizing technology in and outside of the classroom will make you viable to learning other technological skills[57]. Technological skills can vary from communicating by using text, to communicating information through graphs and charts. The usage of technology for educational purposes has also been presumed to improve student participation[58]. Technology acts as an "engagement booster" for students who would not normally speak or participate in the classrooms. When attempting to ask for opinions, teachers can create polling systems, to assure all students are engaged and participating. Based on the classroom performance, teachers can also exercise their creativity through quiz customizations[59]. Teachers can make polling and custom quizzes more engaging and competitive if they choose. In previous years, teachers would spend majority of their time keeping track of attendance, noting tasks completed, and recording quiz and test scores. With the technology the United States Education System has now, these tasks can be fully automated and noted[60]. Considering attendance and grading being automated, teachers can invest that time into other learning activities or strategies.
Although technology has displayed positive outcomes, studies also highlight the negative impact technology can have on the United States of America's Education System. One of the issues regarding technology is the issue of speed[61]. While we can receive information at significant speeds via technology, the accuracy of the information is at stake. Media use is subject to modifications that can change the overall representation of a video, photo or text. With technology acting as a learning tool, technology can also be viewed as a distraction[62]. With so many things out there in the world to study, and so many functions available on these technological devices, it is easy for young adults to fall victim to internet browsing. As mentioned before, technology can engage students whom choose not to speak or participate, however technology generates less verbal communications amongst classmates and teacher[63]. In the United States of America, there is a significant gap between students' of privileged and disadvantaged backgrounds[64]. While virtually almost all students in privileged households have laptops or computers in their household, around 25% of students from disadvantaged backgrounds did not have that technology in their households[65]. The effectiveness of online learning does not only vary amongst social class. Studies have proved that online learning can have more of a negative impact on you at younger ages than at older ages. For younger students it is almost required they have a structured environment[66]. Within structured environment, younger students are more capable of growing in discipline and communication skills. It is a challenge for most teachers to make their learning activities fun and engaging to the younger audience.
In response to COVID-19, many online learning platforms are making their services free due to the high demand. An online tutoring and educational firm, BYJU's, was one of the online learning platforms offering their services free of charge. BYJU's is based in Bangalore, and has seen a 200% increase in the number of students using their services, due to COVID-19. The coronavirus pandemic has resulted in the largest "online movement" in the history of education[67] with approximately 730,000 students actively attending classes via the Tencent Online school in Wuhan, China. While online learning platforms have began to transition their service to free of charge, some school districts are forming partnerships to offer local educational broadcasts for a variety of age groups. One of the partnerships formulated include The Los Angeles Unified School District and PBS SoCal/ KCET[68]. This partnership is offering educational broadcasts to users varying in age groups. The Los Angeles Unified School District and PBS SoCal/ KCET partnership is offering separate channels designated to specific age groups.
Statistics
In 2000, 76.6 million students had enrolled in schools from kindergarten through graduate schools. Of these, 72 percent aged 12 to 17 were considered academically "on track" for their age, i.e. enrolled in at or above grade level. Of those enrolled elementary and secondary schools, 5.2 million (10.4 percent) were attending private schools.
Over 85 percent of the adult population have completed high school and 27 percent have received a bachelor's degree or higher. The average salary for college or university graduates is greater than $51,000, exceeding the national average of those without a high school diploma by more than $23,000, according to a 2005 study by the U.S. Census Bureau.[69] The 2010 unemployment rate for high school graduates was 10.8%; the rate for college graduates was 4.9%. [70]
The country has a reading literacy rate of 99% of the population over age 15,[71] while ranking below average in science and mathematics understanding compared to other developed countries.[72] In 2014, a record high of 82% of high school seniors graduated, although one of the reasons for that success might be a decline in academic standards.[73]
The poor performance has pushed public and private efforts such as the No Child Left Behind Act. In addition, the ratio of college-educated adults entering the workforce to general population (33%) is slightly below the mean of other developed countries (35%)[74] and rate of participation of the labor force in continuing education is high.[75] A 2000s (decade) study by Jon Miller of Michigan State University concluded that "A slightly higher proportion of American adults qualify as scientifically literate than European or Japanese adults".[76]
In 2006, there were roughly 600,000 homeless students in the United States, but after the Great Recession this number more than doubled to approximately 1.36 million.[77] The Institute for Child Poverty and Homelessness keeps track of state by state levels of child homelessness.[78]
Test performance
The test scores of students attending U.S. public schools are lower than student scores in schools of other developed countries, in the areas of reading, math, and science.[79]
Out of 21 industrialized countries, U.S. 12th graders ranked 19th in math, 16th in science, and last in advanced physics.
Educational stages
Formal education in the U.S. is divided into a number of distinct educational stages. Most children enter the public education system around ages five or six. Children are assigned into year groups known as grades.
The American school year traditionally begins at the end of August or early in September, after a traditional summer vacation or break. Children customarily advance together from one grade to the next as a single cohort or "class" upon reaching the end of each school year in late May or early June.
Depending upon their circumstances, children may begin school in pre-kindergarten, kindergarten or first grade. Students normally attend 12 grades of study over 12 calendar years of primary/elementary and secondary education before graduating and earning a diploma that makes them eligible for admission to higher education. Education is mandatory until age 16 (18 in some states).
In the U.S., ordinal numbers (e.g., first grade) are used for identifying grades. Typical ages and grade groupings in contemporary, public and private schools may be found through the U.S. Department of Education. Generally there are three stages: elementary school (K–5th/6th grade), middle school (6th/7th–8th grades) and high school (9th–12th grades).[80]
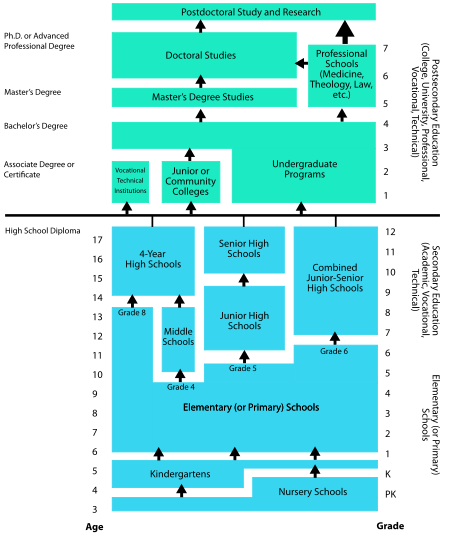
There is considerable variability in the exact arrangement of grades, as the following table indicates.
| General level (or category) | Level | Age | |||
|---|---|---|---|---|---|
| Preschool | Pre-kindergarten | 3–5 | |||
| Compulsory education | |||||
| Elementary school | Kindergarten | 5–6 | |||
| 1st grade | 6–7 | ||||
| 2nd grade | 7–8 | ||||
| 3rd grade | 8–9 | ||||
| 4th grade | 9–10 | ||||
| 5th grade | 10-11 | ||||
| Middle school | 6th grade | 11–12 | |||
| Junior high school | 7th grade | 12–13 | |||
| 8th grade | 13–14 | ||||
| High school | Freshman/9th grade | 14–15 | |||
| Senior high school | Sophomore/10th grade | 15–16 | |||
| Junior/11th grade | 16–17 | ||||
| Senior/12th grade | 17–18 | ||||
| Higher education | |||||
| College (University) | Undergraduate school | First year: "freshman year" | 18–19 | ||
| Second year: "sophomore year" | 19–20 | ||||
| Third year: "junior year" | 20–21 | ||||
| Fourth year: "senior year" | 21–22 | ||||
| Graduate school (with various degrees and curricular partitions thereof) | Ages vary | ||||
| Continuing education | |||||
| Vocational school | Ages vary | ||||
| Adult education | |||||
Variations
In K–12 education, sometimes students who receive failing grades are held back a year and repeat coursework in the hope of earning satisfactory scores on the second try.
High school graduates sometimes take a gap year before the first year of college, for travel, work, public service, or independent learning.
Many undergraduate college programs now commonly are five-year programs. This is especially common in technical fields, such as engineering. The five-year period often includes one or more periods of internship with an employer in the chosen field.
Of students who were freshmen in 2005 seeking bachelor's degrees at public institutions, 32% took four years, 12% took five years, 6% took six years, and 43% did not graduate within six years. The numbers for private non-profit institutions were 52% in four, 10% in five, 4% in six, and 35% failing to graduate.[81]
Some undergraduate institutions offer an accelerated three-year bachelor's degree, or a combined five-year bachelor's and master's degrees.
Many graduate students do not start professional schools immediately after finishing undergraduate studies, but work for a time while saving up money or deciding on a career direction.
The National Center for Education Statistics found that in 1999–2000, 73% of people attending institutions of higher education were non-traditional students.[82]
K–12 education
Schooling is compulsory for all children in the United States, but the age range for which school attendance is required varies from state to state. Some states allow students to leave school between 14–17 with parental permission, before finishing high school; other states require students to stay in school until age 18.[83] Public (free) education is typically from kindergarten to grade 12 (frequently abbreviated K–12).
Most parents send their children to either a public or private institution. According to government data, one-tenth of students are enrolled in private schools. Approximately 85% of students enter the public schools,[84] largely because they are tax-subsidized (tax burdens by school districts vary from area to area). School districts are usually separate from other local jurisdictions, with independent officials and budgets.
There are more than 14,000 school districts in the country,[85] and more than $500 billion is spent each year on public primary and secondary education.[85] Most states require that their school districts within the state teach for 180 days a year.[86] In 2010, there were 3,823,142 teachers in public, charter, private, and Catholic elementary and secondary schools. They taught a total of 55,203,000 students, who attended one of 132,656 schools.[87]
Most children begin elementary education with kindergarten (usually five to six years old) and finish secondary education with twelfth grade (usually 17–18 years old). In some cases, pupils may be promoted beyond the next regular grade. Parents may also choose to educate their own children at home; 1.7% of children are educated in this manner.[84]
Around 3 million students between the ages of 16 and 24 drop out of high school each year, a rate of 6.6 percent as of 2012. In the United States, 75 percent of crimes are committed by high school dropouts. Around 60 percent of black dropouts end up spending time incarcerated.[88] The incarceration rate for African-American male high school dropouts was about 50 times the national average as of 2010.[89]
States do not require reporting from their school districts to allow analysis of efficiency of return on investment. The Center for American Progress commends Florida and Texas as the only two states that provide annual school-level productivity evaluations which report to the public how well school funds are being spent at the local level. This allows for comparison of school districts within a state.[90] In 2010, American students rank 17th in the world. The Organisation for Economic Co-operation and Development says that this is due to focusing on the low end of performers. All of the recent gains have been made, deliberately, at the low end of the socioeconomic scale and among the lowest achievers. The country has been outrun, the study says, by other nations because the US has not done enough to encourage the highest achievers.[91]
About half of the states encourage schools to make their students recite the Pledge of Allegiance to the flag daily.[92]
Teachers worked from about 35 to 46 hours a week, in a survey taken in 1993.[93] In 2011, American teachers worked 1,097 hours in the classroom, the most for any industrialized nation measured by the Organisation for Economic Co-operation and Development. They spend 1,913 hours a year on their work, just below the national average of 1,932 hours for all workers.[94] In 2011, the average annual salary of a preK–12 teacher was $55,040.[95]
Transporting students to and from school is a major concern for most school districts. School buses provide the largest mass transit program in the country, 8.8 billion trips per year. Non-school transit buses give 5.2 billion trips annually. 440,000 yellow school buses carry over 24 million students to and from schools.[96] In 1971, the Supreme Court ruled unanimously that forced busing of students may be ordered to achieve racial desegregation.[97] This ruling resulted in a white flight from the inner cities which largely diluted the intent of the order. This flight had other, non-educational ramifications as well. Integration took place in most schools though de facto segregation often determined the composition of the student body. By the 1990s, most areas of the country had been released from mandatory busing.
School start times are computed with busing in mind. There are often three start times: for elementary, for middle/junior high school, and for high school. One school district computed its cost per bus (without the driver) at $20,575 annually. It assumed a model where the average driver drove 80 miles per day. A driver was presumed to cost $.62 per mile (1.6 km). Elementary schools started at 7:30, middle schools/junior high school started at 8:30, and high schools at 8:15. While elementary school started earlier, they also finish earlier, at 2:30, middle schools at 3:30 and high schools at 3:20.[98] All school districts establish their own times and means of transportation within guidelines set by their own state.
Grade placement
Schools use several methods to determine grade placement. One method involves placing students in a grade based on a child's birthday. Cut off dates based on the child's birthday determine placement in either a higher or lower grade level. For example, if the school's cut off date is September 1, and an incoming student's birthday is August 2, then this student would be placed in a higher grade level.[99] If the student is in high school, this could mean that the student gets placed as a junior instead of a sophomore because of their birthday. If the student's birthday falls after the cut off date, such as November 1, then they would be placed in the lower grade, which in this example, would be a sophomore.
Preschool
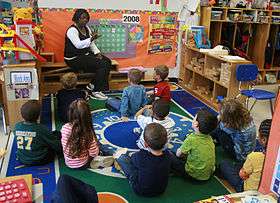
Preschool (sometimes called pre-kindergarten or jr. kindergarten) refers to non-compulsory classroom-based early-childhood education. The Head Start program is a federally funded early childhood education program for low-income children and their families founded in 1965 prepares children, especially those of a disadvantaged population, to better succeed in school. However, limited seats are available to students aspiring to take part in the Head Start program. Many community-based programs, commercial enterprises, non-profit organizations, faith communities, and independent childcare providers offer preschool education. Preschool may be general or may have a particular focus, such as arts education, religious education, sports training, or foreign language learning, along with providing general education. In the United States, Preschool programs are not required, however they are encouraged by educators. Only 69 percent of 4-year-old American children are enrolled in preschool. Preschool age ranges anywhere from 3 to 5 years old. The curriculum for the day will consist of music, art, pretend play, science, reading, math, and other social activities.
Primary education
Historically, in the United States, local public control (and private alternatives) have allowed for some variation in the organization of schools. Elementary school includes kindergarten through sixth grade (or sometimes, to fourth grade, fifth grade or eighth grade). Basic subjects are taught in elementary school, and students often remain in one classroom throughout the school day, except for specialized programs, such as physical education, library, music, and art classes. There are (as of 2001) about 3.6 million children in each grade in the United States.[100]
Typically, the curriculum in public elementary education is determined by individual school districts or county school system. The school district selects curriculum guides and textbooks that reflect a state's learning standards and benchmarks for a given grade level. The most recent curriculum that has been adopted by most states is Common Core.[101] Learning Standards are the goals by which states and school districts must meet adequate yearly progress (AYP) as mandated by No Child Left Behind (NCLB). This description of school governance is simplistic at best, however, and school systems vary widely not only in the way curricular decisions are made but also in how teaching and learning take place. Some states or school districts impose more top-down mandates than others. In others, teachers play a significant role in curriculum design and there are few top-down mandates. Curricular decisions within private schools are often made differently from in public schools, and in most cases without consideration of NCLB.
Public elementary school teachers typically instruct between twenty and thirty students. A typical classroom will include children with a range of learning needs or abilities, from those identified as having special needs of the kinds listed in the Individuals with Disabilities Act IDEA to those that are cognitively, athletically or artistically disabled. At times, an individual school district identifies areas of need within the curriculum. Teachers and advisory administrators form committees to develop supplemental materials to support learning for diverse learners and to identify enrichment for textbooks. There are special education teachers working with the identified students. Many school districts post information about the curriculum and supplemental materials on websites for public access.[102]
In general, a student learns basic arithmetic and sometimes rudimentary algebra in mathematics, English proficiency (such as basic grammar, spelling, and vocabulary), and fundamentals of other subjects. Learning standards are identified for all areas of a curriculum by individual States, including those for mathematics, social studies, science, physical development, the fine arts, and reading.[101] While the concept of State Learning standards has been around for some time, No Child Left Behind has mandated that standards exist at the State level.
Secondary education
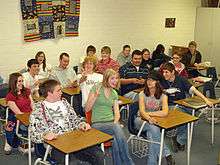
Secondary education is often divided into two phases, middle/junior high school and high school. Students are usually given more independence, moving to different classrooms for different subjects, and being allowed to choose some of their class subjects (electives).
"Middle school" (or "junior high school") has a variable range between districts. It usually includes seventh and eighth grades and occasionally also includes one or more of the sixth, ninth, and very occasionally fifth grades as well. High school (occasionally senior high school) includes grades 9 through 12. Students in these grades are commonly referred to as freshmen (grade 9), sophomores (grade 10), juniors (grade 11) and seniors (grade 12). At the high school level, students generally take a broad variety of classes without specializing in any particular subject, with the exception of vocational schools. Students are generally required to take a broad range of mandatory subjects, but may choose additional subjects ("electives") to fill out their required hours of learning. High school grades normally are included in a student's official transcript, e.g. for college admission.
Each state sets minimum requirements for how many years of various mandatory subjects are required; these requirements vary widely, but generally include 2–4 years of each of: Science, Mathematics, English, Social sciences, Physical education; some years of a foreign language and some form of art education are often also required, as is a health curriculum in which students learn about anatomy, nutrition, first aid, sexuality, drug awareness, and birth control. In many cases, however, options are provided for students to "test out" of this requirement or complete independent study to meet it.
Many high schools provide Honors, Advanced Placement (AP) or International Baccalaureate (IB) courses. These are special forms of honors classes where the curriculum is more challenging and lessons more aggressively paced than standard courses. Honors, AP or IB courses are usually taken during the 11th or 12th grade of high school, but may be taken as early as 9th grade. Some international schools offer international school leaving qualifications, to be studied for and awarded instead of or alongside of the high school diploma, Honors, Advanced Placement, or International Baccalaureate. Regular honors courses are more intense and faster paced than typical college preparatory courses. AP and IB on the other hand, are college-level classes.
Tracking (streaming)
Tracking is the practice of dividing students at the primary or secondary school level into classes on the basis of ability or achievement. One common use is to offer different curricula for students preparing for college and for those preparing for direct entry into technical schools or the workplace.
Grading scale
In schools in the United States children are assessed throughout the school year by their teachers, and report cards are issued to parents at varying intervals. Generally the scores for individual assignments and tests are recorded for each student in a grade book, along with the maximum number of points for each assignment. End-of-term or -year evaluations are most frequently given in the form of a letter grade on an A-F scale, whereby A is the best possible grade and F is a failing grade (most schools do not include the letter E in the assessment scale), or a numeric percentage. The Waldorf schools,[103][104] most democratic schools,[105] and some other private schools, give (often extensive) verbal characterizations of student progress rather than letter or number grades. Some school districts allow flexibility in grading scales at the Student information system level, allowing custom letters or symbols to be used (though transcripts must use traditional A-F letters)
| A | B | C | D | F | ||||||||||
|---|---|---|---|---|---|---|---|---|---|---|---|---|---|---|
| + | – | + | – | + | – | + | – | |||||||
| 100.0–97.0 | 96.9–93.0 | 92.9–90.0 | 89.9–87.0 | 86.9–83.0 | 82.9–80.0 | 79.9–77.0 | 76.9–73.0 | 72.9–70.0 | 69.9–67.0 | 66.9–63.0 | 62.9–60.0 | 59.9–0.0 | ||
Traditionally, Colleges and Universities tend to take on the formal letter grading scale, consisting of A, B, C, D, and F, as a way to base ones performance. In result to the COVID-19 pandemic, most Colleges and Universities were flooded with petitions proposing pass or fail options for students considering the difficulties with transitioning and managing during a state of emergency. Although most colleges and universities empathized with students expressing their frustration with transitioning online, transfer students implementing the pass or fail option are forecasted to having to retake the class[106]. College credits for pass or fail classes have a low rate of being accepted by other colleges, forcing transfer students to sit through and pay for the same class they have already completed. While some colleges, such as the University of Wisconsin-Madison, Carnegie Mellon University, and North Carolina are permitting their students from weeks to months, to decide whether they will implement the pass or fail option offered by their college[107]. While Harvard Medical School has previously been opposed to pass or fail grades, they have opened up to accepting pass grades.
Standardized testing
Under the No Child Left Behind Act and Every Student Succeeds Acts, all American states must test students in public schools statewide to ensure that they are achieving the desired level of minimum education,[108] such as on the New York Regents Examinations, the Florida Comprehensive Assessment Test (FCAT) or the Massachusetts Comprehensive Assessment System (MCAS); students being educated at home or in private schools are not included. The act also required that students and schools show adequate yearly progress. This means they must show some improvement each year. When a student fails to make adequate yearly progress, NCLB mandated that remediation through summer school or tutoring be made available to a student in need of extra help. On December 10, 2015 President Barack Obama signed legislation replacing NCLB with the Every Student Succeeds Act (ESSA).[43] However, the enactment of ESSA did not eliminate provisions relating to the periodic standardized tests given to students.[109][110]
Academic performance impacts the perception of a school's educational program. Rural schools fare better than their urban counterparts in two key areas: test scores and drop-out rate. First, students in small schools performed equal to or better than their larger school counterparts.[111] In addition, on the 2005 National Assessment of Education Progress, 4th and 8th grade students scored as well or better in reading, science, and mathematics.[112]
During high school, students (usually in 11th grade) may take one or more standardized tests depending on their post-secondary education preferences and their local graduation requirements. In theory, these tests evaluate the overall level of knowledge and learning aptitude of the students. The SAT and ACT are the most common standardized tests that students take when applying to college. A student may take the SAT, ACT, both, or neither depending upon the post-secondary institutions the student plans to apply to for admission. Most competitive post-secondary institutions also require two or three SAT Subject Tests (formerly known as SAT IIs), which are shorter exams that focus strictly on a particular subject matter. However, all these tests serve little to no purpose for students who do not move on to post-secondary education, so they can usually be skipped without affecting one's ability to graduate.
Standardized testing has become increasingly controversial in recent years. Creativity and the need for applicable knowledge are becoming rapidly more valuable than simple memorization. Opponents of standardized education[113] have stated that it is the system of standardized education itself[114] that is to blame for employment issues and concerns over the questionable abilities of recent graduates.[115][116][117][118] Others consider standardized tests to be a valuable objective check on grade inflation. In recent years, grade point averages (particularly in suburban schools) have been rising while SAT scores have been falling.[119]
Suggestions for improving standardized testing include evaluating a student's overall growth, possibly including non-cognitive qualities such as social and emotional behaviors, not just achievement; introducing 21st century skills and values; and making the tests open-ended, authentic, and engaging.[120]
Most Universities are eliminating standardized testing due to the unfairness toward the candidates expected to participate in later test dates. According to Harvard College, this year they will make standardized test scores optional, empathizing with students having trouble scheduling exams during the coronavirus pandemic[121].
Extracurricular activities
A major characteristic of American schools is the high priority given to sports, clubs and activities by the community, the parents, the schools and the students themselves.[122] Extracurricular activities are educational activities not falling within the scope of the regular curriculum but under the supervision of the school. Extracurriculars at the high school age (15–18)[123] can be anything that doesn't require a high school credit or paid employment, but simply done out of pleasure or to also look good on a college transcript. Extracurricular activities for all ages can be categorized under clubs, art, culture and language, community, leadership, government, media, military, music, performing arts, religion, role play/fantasy, speech, sports, technology, and volunteer,[124] all of which take place outside of school hours. These sorts of activities are put in place as other forms of teamwork, time management, goal setting, self-discovery, building self-esteem, relationship building, finding interests, and academics. These extracurricular activities and clubs can be sponsored by fund raising, or by the donation of parents who give towards the program in order for it to keep running. Students and Parents are also obligated to spend money on whatever supplies are necessary for this activity that are not provided for the school (sporting equipment, sporting attire, costumes, food, instruments).[125] These activities can extend to large amounts of time outside the normal school day; home-schooled students, however, are not normally allowed to participate. Student participation in sports programs, drill teams, bands, and spirit groups can amount to hours of practices and performances. Most states have organizations that develop rules for competition between groups. These organizations are usually forced to implement time limits on hours practiced as a prerequisite for participation. Many schools also have non-varsity sports teams; however, these are usually afforded fewer resources and less attention.
Sports programs and their related games, especially football and basketball, are major events for American students and for larger schools can be a major source of funds for school districts.
High school athletic competitions often generate intense interest in the community.
In addition to sports, numerous non-athletic extracurricular activities are available in American schools, both public and private. Activities include Quizbowl,[126] musical groups, marching bands, student government, school newspapers, science fairs, debate teams, and clubs focused on an academic area (such as the Spanish Club) or community service interests (such as Key Club).[127]
Education of students with special needs
Commonly known as special classes, are taught by teachers with training in adapting curricula to meet the needs of students with special needs.
According to the National Association of School Nurses, 5% of students in 2009 have a seizure disorder,[128] another 5% have ADHD and 10% have mental or emotional disorders.[129]
On January 25, 2013, the Office for Civil Rights of the US Department of Education issued guidance, clarifying school districts' existing legal obligations to give disabled students an equal chance to compete in extracurricular sports alongside their able-bodied classmates.[130]
- Educating children with disabilities
The federal law, Individuals with Disabilities Education Act (IDEA) requires states to ensure that all government-run schools provide services to meet the individual needs of students with special needs, as defined by the law.[131] All students with special needs are entitled to a free and appropriate public education (FAPE).
Schools meet with the parents or guardians to develop an Individualized Education Program that determines best placement for the child. Students must be placed in the least restrictive environment (LRE) that is appropriate for the student's needs. Public schools that fail to provide an appropriate placement for students with special needs can be taken to due process wherein parents may formally submit their grievances and demand appropriate services for the child.
In 2017, nationwide 67.1% of students with disabilities attending public schools graduated high school.[132]
- Criticism
At-risk students (those with educational needs that are not associated with a disability) are often placed in classes with students with minor emotional and social disabilities.[133] Critics assert that placing at-risk students in the same classes as these disabled students may impede the educational progress of both the at-risk and the disabled students. Some research has refuted this assertion, and has suggested this approach increases the academic and behavioral skills of the entire student population.[134]
Public and private schools
In the United States, state and local government have primary responsibility for education. The Federal Department of Education plays a role in standards setting and education finance, and some primary and secondary schools, for the children of military employees, are run by the Department of Defense.[135]
K–12 students in most areas have a choice between free tax-funded public schools, or privately funded private schools.
Public school systems are supported by a combination of local, state, and federal government funding. Because a large portion of school revenues come from local property taxes, public schools vary widely in the resources they have available per student. Class size also varies from one district to another. Curriculum decisions in public schools are made largely at the local and state levels; the federal government has limited influence. In most districts, a locally elected school board runs schools. The school board appoints an official called the superintendent of schools to manage the schools in the district.
Local property taxes for public school funding may have disadvantages depending on how wealthy or poor these cities may be. Some of the disadvantages may be not having the proper electives of students interest or advanced placement courses to further the knowledge and education of these students. Cases such as these limit students and causes inequality in education because there is no easy way to gain access to those courses since the education system might not view them as necessary. The public education system does provide the classes needed to obtain a GED (General Education Development) and obtain a job or pursue higher education.[136]
The largest public school system in the United States is in New York City, where more than one million students are taught in 1,200 separate public schools. Because of its immense size – there are more students in the system than residents in the eight smallest US states – the New York City public school system is nationally influential in determining standards and materials, such as textbooks.
Admission to individual public schools is usually based on residency. To compensate for differences in school quality based on geography, school systems serving large cities and portions of large cities often have magnet schools that provide enrollment to a specified number of non-resident students in addition to serving all resident students. This special enrollment is usually decided by lottery with equal numbers of males and females chosen. Some magnet schools cater to gifted students or to students with special interests, such as the sciences or performing arts.[137]
Private schools in the United States include parochial schools (affiliated with religious denominations),[138] non-profit independent schools, and for-profit private schools. Private schools charge varying rates depending on geographic location, the school's expenses, and the availability of funding from sources, other than tuition. For example, some churches partially subsidize private schools for their members. Some people have argued that when their child attends a private school, they should be able to take the funds that the public school no longer needs and apply that money towards private school tuition in the form of vouchers. This is the basis of the school choice movement.
5,072,451 students attended 33,740 private elementary and secondary schools in 2007. 74.5% of these were Caucasian, non-Hispanic, 9.8% were African American, 9.6% were Hispanic. 5.4% were Asian or Pacific Islander, and .6% were American Indian. Average school size was 150.3 students. There were 456,266 teachers. The number of students per teacher was about 11. 65% of seniors in private schools in 2006–07 went on to attend a four-year college.[139]
Private schools have various missions: some cater to college-bound students seeking a competitive edge in the college admissions process; others are for gifted students, students with learning disabilities or other special needs, or students with specific religious affiliations. Some cater to families seeking a small school, with a nurturing, supportive environment. Unlike public school systems, private schools have no legal obligation to accept any interested student. Admission to some private schools is often highly selective.
An August 17, 2000 article by the Chicago Sun-Times refers to the Roman Catholic Archdiocese of Chicago Office of Catholic Schools as the largest private school system in the United States.[140]
Charter schools
The charter school movement began in 1990 and have spread rapidly in the United States, members, parents, teachers, and students to allow for the "expression of diverse teaching philosophies and cultural and social life styles."[141]
Home schooling
In 2014, approximately 1.5 million children were homeschooled, up 84% from 1999 when the U.S. Department of Education first started keeping statistics. This was 2.9% of all children.[142]
As of spring 2016, there are 2.3 million homeschooled students in the United States. It is appearing that homeschooling is a continuing trend in the US with a 2 percent to 8 percent per annum over the past few years[143] Many select moral or religious reasons for homeschooling their children. The second main category is unschooling, those who prefer a non-standard approach to education.[142] This is a parent-led type of schooling that takes place at home and is now boarding a mainstream form of education in the United States. The Demography for homeschoolers has a variety of people; these are atheists, Christians, and Mormons; conservatives, libertarians, and liberals; low-, middle-, and high-income families; black, Hispanic, and white; parents with PhDs, GEDs, and no high-school diplomas. One study shows that 32 percent of homeschool students are Black, Asian, Hispanic, and others (i.e., not White/non-Hispanic). There is no required taxes on this form of education and most homeschooled families spend an average of $600 per student for their education[144]
Opposition to homeschooling comes from varied sources, including teachers' organizations and school districts. The National Education Association, the largest labor union in the United States, has been particularly vocal in the past.[145] Opponents' stated concerns fall into several broad categories, including fears of poor academic quality, and lack of socialization with others. At this time, over half of states have oversight into monitoring or measuring the academic progress of home schooled students, with all but ten requiring some form of notification to the state.[146]
Higher education
| Education | Percentage |
|---|---|
| High school graduate | 89.8% |
| Some college | 61.20% |
| Associate degree | 45.16% |
| Bachelor's degree | 34.9% |
| Master's degree | 13.05% |
| Doctorate or professional degree | 3.5% |
Higher education in the United States is an optional final stage of formal learning following secondary education, often at one of the 4,495 colleges or universities and junior colleges in the country.[147] In 2008, 36% of enrolled students graduated from college in four years. 57% completed their undergraduate requirements in six years, at the same college they first enrolled in.[148] The U.S. ranks 10th among industrial countries for percentage of adults with college degrees.[70] Over the past 40 years the gap in graduation rates for wealthy students and low income students has widened significantly. 77% of the wealthiest quartile of students obtained undergraduate degrees by age 24 in 2013, up from 40% in 1970. 9% of the least affluent quartile obtained degrees by the same age in 2013, up from 6% in 1970.[149]
There are over 7000 post-secondary institutions in the United States offering a diverse number of programs catered to students with different aptitudes, skills, and educational needs.[150] Compared with the higher education systems of other countries, post-secondary education in the United States is largely deregulated, giving students a variety of choices. Common admission requirements to gain entry to any American university requires a meeting a certain age threshold, high school transcript documenting grades, coursework, and rigour of core high school subject areas as well as performance in AP and IB courses, class ranking, ACT or SAT scores, extracurricular activities, an admissions essay, and letters of recommendation from teachers and guidance counselors. Other admissions criteria may include an interview, personal background, legacy preferences (family members having attended the school), ability to pay tuition, potential to donate money to the school development case, evaluation of student character (based on essays or interviews), and general discretion by the admissions office. While universities will rarely list that they require a certain standardized test score, class ranking, or GPA for admission, each university usually has a rough threshold below which admission is unlikely.
University
_seen_from_the_southeast_with_the_Italian_Pavilion_in_the_foreground.jpg)
The traditional path to American higher education is typically through a university, the most prestigious form of higher education in the United States. Universities in the United States are institutions that issue bachelor's, master's, professional, or doctorate degrees. Some universities offer programs at all degree levels from the associate to the doctorate, and are distinguished from community and junior colleges where the highest degree offered is the associate degree or a diploma. Though there is no prescribed definition of a "university" or "college" in the United States, universities are generally research-oriented institutions offering undergraduate, graduate, and professional programs. American universities come in a variety of forms that serve different educational needs. Some counties and cities have established and funded four-year institutions. Some of these institutions, such as the City University of New York, are still operated by local governments. Others such as the University of Louisville and Wichita State University are now operated as state universities. Four-year institutions may be public or private colleges or universities. Private institutions are privately funded and there is a wide variety in size, focus, and operation. Some private institutions are large research universities, while others are small liberal arts colleges that concentrate on undergraduate education. Some private universities are nonsectarian and secular, while others are religiously-affiliated.
Among the United States' most prominent and world renowned institutions are large research universities that are ranked in such annual publications such as the Times Higher Education World University Rankings, QS World University Rankings, U.S. News & World Report, Washington Monthly, ARWU, by test preparation services such as The Princeton Review or by another university such as the Top American Research Universities ranked by the University of Florida's The Center.[151] These rankings are based on factors such as brand recognition, number of Nobel Prize winners, selectivity in admissions, generosity of alumni donors, and volume and quality of faculty research. Among the top forty domestically and internationally ranked institutions identified by the QS 2020 rankings include six of the eight Ivy League schools; private universities Stanford, The University of Chicago, Johns Hopkins, Duke, Northwestern, and New York University; 2 of the 10 schools in the University of California system (UC Berkeley and UCLA); and the research intensive institutions CalTech and MIT.[152] Other types of universities in the United States include liberal arts schools (Reed College, Mount Holyoke College, Barnard College), religiously affiliated and denomination universities (DePaul University, Brigham Young University, Yeshiva University), military (United States Military Academy, United States Merchant Marine Academy, United States Naval Academy), art and design schools (Berklee College of Music, Juilliard School, Fashion Institute of Technology, Parsons School of Design, Rhode Island School of Design), Historically black colleges and universities (Morehouse College, Howard University, Kentucky State University), and for-profit universities (University of Phoenix, Western International University, Liberty University).[153] While most private institutions are non-profit, a growing number in the past decade have been established as for-profit. The American university curriculum varies widely depending on the program and institution. Typically, an undergraduate student will be able to select an academic "major" or concentration, which comprises the core main or special subjects, and students may change their major one or more times.
Some students, typically those with a bachelor's degree, may choose to continue on to graduate or professional school, which are graduate and professional institutions typically attached to a university. Graduate degrees may be either master's degrees (e.g., M.A., M.S., M.S.W.), professional degrees's (e.g. M.B.A., J.D., M.D.) or doctorate degrees (e.g. PhD). Programs range from full-time, evening and executive which allows for flexibility with students' schedules.[154] Academia-focused graduate school typically includes some combination of coursework and research (often requiring a thesis or dissertation to be written), while professional graduate-level schools grants a first professional degree. These include medical, law, business, education, divinity, art, journalism, social work, architecture, and engineering schools.
Vocational
Community and junior colleges in the United States are public comprehensive institutions that offer a wide range of educational services that generally lasts two years. Community colleges are generally publicly funded (usually by local cities or counties) and offer career certifications and part-time programs. Though it is cheaper in terms of tuition, less competitive to get into, and not as prestigious as going to a four-year university, they form another post-secondary option for students seeking to enter the realm of American higher education. Community and junior colleges generally emphasize practical career oriented education that is focused on a vocational curriculum.[155] Though some community and junior colleges offer accredited bachelor's degree programs, community and junior colleges typically offer a college diploma or an associate degree such as an A.A., A.S., or a vocational certificate, although some community colleges offer a limited number of bachelor's degrees. Community and junior colleges also offer trade school certifications for skilled trades and technical careers. Students can also earn credits at a community or junior college and transfer them to a four-year university afterwards. Many community colleges have relationships with four-year state universities and colleges or even private universities that enable some community college students to transfer to these universities to pursue a bachelor's degree after the completion of a two-year program at the community college.
Cost
A few charity institutions cover all of the students' tuition, although scholarships (both merit-based and need-based) are widely available. Generally, private universities charge much higher tuition than their public counterparts, which rely on state funds to make up the difference. Because each state supports its own university system with state taxes, most public universities charge much higher rates for out-of-state students.
Annual undergraduate tuition varies widely from state to state, and many additional fees apply. In 2009, average annual tuition at a public university (for residents of the state) was $7,020.[148] Tuition for public school students from outside the state is generally comparable to private school prices, although students can often qualify for state residency after their first year. Private schools are typically much higher, although prices vary widely from "no-frills" private schools to highly specialized technical institutes. Depending upon the type of school and program, annual graduate program tuition can vary from $15,000 to as high as $50,000. Note that these prices do not include living expenses (rent, room/board, etc.) or additional fees that schools add on such as "activities fees" or health insurance. These fees, especially room and board, can range from $6,000 to $12,000 per academic year (assuming a single student without children).[158]
The mean annual total cost (including all costs associated with a full-time post-secondary schooling, such as tuition and fees, books and supplies, room and board), as reported by collegeboard.com for 2010:[159]
- Public university (4 years): $27,967 (per year)
- Private university (4 years): $40,476 (per year)
Total, four-year schooling:
- Public university: $111,868
- Private university: $161,904
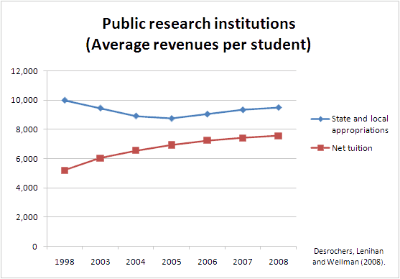
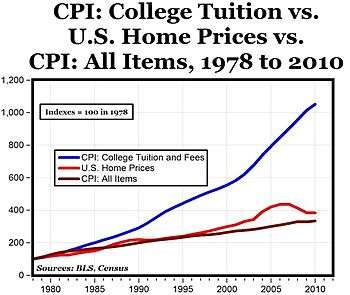
College costs are rising at the same time that state appropriations for aid are shrinking. This has led to debate over funding at both the state and local levels. From 2002 to 2004 alone, tuition rates at public schools increased over 14 percent, largely due to dwindling state funding. An increase of 6 percent occurred over the same period for private schools.[158] Between 1982 and 2007, college tuition and fees rose three times as fast as median family income, in constant dollars.[160]
From the US Census Bureau, the median salary of an individual who has only a high school diploma is $27,967; The median salary of an individual who has a bachelor's degree is $47,345.[161] Certain degrees, such as in engineering, typically result in salaries far exceeding high school graduates, whereas degrees in teaching and social work fall below.
The debt of the average college graduate for student loans in 2010 was $23,200.[162]
A 2010 study indicates that the return on investment for graduating from the top 1000 colleges exceeds 4% over a high school degree.[163]
Student loan debt
In 2018, student loan debt topped $1.5 trillion. More than 40 million people hold college debt, which is largely owned by the US government and serviced by companies such as Navient. Student loan debt has reached levels that have affected US society, reducing opportunities for millions of people following college.[164]
Sen. Bernie Sanders, as part of 2020 presidential campaign in June 2019, proposed a legislation that would free approximately 45 million Americans from a combined debt of $1.6 trillion as student loan. “We will make a full and complete education a human right,” Sanders said.[165]
Coronavirus Pandemic
With the unforeseen appearance of COVID-19, colleges and universities are in jeopardy of shutting down for good. Universities are being forced to refund money to students, invest in online technology and tools, making it harder to invest into empty campuses. Schools are defined as being in low financial health if their combined revenue and unrestricted assets will nolonger cover operating expenses in 6 years. Before COVID-19, 13 institutions were in danger of closing within 6 years in New England[166]. With the presence of COVID-19, that number has increased to 25 institutions[167]. Nationwide, because of the financial impact caused by the coronavirus pandemic, 110 more colleges and universities are now at risk of closing. This labels the total number of colleges and universities in peril due to coronavirus pandemic to be 345 institutions[168]. While prestigious colleges and universities have historically had financial cushion due to high levels of enrollment, private colleges at a low risk have dropped from 485 to 385[169]. Federal coronavirus relief has assisted students and universities, however it has not been enough to bandage the financial wound created by COVID-19. Colby-Sawyer College located in New Hampshire has received about $780,000 in assistance through the United States Department of Education[170] . About half of this money was dispersed amongst the student body. Colby-Swayer College was also capable of receiving a loan of $2.65 million, to avoid layoffs of their 312 employees[171].
Academic labor and adjunctification
According to Uni in the USA, "One of the reasons American universities have thrived is due to their remarkable management of financial resources."[172] To combat costs colleges have hired adjunct professors to teach. In 2008 these teachers cost about $1,800 per 3-credit class as opposed to $8,000 per class for a tenured professor. Two-thirds of college instructors were adjuncts. There are differences of opinion whether these adjuncts teach better or worse than regular professors. There is a suspicion that student evaluation of adjuncts, along with their subsequent continued employment, can lead to grade inflation.[173]
Credential inflation
Economics professor Alan Zagier blames credential inflation for the admission of so many unqualified students into college. He reports that the number of new jobs requiring college degrees is less than the number of college graduates.[70] He states that the more money that a state spends on higher education, the slower the economy grows, the opposite of long held notions.[70] Other studies have shown that the level of cognitive achievement attained by students in a country (as measured by academic testing) is closely correlated with the country's economic growth, but that "increasing the average number of years of schooling attained by the labor force boosts the economy only when increased levels of school attainment also boost cognitive skills. In other words, it is not enough simply to spend more time in school; something has to be learned there."[174]
Governance and funding
Governance
Currently, the state and national governments share power over public education, with the states exercising most of the control. Except for Hawaii, states delegate power to county, city or township-level school boards that exercise control over a school district. Some school districts may further delegate significant authority to principals, such as those who have adopted the Portfolio strategy.
The U.S. federal government exercises its control through the U.S. Department of Education. Education is not mentioned in the constitution of the United States, but the federal government uses the threat of decreased funding to enforce laws pertaining to education.[135] Under recent administrations, initiatives such as the No Child Left Behind Act and Race to the Top have attempted to assert more central control in a heavily decentralized system.
Nonprofit private schools are widespread, are largely independent of the government, and include secular as well as parochial schools. Educational accreditation decisions for private schools are made by voluntary regional associations.
Funding for K–12 schools
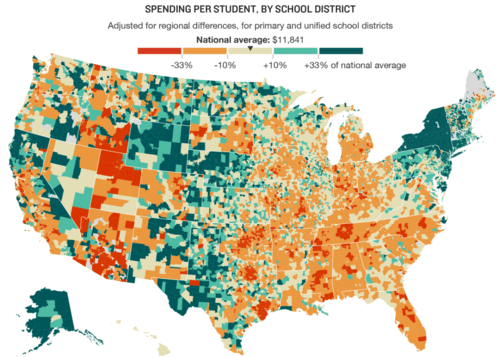

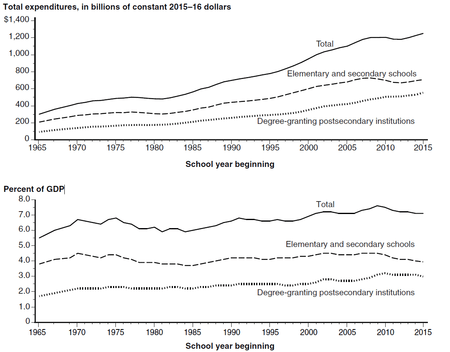
According to a 2005 report from the OECD, the United States is tied for first place with Switzerland when it comes to annual spending per student on its public schools, with each of those two countries spending more than $11,000.[175] However, the United States is ranked 37th in the world in education spending as a percentage of gross domestic product. All but seven of the leading countries are developing countries; ranked high because of a low GDP.[176]
Figures exist for education spending in the United States, both total and per student, and by state and school district. They show a very wide range in spending, but due to the varying spending policies and circumstances among school districts, a cost-effectiveness analysis is very difficult to perform.[177][178][179][180]
Changes in funding appear to have little effect on a school system's performance. Between 1970 and 2012, the full amount spent by all levels of government on the K–12 education of an individual public school student graduating in any given year, adjusted for inflation, increased by 185%. The average funding by state governments increased by 120% per student. However, scores in mathematics, science and language arts over that same period remained almost unchanged. Multi-year periods in which a state's funding per student declined substantially also appear to have had little effect.[181]
Property taxes as a primary source of funding for public education have become highly controversial, for a number of reasons. First, if a state's population and land values escalate rapidly, many longtime residents may find themselves paying property taxes much higher than anticipated. In response to this phenomenon, California's citizens passed Proposition 13 in 1978, which severely restricted the ability of the Legislature to expand the state's educational system to keep up with growth. Some states, such as Michigan, have investigated or implemented alternative schemes for funding education that may sidestep the problems of funding based mainly on property taxes by providing funding based on sales or income tax. These schemes also have failings, negatively impacting funding in a slow economy.[182]
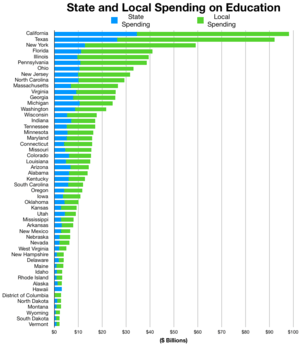
One of the biggest debates in funding public schools is funding by local taxes or state taxes. The federal government supplies around 8.5% of the public school system funds, according to a 2005 report by the National Center for Education Statistics."Revenues and Expenditures for Public Elementary and Secondary Education, Table 1". National Center for Education Statistics. Retrieved June 4, 2014. The remaining split between state and local governments averages 48.7 percent from states and 42.8 percent from local sources.[183]
Rural schools struggle with funding concerns. State funding sources often favor wealthier districts. The state establishes a minimum flat amount deemed "adequate" to educate a child based on equalized assessed value of property taxes. This favors wealthier districts with a much larger tax base. This, combined with the history of slow payment in the state, leaves rural districts searching for funds. Lack of funding leads to limited resources for teachers. Resources that directly relate to funding include access to high-speed internet, online learning programs and advanced course offerings.[112] These resources can enhance a student's learning opportunities, but may not be available to everyone if a district cannot afford to offer specific programs. One study found that school districts spend less efficiently in areas in which they face little or no competition from other public schools, in large districts, and in areas in which residents are poor or less educated.[184] Some public schools are experimenting with recruiting teachers from developing countries in order to fill the teacher shortage, as U.S. citizens with college degrees are turning away from the demanding, low paid profession.[185]
Judicial intervention
The reliance on local funding sources has led to a long history of court challenges about how states fund their schools. These challenges have relied on interpretations of state constitutions after a U.S. Supreme Court ruling that school funding was not a matter of the U.S. Constitution (San Antonio independent school District v. Rodriguez, 411 U.S. 1 (1973)). The state court cases, beginning with the California case of Serrano v. Priest, 5 Cal.3d 584 (1971), were initially concerned with equity in funding, which was defined in terms of variations in spending across local school districts. More recently, state court cases have begun to consider what has been called 'adequacy.' These cases have questioned whether the total amount of spending was sufficient to meet state constitutional requirements. Perhaps the most famous adequacy case is Abbott v. Burke, 100 N.J. 269, 495 A.2d 376 (1985), which has involved state court supervision over several decades and has led to some of the highest spending of any U.S. districts in the so-called Abbott districts. The background and results of these cases are analyzed in a book by Eric Hanushek and Alfred Lindseth.[186] That analysis concludes that funding differences are not closely related to student outcomes and thus that the outcomes of the court cases have not led to improved policies.
In McCleary v. Washington State (2012),[187] Supreme Court decision that found the state had failed to "amply" fund public education for Washington's 1 million school children. Washington state had budgeted $18.2 billion for education spending in the two-year fiscal period ending in July 2015. The state Supreme Court decided that this budget must be boosted by $3.3 billion in total by July 2019. On September 11, 2014, the state Supreme Court found the legislature in contempt for failing to uphold a court order to come up with a plan to boost its education budget by billions of dollars over the next five years. The state had argued that it had adequately funded education and said diverting tax revenue could lead to shortfalls in other public services.[188]
Pensions
While the hiring of teachers for public schools is done at the local school district level, the pension funds for teachers are usually managed at the state level. Some states have significant deficits when future requirements for teacher pensions are examined. In 2014, these were projected deficits for various states: Illinois -$187 billion, Connecticut -$57 billion, Kentucky -$41 billion, Hawaii -$16.5 billion, and Louisiana -$45.6 billion. These deficits range from 184% to 318% of these states' annual total budget.[189]
Funding for college
At the college and university level student loan funding is split in half; half is managed by the Department of Education directly, called the Federal Direct Student Loan Program (FDSLP). The other half is managed by commercial entities such as banks, credit unions, and financial services firms such as Sallie Mae, under the Federal Family Education Loan Program (FFELP). Some schools accept only FFELP loans; others accept only FDSLP. Still others accept both, and a few schools will not accept either, in which case students must seek out private alternatives for student loans.[190]
Grant funding is provided by the federal Pell Grant program.
Issues
Major issues include assessment of proficiency versus growth, funding and legal protection of special education, and excessive student loan debt.
American education crisis
It has been alleged, since the 1950s and especially in recent years, that American schooling is undergoing a crisis in which academic performance is behind other countries, such as Russia, Japan, or China, in core subjects. Congress passed the National Defense Education Act in 1958 in an attempt to rectify these problems, and a series of other legislative acts in later decades such as No Child Left Behind. According to the Organization for Economic Cooperation and Development, however, American students of 2012 ranked 25th in math, 17th in science, and 14th in reading compared with students in 27 other countries.[191] In 2013, Amanda Ripley published the popular book The Smartest Kids in the World (And How They Got That Way), a comparative study of how the American education system differs from top-performing countries such as Finland and South Korea, but she found some students in South Korea spent over 12 hours per day in the classroom, with evening tutors, plus 2 months longer, while Finland demanded teachers attend extra teacher training and pass rigorous checks which 80% of teachers failed.[192] Rather than using some clever learning techniques, instead the teachers and students were forced to spend extra, rigorous time in training or double hours to improve results, which in some cases faded away after a year, although the testing of results was also questionable.[192] The author also noted U.S. teachers generally failed to have extra training and selection which could mean better teaching, but also indicated the U.S. could benefit from a culture which valued some higher intellectual levels.[192]
Recent allegations take the perspective of employers who demand more vocational training. Voters in both major parties have been critical of the Common Core initiative.[193]
Affirmative action
| Acceptance rates at private universities (2005)[194] | |||
|---|---|---|---|
| Overall admit rate | Black admit rate | % difference | |
| Harvard | 10.0% | 16.7% | + 67.0% |
| MIT | 15.9% | 31.6% | + 98.7% |
| Brown | 16.6% | 26.3% | + 58.4% |
| Penn | 21.2% | 30.1% | + 42.0% |
| Georgetown | 22.0% | 30.7% | + 39.5% |
In 2003 a Supreme Court decision concerning affirmative action in universities allowed educational institutions to consider race as a factor in admitting students, but ruled that strict point systems are unconstitutional.[195] Opponents of racial affirmative action argue that the program actually benefits middle- and upper-class non-Asian people of color at the expense of lower class European Americans and Asian Americans.[196]
African American academics Henry Louis Gates and Lani Guinier, while favoring affirmative action, have argued that in practice, it has led to recent black immigrants and their children being greatly overrepresented at elite institutions, at the expense of the historic African American community made up of descendants of slaves.[197] In 2006, Jian Li, a Chinese undergraduate at Yale University, filed a civil rights complaint with the Office for Civil Rights against Princeton University, stating that his race played a role in their decision to reject his application for admission.[198]
Attainment
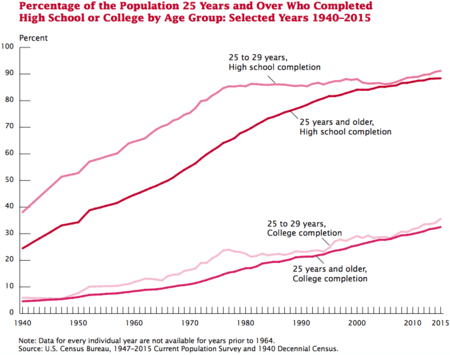
The rise of the high school movement in the beginning of the 20th century was unique in the United States, such that, high schools were implemented with property-tax funded tuition, openness, non-exclusivity, and were decentralized.
The academic curriculum was designed to provide the students with a terminal degree. The students obtained general knowledge (such as mathematics, chemistry, English composition, etc.) applicable to the high geographic and social mobility in the United States. The provision of the high schools accelerated with the rise of the second industrial revolution. The increase in white collar and skilled blue-collar work in manufacturing was reflected in the demand for high school education.
In the 21st century, the educational attainment of the US population is similar to that of many other industrialized countries with the vast majority of the population having completed secondary education and a rising number of college graduates that outnumber high school dropouts. As a whole, the population of the United States is becoming increasingly more educated.[199]
Post-secondary education is valued very highly by American society and is one of the main determinants of class and status. As with income, however, there are significant discrepancies in terms of race, age, household configuration and geography.[200]
Since the 1980s the number of educated Americans has continued to grow, but at a slower rate. Some have attributed this to an increase in the foreign born portion of the workforce. However, the decreasing growth of the educational workforce has instead been primarily due to slowing down in educational attainment of people schooled in the United States.[201]
Remedial education in college
Despite high school graduates formally qualifying for college, only 4% of two-year and four-year colleges do not have any students in noncredit remedial courses. Over 200 colleges place most of their first-year students in one or more remedial courses. Almost 40% of students in remedial courses fail to complete them. The cause cannot be excessively demanding college courses, since grade inflation has made those courses increasingly easy in recent decades. [202][203]
Gender differences
According to research from within the past 20 years, girls generally outperform boys in the classroom on measures of grades across all subjects and graduation rates. This is a turnaround from the early 20th century when boys usually outperformed girls. Boys have still been found to score higher on standardized tests than girls and go on to be better represented in the more prestigious, high-paying STEM fields. There is an ongoing debate over which gender is the most short-changed in the classroom.[204] Parents and educators are concerned about how to motivate males to become better students.
Racial achievement differences
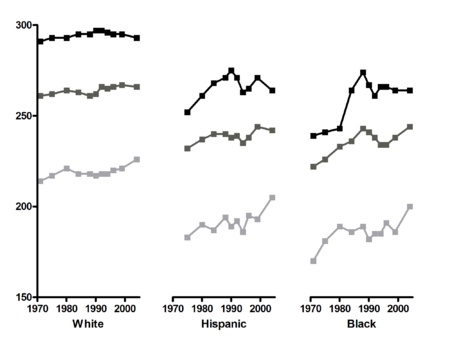
The racial achievement gap in the US refers to the educational disparities between Black and Hispanic students compared with Asian and Caucasian students.[205] This disparity manifests itself in a variety of ways: African-American and Hispanic students are more likely to receive lower grades, score lower on standardized tests, drop out of high school, and are less likely to enter and complete college.[206]
Several reasons have been suggested for these disparities.
One explanation is the disparity in income that exists between African Americans and Whites. This school of thought argues that the origin of this "wealth gap" is the slavery and racism that made it extremely difficult for African-Americans to accumulate wealth for almost 100 years after slavery was abolished. A comparable history of discrimination created a similar gap between Hispanics and Whites. This results in many minority children being born into low socioeconomic backgrounds, which in turn affects educational opportunities.[207]
Another explanation has to do with family structure. Professor Lino Graglia has suggested that Blacks and Hispanics are falling behind in education because they are increasingly raised in single-parent families.[208][209]
Other explanations offered for the racial achievement gap include: social class, institutional racism, lower quality of schools and teachers in minority communities, and civil injustice. Most authors mention several such factors as influential on outcomes, both in the United States[210] and worldwide.[211]
International comparison
In the OECD's Programme for International Student Assessment 2003, which emphasizes problem solving, American 15-year-olds ranked 24th of 38 in mathematics, 19th of 38 in science, 12th of 38 in reading, and 26th of 38 in problem solving.[212] In the 2006 assessment, the U.S. ranked 35th out of 57 in mathematics and 29th out of 57 in science. Reading scores could not be reported due to printing errors in the instructions of the U.S. test booklets. U.S. scores were behind those of most other developed nations.[213]
US fourth and eighth graders tested above average on the Trends in International Mathematics and Science Study tests, which emphasizes traditional learning.[214]
The United States is one of three OECD countries where the government spends more on schools in rich neighborhoods than in poor neighborhoods, with the others being Turkey and Israel.[215]
Poor education also carries on as students age. The Organization for Economic Co-operation and Development's (OECD) administer another survey called the Survey of Adult Skills, which is a part of its Programme for the International Assessment of Adult Competencies (PIAAC). In the most recent survey done in 2013, 33 nations took part with adults ages 16 to 65 in numeracy, literacy and problem-solving. The Educational Testing Service (ETS) found that millennials – age from teens to early 30s – scored low. Millennials in Spain and Italy scored lower than those in the U.S., while in numeracy, the three countries tied for last. U.S. millennials came in last among all 33 nations for problem-solving skills.[216]
Wider economic impact
Current education trends in the United States represent multiple achievement gaps across ethnicities, income levels, and geography. In an economic analysis, consulting firm McKinsey & Company reports that closing the educational achievement gap between the United States and nations such as Finland and Korea would have increased US GDP by 9-to-16% in 2008.[217]
Narrowing the gap between white students and black and Hispanic students would have added another 2–4% GDP, while closing the gap between poor and other students would have yielded a 3-to-5% increase in GDP, and that of under-performing states and the rest of the nation another 3-to-5% GDP. In sum, McKinsey's report suggests, "These educational gaps impose on the United States the economic equivalent of a permanent national recession."[217]
Overall the households and demographics featuring the highest educational attainment in the United States are also among those with the highest household income and wealth. Thus, while the population of the US is becoming increasingly educated on all levels, a direct link between income and educational attainment remains.[200]
ACT Inc. reports that 25% of US graduating high school seniors meet college-readiness benchmarks in English, reading, mathematics, and science.[218] Including the 22% of students who do not graduate on time, fewer than 20% of the American youth, who should graduate high school each year, do so prepared for college.[219] The United States has fallen behind the rest of the developed world in education, creating a global achievement gap that alone costs the nation 9-to-16% of potential GDP each year.[220]
In 2007, Americans stood second only to Canada in the percentage of 35- to 64-year-olds holding at least two-year degrees. Among 25- to 34-year-olds, the country stands tenth. The nation stands 15 out of 29 rated nations for college completion rates, slightly above Mexico and Turkey.[160]
A five-year, $14 million study of U.S. adult literacy involving lengthy interviews of U.S. adults, the most comprehensive study of literacy ever commissioned by the U.S. government,[221] was released in September 1993. It involved lengthy interviews of over 26,700 adults statistically balanced for age, gender, ethnicity, education level, and location (urban, suburban, or rural) in 12 states across the U.S. and was designed to represent the U.S. population as a whole. This government study showed that 21% to 23% of adult Americans were not "able to locate information in text", could not "make low-level inferences using printed materials", and were unable to "integrate easily identifiable pieces of information."[221]
The U.S. Department of Education's 2003 statistics indicated that 14% of the population – or 32 million adults – had very low literacy skills.[222] Statistics were similar in 2013.[223]
In addition to its economic impact, social science provides evidence that the level of educational attainment of a community also has quantifiable impacts on many aspects of well-being, including life expectancy, low birthweight rates, crime, and political engagement.[224]
Behavior
A 2011 study found that students who were expelled were three times as likely to become involved with the juvenile justice system the following school year.[225]
Corporal punishment
The United States is one of the very few developed countries where corporal punishment is officially permitted and practiced in its public schools, although the practice has been banned in an increasing number of states beginning in the 1970s. The punishment virtually always consists of spanking the buttocks of a student with a paddle in a punishment known as "paddling."[226] Students can be physically punished from kindergarten to the end of high school, meaning that even adults who have reached the age of majority are sometimes spanked by school officials.[226] Although uncommon relative to the overall U.S. student population, more than 167,000 students were paddled in the 2011–2012 school year in American public schools.[227] Virtually all paddling in public schools occurs in the Southern United States, however, with 70% of paddled students living in just five states: Mississippi, Texas, Alabama, Arkansas, and Georgia.[227] The practice has been on a steady decline in American schools.[228]
School safety and security
The National Center for Education Statistics reported statistics about public schools in the United States in 2013–2014. They stated that, during that time, 93% controlled access to their buildings during school hours, and that 88% have in place a written crisis response plan. They also reported that 82% of schools have a system that notifies parents in the event of an emergency. According to their report, 75% of schools have security cameras in use.[229]
During the 2015–16 school year in the United States, the National Center for Education Statistics reported the following: Nine percent of schools reported that one or more students had threatened a physical attack with a weapon. Ninety five percent of schools had given their students lockdown procedure drills, and ninety two percent had drilled them on evacuation procedures.[230] Around 20 percent of schools had one or more security guards or security personnel while 10.9 percent had one or more full or part-time law enforcement officers. Forty-two percent of schools had at least one school resource officer.[230]
In some schools, a police officer, titled a school resource officer, is on site to screen students for firearms and to help avoid disruptions.[231][232]
The schools in United States are fast adopting facial recognition technology for the protection of children.[233] The technology is aimed at detecting people falling on the threat list for sex offense, suspension from school, and so on. However, human rights advocacy group, Human Rights Watch, argues that the technology could also threaten the right to privacy and could pose great risk to children of color.[234]
Cheating
In 2006, one survey found that 50% to 95% of American students admitted to having cheated in high school or college at one time or another, results that cast some doubt on measured academic attainment tests.[235]
Curriculum
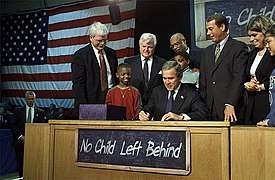
Curricula in the United States can vary widely from district to district. Different schools offer classes centering on different topics, and vary in quality. Some private schools even include religious classes as mandatory for attendance. This raises the question of government funding vouchers in states with anti-Catholic Blaine Amendments in their constitution. This in turn has produced camps of argument over the standardization of curricula and to what degree it should exist. These same groups often are advocates of standardized testing, which is mandated by the No Child Left Behind Act.
There is debate over which subjects should receive the most focus, with astronomy and geography among those cited as not being taught enough in schools.[236][237][238]
English in the classroom
Schools in the 50 states, the District of Columbia, the U.S. Virgin Islands, Guam, and the Northern Mariana Islands, teach primarily in English, with the exception of specialized language immersion programs.
Other languages
In 2015, 584,000 students in Puerto Rico were taught in Spanish, their native language.[239]
The Native American Cherokee Nation instigated a 10-year language preservation plan that involved growing new fluent speakers of the Cherokee language from childhood on up through school immersion programs as well as a collaborative community effort to continue to use the language at home.[240][241][242] [243] In 2010, 84 children were being educated in this manner.[244]
Some 9.7 million children aged 5 to 17 primarily speak a language other than English at home. Of those, about 1.3 million children do not speak English well or at all.[245]
Evolution in Kansas
In 1999 the School Board of the state of Kansas caused controversy when it decided to eliminate teaching of evolution in its state assessment tests.[246] Scientists from around the country objected.[247] Many religious and family values groups, on the other hand, stated that evolution is "simply a theory" in the colloquial sense (not the academic sense, which means specific and well supported reasoning),[248] and as such creationist ideas should therefore be taught alongside it as an alternative viewpoint.[249] A majority of the board supported teaching intelligent design or creationism in public schools.[250] The new standards, including Intelligent Design, were enacted on November 8, 2005. On February 13, 2007, the board rejected these amended science standards enacted in 2005, overturning the mandate to teach Intelligent Design.[251]
Sex education
Almost all students in the U.S. receive some form of sex education at least once between grades 7 and 12; many schools begin addressing some topics as early as grades 4 or 5.[252] However, what students learn varies widely, because curriculum decisions are so decentralized. Many states have laws governing what is taught in sex education classes or allowing parents to opt out. Some state laws leave curriculum decisions to individual school districts.[253]
For example, a 1999 study by the Guttmacher Institute found that most U.S. sex education courses in grades 7 through 12 cover puberty, HIV, STDs, abstinence, implications of teenage pregnancy, and how to resist peer pressure. Other studied topics, such as methods of birth control and infection prevention, sexual orientation, sexual abuse, and factual and ethical information about abortion, varied more widely.[254]
However, according to a 2004 survey, a majority of the 1001 parent groups polled wants complete sex education in the schools. The American people are heavily divided over the issue. Over 80% of polled parents agreed with the statement "Sex education in school makes it easier for me to talk to my child about sexual issues," while under 17% agreed with the statement that their children were being exposed to "subjects I don't think my child should be discussing." 10 percent believed that their children's sexual education class forced them to discuss sexual issues "too early." On the other hand, 49 percent of the respondents (the largest group) were "somewhat confident" that the values taught in their children's sex ed classes were similar to those taught at home, and 23 percent were less confident still. (The margin of error was plus or minus 4.7 percent.)[255]
According to The 74, an American education news website, the United States uses two methods to teach sex education. Comprehensive sex education focuses on sexual risk reduction. This method focuses on the benefits of contraception and safe sex. The abstinence-emphasized curriculum focuses on sexual risk avoidance, discouraging activity that could become a "gateway" to sexual activities.[256]
Textbook review and adoption
In some states, textbooks are selected for all students at the state level, and decisions made by larger states, such as California and Texas, that represent a considerable market for textbook publishers and can exert influence over the content of textbooks generally, thereby influencing the curriculum taught in public schools,[257]
In 2010, the Texas Board of Education passed more than 100 amendments to the curriculum standards, affecting history, sociology and economics courses to 'add balance' given that academia was 'skewed too far to the left'.[258] One specific result of these amendments is to increase education on Moses' influences on the founding of the United States, going as far as calling him a "founding father".[259] Critical review of the twelve most widely used American high school history textbooks found that they often disseminate factually incorrect, Eurocentric, and mythologized views of American history.[260]
As of January 2009, the four largest college textbook publishers in the United States were: Pearson Education (including such imprints as Addison-Wesley and Prentice Hall), Cengage Learning (formerly Thomson Learning), McGraw-Hill Education, Houghton Mifflin Harcourt. Other US textbook publishers include: Abeka, BJU Press, John Wiley & Sons, Jones and Bartlett Publishers, F. A. Davis Company, W. W. Norton & Company, SAGE Publications, and Flat World Knowledge.
Culturally-responsive curriculum
Culturally-responsive curriculum is a framework for teaching that acknowledges and the various cultural backgrounds of all students in the classroom to make learning more accessible, especially for students of color.[261] It is the outgrowth of research evidence that suggests that attitudes towards others, especially with regard to race, are socially constructed (or learned) at a young age.[262] Therefore, the values that we attach to various groups of people are a reflection of the behavior we have observed around us, especially in the classroom.[262] Culturally-responsive curriculum responds to the importance of teachers connecting with students in increasingly diverse classrooms in the US by incorporating sociocultural elements into curriculum. The goal of culturally-responsive curriculum is to ensure equitable access to education for students from all cultures.[263]
Culturally-responsive curriculum draws directly on the idea of a "hidden curriculum" or system of values that teachers impart on students in the classroom. Culturally-responsive curriculum attempts to break down the dominant cultural bias that often pervades curriculum and instruction. Similar to the anti-bias approach, culturally-responsive curriculum is intended to help students and teachers "recognize the connections between ethnicity, gender, religion, and social class, and power, privilege, prestige, and opportunity." Culturally-responsive curriculum specifically responds to the cultural needs of students as learners in the classroom.
A study by Howard in 2001, documents students' responses to culturally-responsive curriculum and teaching strategies. The study found that these methods had a positive effect on student engagement and effort in the classroom. These findings are consistent with the theoretical claims of culturally-responsive curriculum.[264]
Teachers can gain in-depth understandings of their students' individual needs by engaging with parents, learning about culturally-specific ways of communicating and learning, and allowing students to direct their learning and to collaborate on assignments that are both culturally and socially relevant to them.[263]
Culturally-responsive curriculum is also implemented at the level of preservice teacher education. One study by Evans-Winters and Hoff found that preservice teachers do not necessarily recognize or acknowledge the intersections of race and other social factors in understanding and characterizing systems of oppression.[265] A shift in preservice training has been made toward a more self-reflective model that encourages teachers to be reflective of the types of cultural and social attitudes they are promoting in their teaching practices.[266] This kind of preservice education can help teachers anticipate social-identity related tensions that might occur in the classroom and think critically about how to approach them.[267]
Gender-sensitive curriculum
The notion of gender-sensitive curriculum acknowledges the current reality of our bi-gender world and attempts to break down socialized learning outcomes that reinforce the notion that girls and boys are good at different things.[204] Research has shown that while girls do struggle more in the areas of math and science and boys in the area of language arts, this is partly a socialization phenomenon.[204] One key to creating a gender-friendly classroom is "differentiation" which essentially means when teachers plan and deliver their instruction with an awareness of gender and other student differences.[204] Teachers can strategically group students for learning activities by a variety of characteristics so as to maximize individual strengths and contributions.[204] Research has also shown that teacher's differ in how they treat girls and boys in the classroom.[268] Gender-sensitive practices necessitate equitable and appropriate attention to all learners. Teacher attention to content is also extremely important. For example, when trying to hold boy's attention teachers will often use examples that reference classically male roles, perpetuating a gender bias in content.[204]
In addition to curriculum that recognizes that gender impacts all students and their learning, other gender-sensitive curriculum directly engages gender-diversity issues and topics. Some curricular approaches include integrating gender through story problems, writing prompts, readings, art assignments, research projects and guest lectures that foster spaces for students to articulate their own understandings and beliefs about gender.[269]
LGBTQ-inclusive curriculum
LGBTQ-inclusive curriculum is curriculum that includes positive representations of LGBTQ people, history, and events.[270] LGBTQ curriculum also attempts to integrate these narratives without biasing the LGBTQ experience as a separate and fragmented from overarching social narratives and not as intersecting with ethnic, racial, and other forms of diversity that exist among LGBTQ individuals.[270]
The purpose of LGBTQ-inclusive curriculum is to ensure that LGBTQ students feel properly represented in curriculum narratives and therefore safer coming to school and more comfortable discussing LGBTQ-related topics. A study by GLSEN examined the impact of LGBTQ-inclusive practices on LGBTQ students' perceptions of safety. They study found that LGBT students in inclusive school-settings were much less likely to feel unsafe because of their identities and more likely to perceive their peers as accepting and supportive.
Implementation of LGBTQ-inclusive curriculum involves both curriculum decisions and harnessing teachable moments in the classroom. One study by Snapp et al. showed that teachers often failed to intervene in LGBTQ-bullying.[271]
Other research has suggested that education for healthcare professionals on how to better support LGBTQ patients has benefits for LGBTQ-healthcare service.[272] Education in how to be empathic and conscientious of the needs of LGBTQ patients fits within the larger conversation about culturally-responsive healthcare.
Ability-inclusive curriculum
Ability-inclusive curriculum is another curriculum model that adapts to the social, physical, and cultural needs of the students. Inclusion in the US education system refers to the approach to educating students with special needs in a mainstream classroom. This model involves cultivating a strong relationship between teacher and student, and between non-special needs students and special needs students. Like the other models of culturally-inclusive curriculum, ability-inclusive curriculum often involves collaboration, parental-involvement, the creation of a safe and welcoming environment, returning agency to the students over their learning, and fostering open discussion about individual differences and strengths.[273]
Research generally demonstrates neutral or positive effects of inclusive education. A study by Kreimeyer et al. showed that a group of deaf/hard-of-hearing students in an inclusive classroom scored better than the national averages on reading comprehension, vocabulary, and mathematical problem solving measures.[274] Another study showed that inclusive practices increased literacy rates for autistic students.[275] Many theorists champion the potential socio-emotional benefits of inclusion. However research on the social dynamics of inclusive classrooms suggest that special needs students might occupy a lower social standing that non-special needs students.[276]
Immigrant students and grade placement
The method of placing students in a specific grade based on birthday cut off dates has often been used with immigrant children. A study conducted by Dylan Conger on effects of grade placement on English learners found that schools are often rushed to make a decision on what grade an incoming student should be placed, so they base their decision on the child's birthday.[99] Unfortunately, teachers and staff are not always able to test the child's knowledge to determine what grade level would be better for the students based on what they already know.[99] This can cause some difficulties for immigrant students. A study conducted on teacher expectation of Somali Bantu refugee students found that teachers can hold expectations for students to already know certain material when they enter their classroom, such as how to use a computer or how to behave in a classroom.[277] When these students learned something that the teacher already expected them to know, it was not given the same importance compared to learning something that was being taught in that grade level, such as math proficiency or computer use.[277] Things can become more difficult for students when entering in the middle of the academic year. A study focused on the impact of late arrivals for immigrant students found that, due to constant moving, students entering in the middle of the academic year encountered material they were not familiar with or ended up repeating material they had already learned.[278]
There is still limited research that has been conducted in the United States on the effects of placing immigrant students in a specific grade based on birthday cut off dates. In a study about Thailand's education policy on children of migrants, Thai schools often required migrant students to be proficient in the Thai language and to have gone through a learning center before enrolling into a public school.[279] If a student was younger than 7, they would be placed in kindergarten, and if they were older, they would be placed in a first grade class.[279] Therefore, students that were 15 could still enroll as a first grader. The purpose for these methods was to ensure that migrant students were better prepared to start school, but it did cause some issues for both the student and the teachers. The study found that even though older students placed in first grade classrooms were more obedient, the students had trouble connecting with their classmates and teacher had to address them differently due to their age.[279] Thai public schools attempted to address this issue by some implementing a rule that a student could not be older than 9 to enroll, but this led to learning centers not given recommendations to public school for older students.[279] More research is needed in order to better understand the effects of grade placement in immigrant students.
While data supports the theory that English-language (EL) literacy interventions are beneficial for students of all grade levels and socioeconomic status, including disadvantaged immigrant students, poor implementation of EL instruction has contributed to downward assimilation and long-term or permanent Limited English Proficiency (LEP) status for many immigrant youths.[280] LEP status serves as a nonacademic factor for student course enrollment, negatively affecting immigrant student learning opportunities by separating English-learning from other coursework.[281] Focus on English literacy, and organizational constraints such as immigrant student population, may take away needed resources from challenging academic courses, such as math and science courses that are less English-dependent, thereby impeding LEP students’ educational opportunities and post-secondary education preparation.
School to prison pipeline
The school-to-prison pipeline (SPP) is the disproportionate tendency of minors and young adults from disadvantaged backgrounds to become incarcerated, because of increasingly harsh school and municipal policies. This inhibits many of these young adults from going to college.[282][283]
Reading and writing habits
Libraries have been considered important to educational goals.[284] Library books are more readily available to Americans than to people in Germany, the United Kingdom, France, the Netherlands, Austria and all the Mediterranean nations. The average American borrowed more library books in 2001 than his or her peers in Germany, Austria, Norway, Ireland, Luxembourg, France and throughout the Mediterranean.[285] Americans buy more books than do Europeans.[285]
Teachers have been frustrated with lack of parent involvement in the learning process, particularly in the earlier grades. Children spend about 26% of their time in school, sleep 40%, leaving about 34% of their time left-over.[286] Teachers believe that parents are not supervising their children's free time to encourage the learning process, such as basic literacy, which is crucial not only to later success in life, but also to keeping them out of prison.[287]
See also
- Academic grading in the United States
- College Board examinations
- Language education in the United States
- List of heads of state educated in the United States
- List of state graduation exams in the United States
- Lists of school districts in the United States
- National Center for Education Statistics
- Outcome-based education
- Social programs in the United States and education
- First-generation college students in the United States
References
- "Digest of Education Statistics 2017, 53rd ed" (PDF). Retrieved April 14, 2019.
- "The World Factbook". Cia.gov. Retrieved September 21, 2013.
- "United States" (PDF). OECD. p. 2. Retrieved August 27, 2019.
- "International Educational Attainment" (PDF). p. 4. Retrieved August 27, 2019.
- "Educational Attainment of the Population 25 Years and Over, by Selected Characteristics: 2018". United States Census Bureau. February 21, 2019. Retrieved August 27, 2019.
- "United States". OECD. Retrieved August 27, 2019.
- "Educational attainment and labour-force status". OECD.
- "CAPE – Private School Facts".
- "U.S. Department of Education: Homeschooling Continues to Grow!".
- "State Compulsory School Attendance Laws". infoplease.com. Retrieved December 19, 2007.
- "U.S. college enrollment rates". NCES. March 18, 2019.
- "Top World University Rankings – US Best Global Universities". U.S. News & World Report. Archived from the original on October 22, 2016.
- "U.S. education spending tops global list, study shows". CBS News. June 25, 2013.
- "PISA - Results in Focus" (PDF). OECD. p. 5.
- "United States - Student performance (PISA 2015)". OECD.
- "Education Expenditures by Country" (PDF). National Center for Education Statistics. May 11, 2018. p. 7.
- "Indicators of Higher Education Equity in the United States" (PDF). Pell Institute. p. 127.
- "International Educational Attainment" (PDF). p. 6. Retrieved August 27, 2019.
- "United States" (PDF). OECD. p. 1. Retrieved August 27, 2019.
- "Educational Attainment of the Population 25 Years and Over, by Selected Characteristics: 2018". United States Census Bureau. February 21, 2019. p. 1. Retrieved August 27, 2019.
- "Inequality – Poverty gap – OECD Data".
- "Inequality – Poverty rate – OECD Data".
- Samuel Read Hall Biography at the Old Stone House Museum website Archived April 5, 2010, at the Wayback Machine, Retrieved on July 3, 2009
- "An early Yankee Educator". Melrosemirror.media.mit.edu. April 1, 2005. Archived from the original on September 20, 2006. Retrieved January 16, 2014.
- Paul Monroe, "A cyclopedia of education" (4 vol. 1911) covers each state
- Bandiera, Oriana; Mohnen, Myra; Rasul, Imran; Viarengo, Martina (June 9, 2018). "Nation-Building Through Compulsory Schooling During the Age of Mass Migration" (PDF). The Economic Journal. 129 (617): 62–109. doi:10.1111/ecoj.12624. ISSN 0013-0133.
- Walter R., Allen, Edgar G. Epps, and Nesha Z. Haniff, College in Black and White: African American students in predominantly White and in historically Black public universities (SUNY Press, 1991).
- Spooner, F. (2014). Serving students with healthcare needs. In M. Agran (Ed.), Equity and full participation for individuals with severe disabilities: A vision for the future (p. 239). Baltimore, MD: Paul H. Brookes Pub.
- "Education: 6-4-4 Preferred". Time. August 22, 1938. Archived from the original on August 26, 2010. Retrieved July 5, 2019.
- Campbell, pp 78–9, 226–7
- Grace Palladino, Teenagers: An American History (1996) p 66
- Steven Mintz, Huck's Raft: A History of American Childhood (2006) pp 258–9
- Nordin, Virginia Davis; Turner, William Lloyd (1980). "More than Segregation Academies: The Growing Protestant Fundamentalist Schools". The Phi Delta Kappan. 61 (6): 391–394.
- Carper, James C. (1983). "The Christian Day School Movement". The Educational Forum. 47 (2): 135–149. doi:10.1080/00131728309335955.
- Carper, James C.; Layman, Jack (1995). "Independent Christian Day Schools Past, Present, and Prognosis". Journal of Research on Christian Education. 4 (1): 7–19. doi:10.1080/10656219509484824.
- Oakley D, Stowell J, Logan JR (2009). "The impact of desegregation on black teachers in the metropolis, 1970–2000". Ethnic and Racial Studies. 39 (9): 1576–1598. doi:10.1080/01419870902780997. PMC 3769798. PMID 24039318.
- "The Elementary and Secondary Education Act of 1965 forbids federally determined curricula." Hoover Institution – Daily Report Archives – Secretary Riley Reignites the Math Wars
- "U.S. spending". Rolling Stone. April 19, 1990. p. 43.
- Jesse Rhodes (2012). An Education in Politics: The Origins and Evolution of No Child Left Behind. Cornell U.P. pp. 179–81. ISBN 978-0801464669.
- Steven Brill (2011). Class Warfare: Inside the Fight to Fix America's Schools. Simon and Schuster. p. 84. ISBN 9781451611991.
- "Archived: Fact Sheet on No Child Left Behind". May 3, 2006.
- "Zeman vs Simmon-Harris, US Supreme Court certoriari 00-1751". findlaw.com. June 27, 2002. Archived from the original on October 2, 2002.
- Hirschfeld Davis, Julie (December 10, 2015). "President Obama Signs into Law a Rewrite of No Child Left Behind". The New York Times. Retrieved December 18, 2015.
- Jonathan Zimmerman, "Education in the Age of Obama: The Paradox of Consensus" in Zelizer, ed., The Presidency of Barack Obama pp 110–28.
- McGuinn, Patrick (2012). "Stimulating reform: Race to the Top, competitive grants and the Obama education agenda". Educational Policy. 26 (1): 136–159. doi:10.1177/0895904811425911.
- "Opinion | the Student Debt Problem is Worse Than We Imagined". The New York Times. August 25, 2018.
- "Student debt is America's most pressing economic problem". December 11, 2016.
- Griffin, Riley (October 17, 2018). "The Student Loan Debt Crisis Is About to Get Worse". Bloomberg.
- "Betsy DeVos: Student Loan Debt is Now A 'Crisis'".
- "Will a Student Loan Debt Crisis Sink the U.S. Economy?".
- Nagel, By David; 03/16/20. "More Than Half of All States Have Shut Down All of Their Schools -". THE Journal. Retrieved June 10, 2020.CS1 maint: numeric names: authors list (link)
- Herold, Benjamin (April 1, 2020). "The Scramble to Move America's Schools Online - Education Week". Education Week. Retrieved June 19, 2020.
- "Technology in Classrooms: Pros and Cons – Future Educators". Retrieved June 18, 2020.
- "Big Data Analytics Market, Forecast 2023, Size, Share and Trends". store.frost.com. Retrieved June 19, 2020.
- Frankenfield, Jake. "How Data Analytics Work". Investopedia. Retrieved June 19, 2020.
- "Technology in Classrooms: Pros and Cons – Future Educators". Retrieved June 19, 2020.
- "Technology in Classrooms: Pros and Cons – Future Educators". Retrieved June 19, 2020.
- "Technology in Classrooms: Pros and Cons – Future Educators". Retrieved June 19, 2020.
- "Technology in Classrooms: Pros and Cons – Future Educators". Retrieved June 19, 2020.
- "Technology in Classrooms: Pros and Cons – Future Educators". Retrieved June 19, 2020.
- "Technology in Classrooms: Pros and Cons – Future Educators". Retrieved June 19, 2020.
- "Technology in Classrooms: Pros and Cons – Future Educators". Retrieved June 19, 2020.
- "Technology in Classrooms: Pros and Cons – Future Educators". Retrieved June 19, 2020.
- "The COVID-19 pandemic has changed education forever. This is how". World Economic Forum. Retrieved June 19, 2020.
- "The COVID-19 pandemic has changed education forever. This is how". World Economic Forum. Retrieved June 19, 2020.
- "The COVID-19 pandemic has changed education forever. This is how". World Economic Forum. Retrieved June 19, 2020.
- "The COVID-19 pandemic has changed education forever. This is how". World Economic Forum. Retrieved June 19, 2020.
- "The COVID-19 pandemic has changed education forever. This is how". World Economic Forum. Retrieved June 19, 2020.
- "US Census Press Releases". Archived from the original on March 30, 2005.
- Zagier, Alan Scher (June 6, 2010). "Rethinking the four-year degree". Washington Post. Washington Post. pp. A2.
- A First Look at the Literacy of America's Adults in the 21st Century, U.S. Department of Education, 2003. Accessed May 13, 2006. Two percent of the population do not have minimal literacy and 14% have Below Basic prose literacy.
- Program for International Student Assessment (PISA), OECD, reading literacy, science literacy and mathematics literacy all rank near the bottom of OECD-countries,
- Pondiscio, Robert (January 13, 2016). "The Phoniest Statistic in Education". Thomas B. Fordham Institute. Retrieved July 17, 2016.
- Archived May 27, 2013, at the Wayback Machine
- Education at Glance 2005 Archived July 23, 2013, at the Wayback Machine by OECD: Participation in continuing education and training
- "Scientific Literacy: How Do Americans Stack Up?." Science Daily.
- Layton, Lyndsey; Brown, Emma (September 14, 2015). "Number of homeless students in U.S. has doubled since before the recession" – via www.washingtonpost.com.
- "The United States of Homelessness". Institute for Children, Poverty & Homelessness.
- "Who's No. 1? Finland, Japan and Korea, Says OECD". Siteselection.com. December 10, 2001. Retrieved April 14, 2010.
- Structure of U.S. Education, U.S. Network for Education Information: U.S. Department of Education. Retrieved August 13, 2013.
- "Four-, Five-, and Six-Year Graduation Rates". Archived from the original on November 6, 2014.
- National Center for Education Statistics. "Nontraditional Undergraduates", Institute of Education Sciences, U.S. Department of Education. (p. 2) Accessed June 17, 2013.
- "Age range for comp/ref> while ranking below average in science and mathematics understanding compared to other developed countries.ulsory school attendance and special education services, and policies on year-round schools and kindergarten programs". Nces.ed.gov. Retrieved September 21, 2013.
- "Education. United States Census (2000)". Factfinder.census.gov. Archived from the original on April 3, 2009. Retrieved September 21, 2013.
- "News". US Census. April 11, 2011.
- Kathleen Kingsbury (August 14, 2008). "Four-Day School Weeks". Time magazine.
- "K–12 Facts". Center for Education Reform. February 26, 2011. Archived from the original on September 11, 2011.
- Amurao, Carla (February 21, 2013). "Fact Sheet: Is the Dropout Problem Real?". Tavis Smiley Reports: Episode 6: Education Under Arrest. PBS. Retrieved July 29, 2014.
- Gerson, Michael (January 5, 2010). "Column:More second chances". Florida Today. Melbourne, Florida. pp. 7A.
- "Return on Educational Investment" (PDF). Center for American Progress. Archived from the original (PDF) on June 25, 2012. Retrieved January 16, 2014.
- Reed, Matt (December 12, 2010). "Tackling 'achievement gap' hurts US schools". Florida Today. Melbourne, Florida. pp. 1B.
- Streufert, Duane (February 10, 2005). "The original Pledge of Allegiance". usflag.org. Retrieved February 24, 2015.
- "google.com". CiteSeerX 10.1.1.144.6659. Cite journal requires
|journal=(help) - Reed, Matt (April 24, 2012). "Dumb, overpaid teachers gouging U.S. taxpayers?". Florida Today. Melbourne, Florida. pp. 7A.
- "6 Most Popular Milspouse Jobs". USAA Magazine. San Antonio, Texas. Fall 2012. p. 7.
- "Home Page". Archived from the original on April 15, 2012.
- "Supreme Court and School Busing". United Press International. January 7, 1999. Retrieved September 21, 2013.
- "gcsnc.com" (PDF). Archived from the original (PDF) on March 1, 2011.
- Conger, Dylan (December 2013). "The Effect of Grade Placement on English Language Learners' Academic Achievement". Educational Evaluation and Policy Analysis. 35 (4): 395–412. doi:10.3102/0162373713493315. ISSN 0162-3737.
- "Digest of Education Statistics, 2001" (PDF). Retrieved April 14, 2010.
- "Illinois State Board of Education – Illinois Learning Standards". Isbe.state.il.us. Archived from the original on April 14, 2010. Retrieved April 14, 2010.
- "St. Charles Community Unit School District 303". district.d303.org. Archived from the original on September 28, 2007.
- aids!, A. non-profit committed to publishing authentic Waldorf enrollment materials, books, and teaching. "The End of Year Report in Waldorf Schools". www.waldorfpublications.org.
- European Council for Steiner Waldorf Education, Assessment for Learning: ECSWE Review of Current Practice, 2012–13
- Dominos, Susan. ", The New York Times, October 4, 2010.
- "Pass/fail grades may help students during the COVID-19 crisis, but could cost them later". PBS NewsHour. April 7, 2020. Retrieved June 19, 2020.
- "Pass/fail grades may help students during the COVID-19 crisis, but could cost them later". PBS NewsHour. April 7, 2020. Retrieved June 19, 2020.
- "Executive Summary of the No Child Left Behind Act of 2001". U.S. Department of Education. Retrieved September 21, 2013.
- Korte, Gregory (December 11, 2015). "The Every Student Succeeds Act vs. No Child Left Behind: What's changed?". USA Today. Retrieved December 18, 2015.
- Walker, Tim (December 9, 2015). "With Passage of Every Student Succeeds Act, Life After NCLB Begins". NEA Today. Retrieved December 19, 2015.
- Reynolds & Van Tuyle, 2012
- Rural Education, 2011
- "Opponents of standardized education". Undeferredliving.com. September 20, 2012. Archived from the original on May 29, 2013. Retrieved September 21, 2013.
- "Wasted Brilliance: Slavery of the Industrial Mind and the Path to Freedom and Success". Undeferredliving. September 9, 2013. Archived from the original on September 26, 2013. Retrieved September 21, 2013.
- "Four Years to Nowhere: College Degrees, Zombies, and the Future of Education". Undeferredliving. Archived from the original on September 26, 2013. Retrieved September 21, 2013.
- "America's Problem: How the World is "Beating Us" in a Battle We Don't Necessarily Want to Win". Undeferredliving. September 20, 2012. Archived from the original on May 29, 2013. Retrieved September 21, 2013.
- Mumm, Graham. Four Years to Nowhere: College Degrees, Zombies, and the Future of Education. Undeferred Living. http://undeferredliving.com/four-years-to-nowhere-investing-in-a-college-degree/ Archived September 26, 2013, at the Wayback Machine
- Mumm, Graham. Wasted Brilliance: Slavery of the Industrial Mind and the Path to Freedom and Success. Undeferred Living. http://undeferredliving.com/memorizing-vs-knowing-knowing-facts-is-knowing-nothing-theoretical-vs-applicable-knowledge/ Archived September 26, 2013, at the Wayback Machine
- Marcus, Jon (August 16, 2017). "The newest advantage of being rich in America? Higher grades". Hechinger Report. Teachers College at Columbia University. Retrieved August 22, 2017.
If you’re an independent school or a suburban school and you’re giving Bs and the school in the next community is giving A-minuses, you start to feel like those kids are going to get a leg up. So you start giving out A-minuses.
- Kamenetz, Anya (2015). The Test : Why Our Schools Are Obsessed with Standardized Testing-but You Don't Have to Be. New York: PublicAffairs. p. 139. ISBN 9781610394420.
- "Admission Application Considerations for the Class of 2025". Harvard College. Retrieved June 19, 2020.
- Shanklin, Natalie. "Students prioritize extracurriculars over academics | The Ithacan". theithacan.org. Retrieved July 12, 2018.
- "Extracurricular Activities". kidshealth.org. Retrieved June 29, 2018.
- "The True Value in Participating in Extracurricular Activities – PreciouStatus". PreciouStatus. April 26, 2017. Retrieved May 5, 2018.
- Barge, Mary Ann. "Complete List of Extracurricular Activities: 100s of Examples". Retrieved May 5, 2018.
- "Partnership for Academic Competition Excellence". PACE. Retrieved June 29, 2018.
- "Key Club: Service Program for High School Students". Key Club. Retrieved June 29, 2018.
- "Seizures".
- "School Nurses". Merritt Island, Florida: Space Coast Medicine and Healthy Living. March–April 2009. pp. 21–33.
- "Paper Chase: US government: disabled students must be allowed to compete in extracurricular sports". JURIST. January 26, 2013. Retrieved September 21, 2013.
- "IDEA 2004 Resources". U.S. Department of Education. Retrieved September 21, 2013.
- Gewertz, Catherine (January 24, 2019). "U.S. High School Grad Rate Reaches Another All-Time High. But What Does It Mean?". Education Week. Retrieved January 28, 2019.
- Teaching exceptional, diverse, and at-risk students in the general education S Vaughn, CS Bos, JS Schumm – 1999
- Gillies, R.M. (2004). "The effects of cooperative learning on junior high school students during small group learning" (PDF). Learning and Instruction. 14 (2): 197–213. doi:10.1016/S0959-4752(03)00068-9.
- "Federal Role in Education". United States Department of Education. February 13, 2012. Retrieved September 21, 2013.
- Walters, Pamela (February 19, 1016). "Educational access and the state: Historical continuities and discontinuities in racial inequality in american education". Sociology of Education.
- Klauke, Amy. Magnet schools. ERIC Clearinghouse on Educational Management. Retrieved February 21, 005.
- Private School in Portland Oregon. "Private Schools in Portland Oregon".
- Michael Birnbaum (November 2, 2009). "A look at private schools". Washington Post. Washington Post. pp. B2.
- "Archived copy". Archived from the original on October 12, 2007. Retrieved September 12, 2007.CS1 maint: archived copy as title (link)
- Herbst, Juergen. School Choice and School Governance: A Historical Study of the United States and Germany page 107 2006. ISBN 1-4039-7302-4
- Lloyd, Janice, Gannett News Service (January 5, 2008). Home-schooling numbers rise. Burlington Free Press.CS1 maint: multiple names: authors list (link)
- "Research Facts on Homeschooling – National Home Education Research Institute". National Home Education Research Institute. Retrieved May 5, 2018.
- "Homeschooling 101: What Is Homeschooling?". Parents. January 11, 2012. Retrieved May 5, 2018.
- Home Schools Run By Well-Meaning Amateurs. National Education Association. Archived June 5, 2009, at the Wayback Machine
- "Home School Legal Defense Association". Hslda.org. Retrieved September 21, 2013.
- Nat'l Ctr. for Educ. Statistics, Degree-Granting Institutions and Branches, by Type and Control of Institution and State of Jurisdiction, 2009–10 Archived March 2, 2012, at the Wayback Machine (September 2010). Retrieved December 1, 2011
- Michelle Singletary (October 22, 2009). "The Color of Money:Getting through college these days almost requires a degree in thrift". Washington Post. pp. 20A.
- Melissa Korn (February 3, 2015). Big Gap in College Graduation Rates for Rich and Poor, Study Finds The Wall Street Journal. Retrieved February 5, 2015.
- "Number of educational institutions, by level and control of Institution". U.S. Department of Education, National Center for Education Statistics. 2019. p. 1. Retrieved August 27, 2019.
- "The Top American Research Universities". The Center (University of Florida). Archived from the original on October 31, 2006. Retrieved November 7, 2006.
- "QS World University Rankings - 2020". QS Quacquarelli Symonds Limited. Retrieved August 26, 2019.
- Anthony, Amanda. "A Review of the U.S. Higher Education System: Its Structure, Funding, Quality and the Future". United States Census Bureau: 3. S2CID 54171217. Cite journal requires
|journal=(help) - "Graduate School Program Options: MBA". Scheller College of Business. Retrieved June 25, 2015.
- "Organization of U.S. Education - Tertiary Institutions". p. 2. Retrieved August 27, 2019.
- "US education expenditure as share of GDP". Our World in Data. Retrieved March 6, 2020.
- "Trends in College Spending 1998–2008" (PDF). Archived from the original (PDF) on August 8, 2013. Retrieved September 21, 2013.
- "Tuition Levels Rise but Many Students Pay Significantly Less than Published Rates". Collegeboard.com. Archived from the original on June 3, 2006. Retrieved September 21, 2013.
- "College Pricing and Student Aid – Pressroom". Press.collegeboard.org. April 9, 2013. Retrieved September 21, 2013.
- Broder, David S. (columnist) (December 7, 2008). College affordability about future. Burlington Free Press (and other column subscribers).
- "The U.S. Census Bureau (2010)". Archived from the original on March 16, 2011. Retrieved April 24, 2011.
- Crowe, Aaron. "Ten things that aren't free – but should be (and how to get them for free anyway) – DailyFinance". Walletpop.com. Retrieved September 21, 2013.
- "College ROI 2013 Methodology". Payscale.com. Retrieved September 21, 2013.
- Friedman, Zack. "Student Loan Debt Statistics in 2018: A$1.5 Trillion Crisis". Forbes.
- "Bernie Sanders plans to cancel all $1.6tn of US student debt". BBC News. Retrieved June 24, 2019.
- Fern, Deirdre; Staff, es Globe; May 8, Updated; 2020; Comments, 8:18 p m Email to a Friend Share on Facebook Share on TwitterPrint this Article View. "Amid coronavirus pandemic, a growing list of colleges in financial peril - The Boston Globe". BostonGlobe.com. Retrieved June 19, 2020.CS1 maint: numeric names: authors list (link)
- Fern, Deirdre; Staff, es Globe; May 8, Updated; 2020; Comments, 8:18 p m Email to a Friend Share on Facebook Share on TwitterPrint this Article View. "Amid coronavirus pandemic, a growing list of colleges in financial peril - The Boston Globe". BostonGlobe.com. Retrieved June 19, 2020.CS1 maint: numeric names: authors list (link)
- Fern, Deirdre; Staff, es Globe; May 8, Updated; 2020; Comments, 8:18 p m Email to a Friend Share on Facebook Share on TwitterPrint this Article View. "Amid coronavirus pandemic, a growing list of colleges in financial peril - The Boston Globe". BostonGlobe.com. Retrieved June 19, 2020.CS1 maint: numeric names: authors list (link)
- Fern, Deirdre; Staff, es Globe; May 8, Updated; 2020; Comments, 8:18 p m Email to a Friend Share on Facebook Share on TwitterPrint this Article View. "Amid coronavirus pandemic, a growing list of colleges in financial peril - The Boston Globe". BostonGlobe.com. Retrieved June 19, 2020.CS1 maint: numeric names: authors list (link)
- Fern, Deirdre; Staff, es Globe; May 8, Updated; 2020; Comments, 8:18 p m Email to a Friend Share on Facebook Share on TwitterPrint this Article View. "Amid coronavirus pandemic, a growing list of colleges in financial peril - The Boston Globe". BostonGlobe.com. Retrieved June 19, 2020.CS1 maint: numeric names: authors list (link)
- Fern, Deirdre; Staff, es Globe; May 8, Updated; 2020; Comments, 8:18 p m Email to a Friend Share on Facebook Share on TwitterPrint this Article View. "Amid coronavirus pandemic, a growing list of colleges in financial peril - The Boston Globe". BostonGlobe.com. Retrieved June 19, 2020.CS1 maint: numeric names: authors list (link)
- "Student Loans For Study Abroad | Scholarship to Study in USA". University in the USA. Archived from the original on September 23, 2013. Retrieved September 21, 2013.
- Clark, Kim (November 17–24, 2008). Does it Matter That Your Professor Is Part Time?. US News and World Report.
- Eric A. Hanushek, Ludger Woessmann, Eliot A. Jamison and Dean T. Jamison, "Education and Economic Growth: It's not just going to school, but learning something while there that matters", Education Next, Spring 2008 / Vol. 8, No. 2
- "OECD calls for broader access to post-school education and training". Oecd.org. September 13, 2005. Retrieved September 21, 2013.
- "Education Spending Statistics". nationmaster.com. Archived from the original on November 12, 2011. Retrieved December 29, 2010.
- Barshay, Jill (April 16, 2013). "Per pupil spending by school district in the United States". Education By the Numbers. Teachers College, Columbia University. Retrieved February 13, 2016.
- "Per Pupil Spending Varies Heavily Across the United States". United States Census Bureau. June 2, 2015. Retrieved February 13, 2016.
- "Analysis of spending in America's largest school districts". Ballotpedia. November 17, 2014. Retrieved February 13, 2016.
- "How much money does the United States spend on public elementary and secondary schools?". National Center for Education Statistics. US Department of Education.
- Coulson, Andrew (March 18, 2014). "State Education Trends: Academic Performance and Spending over the Past 40 Years" (PDF). Cato Institute. Retrieved March 2, 2016.
- Luke, Peter (May 27, 2008). "A tax increase for Michigan school funding is possible only if school districts cut costs, says Flint Journal columnist Peter Luke". The Flint Journal. Archived from the original on May 31, 2008. Retrieved June 12, 2008.
- "Revenues and Expenditures for Public Elementary and Secondary Education, Table 1". National Center for Education Statistics. Retrieved June 4, 2014.
- "Using Market Valuation to Assess the Importance and Efficiency of Public School Spending, Federal Reserve Bank of Chicago" (PDF).
- Greene Sterling, Terry; Joffe-Block, Jude (September 5, 2018). "The job Americans won't take: Arizona looks to Philippines to fill teacher shortage". The Guardian. Retrieved September 5, 2018.
- Eric A. Hanushek and Alfred A. Lindseth, Schoolhouses, Courthouses, and Statehouses: Solving the funding-achievement puzzle in America's public schools (Princeton, NJ: Princeton University Press, 2010, ISBN 978-0691130002)
- "McCleary v. Washington State" (PDF).
- Cavaliere, Victoria (September 11, 2014). "Washington's Supreme Court holds state in contempt over education". Reuters. Retrieved September 13, 2014.
- Racioppi, Dustin (March 23, 2014). "Dire Straits for some state pensions". USA Today. pp. 6B. Retrieved March 23, 2014.
- "Student Loans". Grove City College. Archived from the original on July 16, 2010. Retrieved October 6, 2010.
- Carnoy, Martin; Rothstein, Richard (2015). "What International Test Scores Tell Us". Society. 52 (2): 122–128. doi:10.1007/s12115-015-9869-3.
- Jay Matthews, Post's education columnist (September 20, 2013). "Book Review: 'The Smartest Kids in the World: And How They Got That Way' by Amanda Ripley". Washingtonpost.com. Retrieved May 1, 2018.
- Ferguson, Maria (2015). "Washington View So you want to be an education president?". Phi Delta Kappan. 96 (6): 72–73. doi:10.1177/0031721715575307.
- "College Admission Officers". April 5, 2015.
- "Highlights of the 2002–2003 Supreme Court Term". Supct.law.cornell.edu. Retrieved April 14, 2010.
- Hurst, C. Social Inequality: Forms, Causes, and Consequences. Sixth Edition. 2007. 374–377.
- Rimer, Sara; Arenson, Karen W. (June 24, 2004). "Top Colleges Take More Blacks, But Which Ones?". The New York Times. Retrieved February 22, 2011.
- "Amid charge of bias, Rapelye stands firm Archived July 29, 2014, at the Wayback Machine". The Daily Princetonian. November 30, 2006.
- Ryan, Camille; Siebens, Julie (March 2016). "Educational Attainment in the United States: 2015" (PDF). U.S. Census Bureau. Retrieved December 22, 2017.
- "US Census Bureau report on educational attainment in the United States, 2003" (PDF). Retrieved July 31, 2006.
- Goldin, C., Katz, L.F. The Race between Education and Technology. The Belknap Press of the Harvard University Press. Cambridge, Massachusetts: 2008.
- Butrymowicz, Sarah (January 30, 2017). "Most colleges enroll many students who aren't prepared for higher education". Hechinger Report. Teachers College at Columbia University. Retrieved March 1, 2019.
A high school diploma, no matter how recently earned, doesn't guarantee that students are prepared for college courses.
- Jaschik, Scott (March 29, 2016). "Grade Inflation, Higher and Higher". Inside Higher Ed. Retrieved July 7, 2016.
- Kommer, David (2016). "Considerations for Gender-Friendly Classrooms". Middle School Journal. 38 (2): 43–49. doi:10.1080/00940771.2006.11461573.
- "Students Affected by Achievement Gaps". NEA. December 3, 2008. Retrieved September 21, 2013.
- "Research Center: Achievement Gap". Edweek.org. Retrieved September 21, 2013.
- Singham, Mano. 2005. The Achievement Gap in U.S. Education: Canaries in the Mine. Lanham, MD: Rowman and Littlefield Education.
- Parker, Kathleen (December 13, 2012). "Reluctant First Father". Florida Today. Melbourne, Florida. pp. 7A.
- "Lino Graglia, UT Law Professor, Decries Single Motherhood, Black Test Scores, And Affirmative Action (VIDEO)". Huffingtonpost.com. December 11, 2012. Retrieved February 18, 2015.
- Herrnstein, Richard J.; Murray, Charles (1994). The bell curve: intelligence and class structure in American life ([4. Dr.] ed.). New York, N.Y.: Free Press. ISBN 978-0-02-914673-6.
- Lynn, Richard (2008). The global bell curve: race, IQ, and inequality worldwide. Augusta, Ga.: Washington Summit Publishers. ISBN 978-1-59368-028-2.
- "International Outcomes of Learning in Mathematics Literacy and Problem Solving" (PDF). National Center for Education Statistics. Retrieved September 21, 2013.
- "PISA 2006 Science Competencies for Tomorrow's World Volume 1: Analysis" (PDF). Retrieved April 14, 2010.
- Jay Mathews (October 19, 2009). "Tests don't always offer right answers". Washington Post. pp. 3B.
- "Education and class. America's new aristocracy". The Economist. January 24, 2015. Retrieved January 29, 2015.
- National Conference of State Legislatures (NCSL). "No Time to Lose, How to Build a World-Class Education System State by State." NCSL, Aug. 2016. Web. 07 Oct 2016. <http://www.ncsl.org/documents/educ/EDU_International_final_v3.pdf>.
- "McKinsey and Company, "The Economic Impact of the Achievement Gap on America's Schools."" (PDF). April 2009. p. 5. Archived from the original (PDF) on September 4, 2015. Retrieved September 21, 2013.
- "The Condition of College & Career Readiness 2012". ACT. August 21, 2013. Archived from the original on September 22, 2013. Retrieved September 21, 2013.
- U.S. Department of Education, "Public School Graduates and Dropouts from the Common Core Data: School Year 2009–10" (provisional data). January 2013.
- McKinsey and Company, "The Economic Impact of the Achievement Gap on America's Schools." April 2009. Forty years ago, the US led the world in high school graduation rates; now it is 18th out of 24 industrial nations. In 1995, the US was tied for first in college graduation; it now is 14th.
- "Literacy in America" (PDF). National Center for Educational Statistics. April 2002. Retrieved December 11, 2007.
- Toppo, Greg (January 8, 2009). "Literacy study: 1 in 7 U.S. adults are unable to read this story". Usatoday.com. Retrieved September 21, 2013.
- "The U.S. Illiteracy Rate Hasn't Changed in 10 Years". The Huffington Post. September 6, 2013. Retrieved July 29, 2014.
- Sarah Burd-Sharps, Jeff Elder, Kristen Lewis, and Eduardo Martins. "Goals for the Common Good: Exploring the Impact of Education." Measure of America and United Way Worldwide. http://ssrc-static.s3.amazonaws.com/moa/CGF_FINAL.pdf
- Doe, John (April 28, 2013). "News". Florida Today. Melbourne, Florida. pp. 1A.
- Farrell, Colin (February 2016). "Corporal punishment in US schools". World Corporal Punishment Research. Retrieved May 10, 2016.
- Anderson, Melinda D. (December 15, 2015). "The States Where Teachers Can Still Spank Students". The Atlantic. Retrieved May 10, 2016.
- Tauber, Robert T. (January 1, 2007). Classroom Management: Sound Theory and Effective Practice. Greenwood Publishing Group. p. 78. ISBN 9780275996680.
- "Security Checkpoint – National School Boards Association". www.nsba.org.
- "Crime, Violence, Discipline, and Safety in U.S. Public Schools: Findings From the School Survey on Crime and Safety: 2015–16". nces.ed.gov. July 27, 2017.
- "StackPath". www.schoolsecurity.org. Archived from the original on March 29, 2009.
- "School Resource Officer". Online Police Academy. Archived from the original on May 7, 2010. Retrieved April 14, 2010.
- "New York school district's facial recognition system sparks privacy fears". The Guardian. Retrieved May 31, 2019.
- "Facial Recognition Technology in US Schools Threatens Rights". Human Rights Watch. June 21, 2019. Retrieved June 21, 2019.
- Reader's Digest, pp. 123–7, March 2006; Cheating: "but everybody is doing it".
- "Astronomy Education in the United States". Astronomical Society of the Pacific. Archived from the original on October 8, 2010. Retrieved October 22, 2010.
- "What is GENIP?". Geographic Education National Implementation Project. Archived from the original on October 8, 2010. Retrieved October 22, 2010.
- Harm de Blij (November 3, 1999). "Geographic Education and Public Policy". About.com. Retrieved October 21, 2010.
- "Puerto Rico Public School – List of Puerto Rico Public Schools".
- "Native Now : Language: Cherokee". We Shall Remain – American Experience – PBS. 2008. Retrieved April 9, 2014.
- "Cherokee Language Revitalization". Cherokee Preservation Foundation. 2014. Archived from the original on April 7, 2014. Retrieved April 9, 2014.
- Kituwah Preservation & Education Program Powerpoint, by Renissa Walker (2012)'. 2012. Print.
- Chavez, Will (April 5, 2012). "Immersion students win trophies at language fair". Cherokeephoenix.org. Retrieved April 8, 2013.
- "Immersion School".
- "Summary Tables on Language Use and English Ability: 2000. United States Census (2000)". Census.gov. Retrieved September 21, 2013.
- "Kansas school board's evolution ruling angers science community". Cnn.com. August 12, 1999. Retrieved September 21, 2013.
- "Statements from Scientific and Scholarly Organizations". National Center for Science Education. Archived from the original on March 28, 2008. Retrieved September 21, 2013.
- Myers, P.Z. "Nicholas Wade flails at the philosophy of science", Pharyngula, October 9, 2009 Archived March 14, 2012, at the Wayback Machine
- Shermer, Michael. Why People Believe Weird Things, Second Edition (2002), Henry Holt, Page 142
- "Poll: Creationism Trumps Evolution. CBS News Polls (2004)". Cbsnews.com. February 11, 2009. Retrieved September 21, 2013.
- "Kansas: Anti-Evolution Guidelines Are Repealed". N.Y. Times. New York. Associated Press. February 14, 2007. Archived from the original on April 11, 2009. Retrieved November 21, 2014.
- Landry DJ, Singh S, Darroch JE (September–October 2000). "Sexuality education in fifth and sixth grades in U.S. public schools, 1999". Family Planning Perspectives. 32 (5): 212–9. doi:10.2307/2648174. JSTOR 2648174. PMID 11030258.
- "Sex Education in the U.S.: Policy and Politics" (PDF). Issue Update. Kaiser Family Foundation. October 2002. Archived from the original (PDF) on November 27, 2005. Retrieved May 23, 2007.
- Darroch JE, Landry DJ, Singh S (September–October 2000). "Changing emphases in sexuality education in U.S. public secondary schools, 1988–1999". Family Planning Perspectives. 32 (5): 204–11, 265. doi:10.2307/2648173. JSTOR 2648173. PMID 11030257. See especially Table 3.
- "Sex Education in America – General Public/Parents Survey. NPR/Kaiser/Harvard survey (2004)" (PDF). Retrieved September 21, 2013.
- Thompson, Lizzie (April 3, 2016). "Sex Ed, America, 2016: Where the Information Is Often Absent – or Medically Inaccurate". Retrieved April 4, 2016.
- Blake, Mariah. "Revisionaries: How a group of Texas conservatives is rewriting your kids' textbooks. January/February 2010". Washingtonmonthly.com. Archived from the original on September 6, 2013. Retrieved September 21, 2013.
- "Texas Conservatives win Curriculum Change". The New York Times.
- "Texas Approves Disputed History Texts for Schools". The New York Times.
- James W. Loewen, "Lies My Teacher Told Me: Everything Your American History Textbook Got Wrong" (The New Press, 1995)
- Gay, Geneva (2000). Culturally-Responsive Teaching. Teachers College Press.
- Day, C. B.; Allvin, R. E. (2016). "America's Racial Wounds: Healing Needs to Start Early". YC: Young Children. 71 (2): 44–46.
- "Culturally Responsive Teaching | Teaching Diverse Learners". www.brown.edu. Retrieved May 29, 2017.
- Howard, Tyrone C. (June 1, 2001). "Telling Their Side of the Story: African-American Students' Perceptions of Culturally Relevant Teaching". The Urban Review. 33 (2): 131–149. doi:10.1023/A:1010393224120. ISSN 0042-0972.
- Evans‐Winters, Venus E.; Twyman Hoff, Pamela (2011). "The aesthetics of white racism in pre‐service teacher education: A critical race theory perspective". Race Ethnicity and Education. 14 (4): 461–479. doi:10.1080/13613324.2010.548376.
- Pauline, Roberts (June 30, 2016). "Reflection: A Renewed and Practical Focus for an Existing Problem in Teacher Education". Australian Journal of Teacher Education. 41 (7): 19–35. doi:10.14221/ajte.2016v41n7.2. ISSN 0313-5373.
- Ambrose, S. A.; Bridges, M.W.; DiPietro, M.; Lovett, M.C. (2010). How learning works: Seven research-based principles for smart teaching. San Francisco, CA: Jossey Bass.
- American Association of University Women (1992), How schools shortchange girls', New York
- "Education". Gender Spectrum. Retrieved May 29, 2017.
- "LGBT-Inclusive Curriculum Guide for Educators". GLSEN. Retrieved May 29, 2017.
- Snapp, Shannon D.; Burdge, Hilary; Licona, Adela C.; Moody, Raymond L.; Russell, Stephen T. (2015). "Students' Perspectives on LGBTQ-Inclusive Curriculum". Equity & Excellence in Education. 48 (2): 249–265. doi:10.1080/10665684.2015.1025614.
- Pearce, Lynne (2017). "Making nurse education LGBT-Friendly". Nursing Standard. 31 (23): 22–24. doi:10.7748/ns.31.23.22.s23. PMID 28145168.
- "How to Support Special Needs Students". PhdinSpecialEducation.com
- Kreimeyer, K. H.; Crooke, P.; Drye, C.; Egbert, V.; Klein, B. (2000). "Academic and Social Benefits of a Co-enrollment Model of Inclusive Education for Deaf and Hard-of-Hearing Children". Journal of Deaf Studies and Deaf Education. 5 (2): 174–185. doi:10.1093/deafed/5.2.174. PMID 15454511.
- Chandler-Olcott, Kelly; Kluth, Paula (2009). "Why Everyone Benefits from Including Students with Autism in Literacy Classrooms". The Reading Teacher. 62 (7): 548–557. doi:10.1598/rt.62.7.1. S2CID 56237370.
- Ruijs, Nienke M.; Peetsma, Thea T.D. (2009). "Effects of inclusion on students with and without special educational needs reviewed". Educational Research Review. 4 (2): 67–79. doi:10.1016/j.edurev.2009.02.002.
- Tran, Nellie; Birman, Dina (December 24, 2017). "Acculturation and Assimilation: A Qualitative Inquiry of Teacher Expectations for Somali Bantu Refugee Students". Education and Urban Society. 51 (5): 712–736. doi:10.1177/0013124517747033. ISSN 0013-1245.
- Allard, Elaine C. (October 24, 2016). "Latecomers: The Sources and Impacts of Late Arrival Among Adolescent Immigrant Students". Anthropology & Education Quarterly. 47 (4): 366–384. doi:10.1111/aeq.12166. ISSN 0161-7761.
- Arphattananon, Thithimadee (June 11, 2012). "Education that Leads to Nowhere: Thailand's Education Policy for Children of Migrants". International Journal of Multicultural Education. 14 (1). doi:10.18251/ijme.v14i1.537. ISSN 1934-5267.
- Adesope, Olusola O.; Lavin, Tracy; Thompson, Terri; Ungerleider, Charles (January 6, 2011). "Pedagogical strategies for teaching literacy to ESL immigrant students: A meta-analysis". British Journal of Educational Psychology. 81 (4): 629–653. doi:10.1111/j.2044-8279.2010.02015.x. ISSN 0007-0998. PMID 22050311.
- Callahan, Rebecca; Wilkinson, Lindsey; Muller, Chandra; Frisco, Michelle (February 5, 2008). "ESL Placement and Schools". Educational Policy. 23 (2): 355–384. doi:10.1177/0895904807310034. ISSN 0895-9048. PMC 2898206. PMID 20617111.
- "School-to-Prison Pipeline". American Civil Liberties Union.
- Saady, Brian. "Throwing Children Away: The School-to-Prison Pipeline". The American Conservative.
- "Education Commissioner Highlights Importance of Libraries – Massachusetts Department of Elementary and Secondary Education". Doe.mass.edu. June 5, 2002. Retrieved July 13, 2012.
- "Trans-Atlantic Comparisons, part 2: Why Europeans Have It Wrong About Americans". Spiegel Online. May 6, 2009.
- "Length of School Day". uft.org/. Retrieved January 25, 2015.
- Reed, Matt (October 19, 2013). "Brevard's new literacy crusade:United Way". Florida Today. Melbourne, Florida. pp. 1A. Retrieved October 19, 2013.
Further reading
- Sennholz, Hans F., ed. Public Education and Indoctrination, in series, The Freeman Classics. Irvington-on-Hudson, N.Y.: Foundation for Economic Education, 1993. iv, 203 p. N.B.: Sennholz is not clearly identified as the editor of this collection of essays on the subject, but his editorship seems probable.
Bibliography
- Berliner, David C.
- Goldstein, Dana (2014). The Teacher Wars: A History of America's Most Embattled Profession. Doubleday. ISBN 978-0-385-53695-0.
- Green, Elizabeth (2014). Building a Better Teacher: How Teaching Works (and How to Teach It to Everyone). W. W. Norton & Company. ISBN 978-0-393-08159-6.
- Hanushek, Eric (2013). Endangering Prosperity: A Global View of the American School. Brookings Institution. ISBN 978-0-8157-0373-0.
- Woodring, Paul. A Fourth of a Nation. New York: McGraw-Hill Book Co., 1957. 255 p. N.B.: Philosophical and practical reflections on education, teaching, educational psychology, and the training of teachers.
History
for more detailed bibliography see History of Education in the United States: Bibliography
- James D. Anderson, The Education of Blacks in the South, 1860–1935 (University of North Carolina Press, 1988).
- Axtell, J. The school upon a hill: Education and society in colonial New England. Yale University Press. (1974).
- Maurice R. Berube; American School Reform: Progressive, Equity, and Excellence Movements, 1883–1993. 1994. online version
- Brint, S., & Karabel, J. The Diverted Dream: Community colleges and the promise of educational opportunity in America, 1900–1985. Oxford University Press. (1989).
- Button, H. Warren and Provenzo, Eugene F., Jr. History of Education and Culture in America. Prentice-Hall, 1983. 379 pp.
- Cremin, Lawrence A. The Transformation of the School: Progressivism in American Education, 1876–1957. (1961).
- Cremin, Lawrence A. American Education: The Colonial Experience, 1607–1783. (1970); American Education: The National Experience, 1783–1876. (1980); American Education: The Metropolitan Experience, 1876–1980 (1990); standard 3 vol detailed scholarly history
- Curti, M. E. The social ideas of American educators, with new chapter on the last twenty-five years. (1959).
- Dorn, Sherman. Creating the Dropout: An Institutional and Social History of School Failure. Praeger, 1996. 167 pp.
- Gatto, John Taylor. The Underground History of American Education: An Intimate Investigation into the Prison of Modern Schooling. Oxford Village Press, 2001, 412 pp. online version
- Herbst, Juergen. The once and future school: Three hundred and fifty years of American secondary education. (1996).
- Herbst, Juergen. School Choice and School Governance: A Historical Study of the United States and Germany 2006. ISBN 1-4039-7302-4.
- Kemp, Roger L. "Town & Gown Relations: A Handbook of Best Practices," McFarland and Company, Inc., Publisher, Jefferson, North Carolina, USA, and London, England (UK)(2013). ISBN 9780786463992.
- Krug, Edward A. The shaping of the American high school, 1880–1920. (1964); The American high school, 1920–1940. (1972). standard 2 vol scholarly history
- Lucas, C. J. American higher education: A history. (1994). pp.; reprinted essays from History of Education Quarterly
- Parkerson, Donald H. and Parkerson, Jo Ann. Transitions in American Education: A Social History of Teaching. Routledge, 2001. 242 pp.
- Parkerson, Donald H. and Parkerson, Jo Ann. The Emergence of the Common School in the U.S. Countryside. Edwin Mellen, 1998. 192 pp.
- Peterson, Paul E. The politics of school reform, 1870–1940. (1985).
- Ravitch, Diane. Left Back: A Century of Failed School Reforms. Simon & Schuster, 2000. 555 pp.
- John L. Rury; Education and Social Change: Themes in the History of American Schooling.'; Lawrence Erlbaum Associates. 2002. online version
- Sanders, James W The education of an urban minority: Catholics in Chicago, 1833–1965. (1977).
- Solomon, Barbara M. In the company of educated women: A history of women and higher education in America. (1985).
- Theobald, Paul. Call School: Rural Education in the Midwest to 1918. Southern Illinois U. Pr., 1995. 246 pp.
- David B. Tyack. The One Best System: A History of American Urban Education (1974),
- Tyack, David and Cuban, Larry. Tinkering Toward Utopia: A Century of Public School Reform. Harvard U. Pr., 1995. 184 pp.
- Tyack, David B., & Hansot, E. Managers of Virtue: Public School Leadership in America, 1820–1980. (1982).
- Veysey Lawrence R. The Emergence of the American University. (1965).
External links
| Wikimedia Commons has media related to Education in the United States. |
| Wikisource has the text of the 1920 Encyclopedia Americana article Education in the United States. |
| Wikiquote has quotations related to: Education in the United States |
- National Center for Education Statistics
- Information on studying in the US
- High School Grade Point Average Calculator – Standard grade point average calculator for US High Schools.
- Information on education in United States, OECD – Contains indicators and information about United States and how it compares to other OECD and non-OECD countries
- Diagram of American education system, OECD – Using 1997 ISCED classification of programmes and typical ages.
Library guides
- Brown University Library. "Education". Research Guides. Rhode Island.
- Fordham University Libraries. "Education". Research Guides. New York.
- Harvard Graduate School of Education – Gutman Library. "Research Guides". Massachusetts.
- University of Texas at San Antonio Libraries. "Education". Research Guides.
Education in the Americas | ||
|---|---|---|
| ||
| Sovereign states |
| .svg.png) |
| ||