Hirbandh (community development block)
Hirbandh is a community development block (CD block) that forms an administrative division in the Khatra subdivision of the Bankura district in the Indian state of West Bengal.
Hirbandh | |
|---|---|
Community development block | |
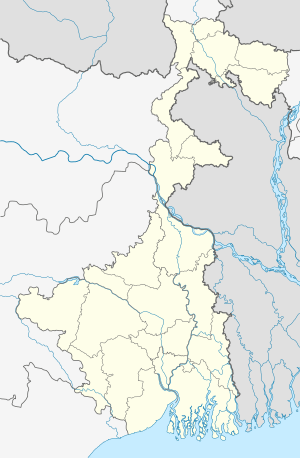 Hirbandh Location in West Bengal, India 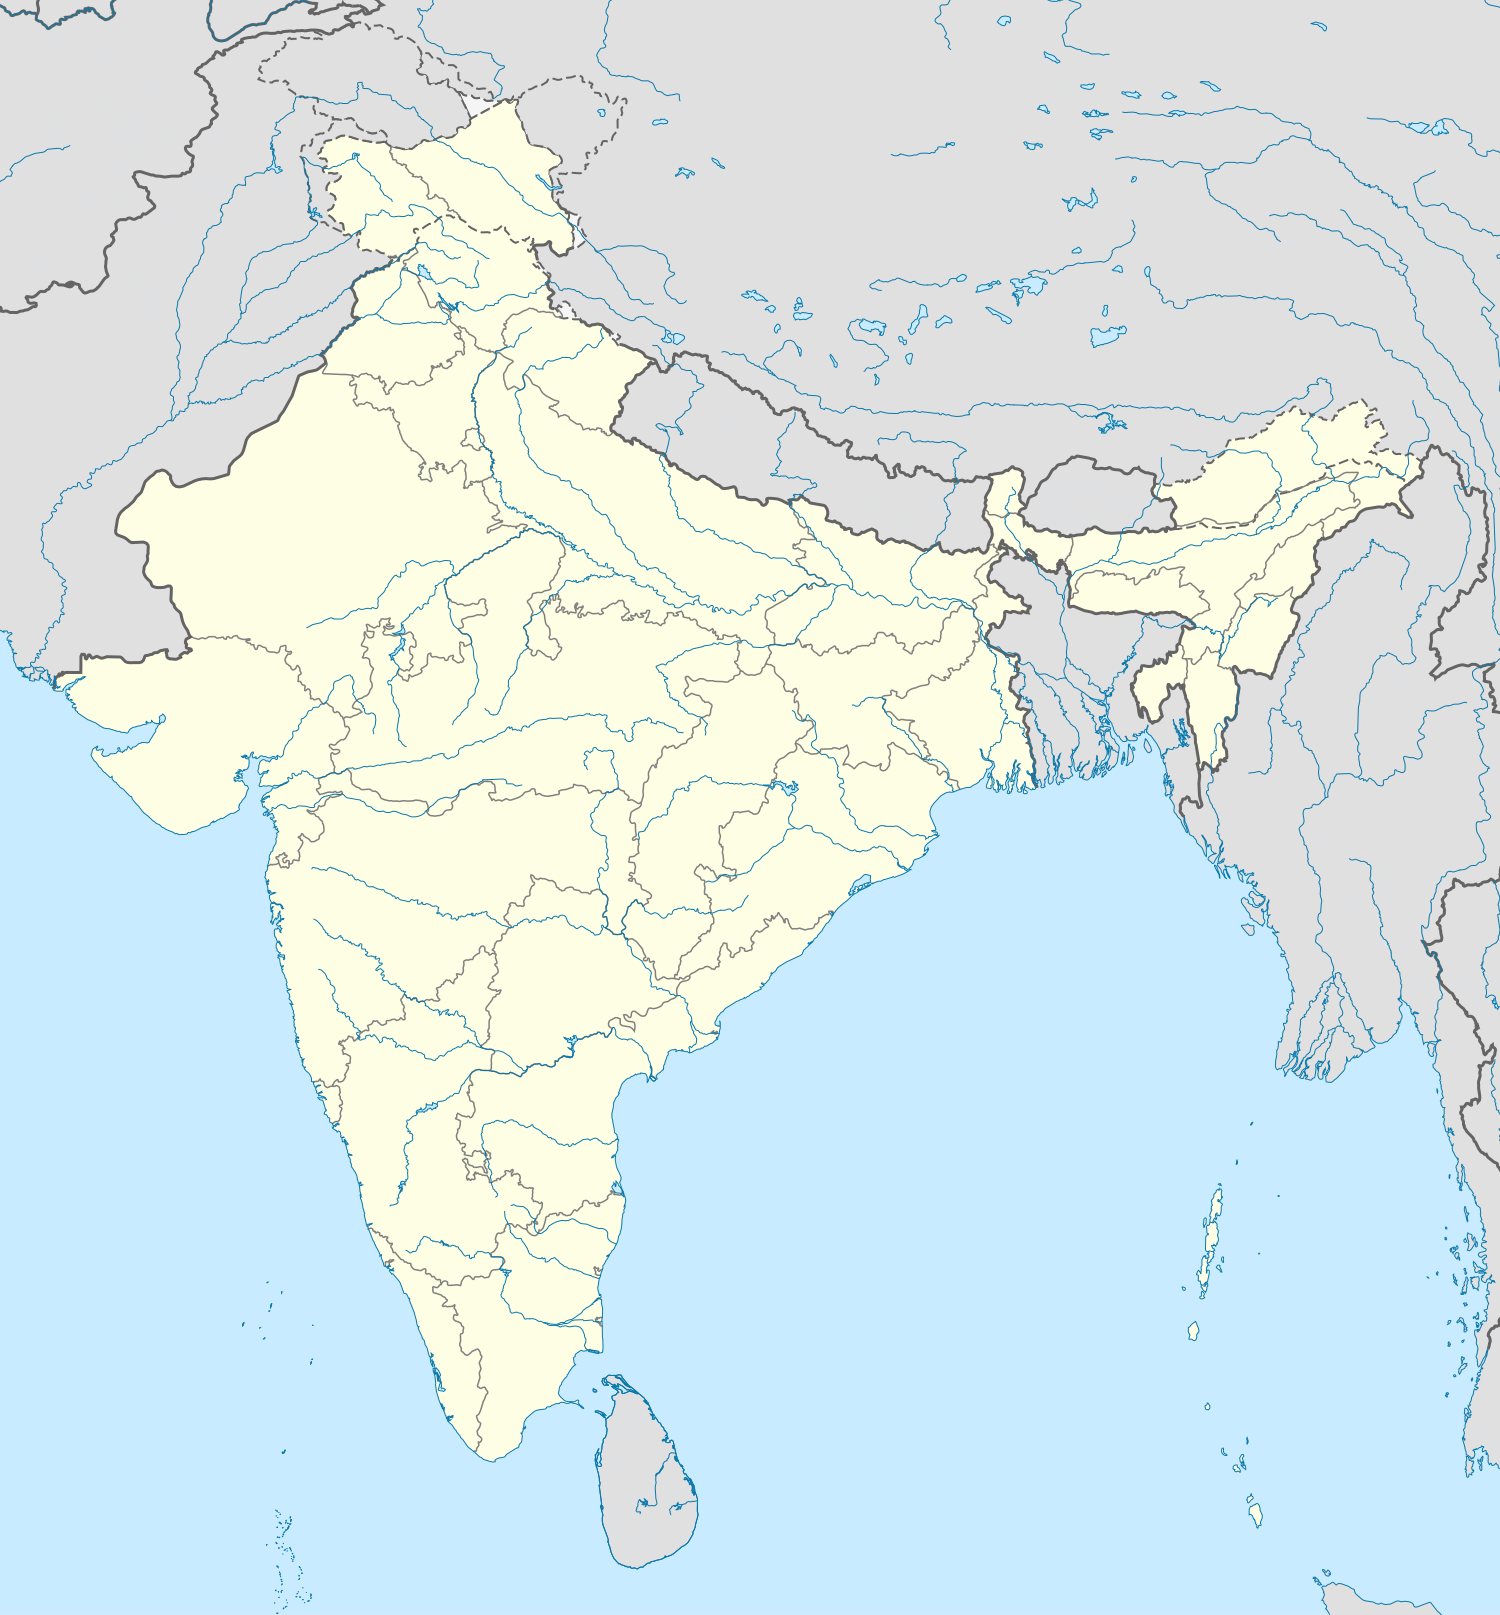 Hirbandh Hirbandh (India) | |
| Coordinates: 23.0633859°N 86.8022919°E | |
| Country | |
| State | West Bengal |
| District | Bankura |
| Government | |
| • Type | Representative democracy |
| Area | |
| • Total | 215.60 km2 (83.24 sq mi) |
| Elevation | 123 m (404 ft) |
| Population (2011) | |
| • Total | 83,834 |
| • Density | 390/km2 (1,000/sq mi) |
| Languages | |
| • Official | Bengali, Santali, English |
| Time zone | UTC+5:30 (IST) |
| PIN | 722171 (Hirbandh) |
| Telephone/STD code | 03243 |
| ISO 3166 code | IN-WB |
| Vehicle registration | WB-67, WB-68 |
| Literacy | 64.18% |
| Lok Sabha constituency | Bankura |
| Vidhan Sabha constituency | Ranibandh ST |
| Website | bankura |
History
From Bishnupur kingdom to the British Raj
From around the 7th century AD till around the advent of British rule, for around a millennium, history of Bankura district is identical with the rise and fall of the Hindu Rajas of Bishnupur. The Bishnupur Rajas, who were at the summit of their fortunes towards the end of the 17th century, started declining in the first half of the 18th century. First, the Maharaja of Burdwan seized the Fatehpur Mahal, and then the Maratha invasions laid waste their country.[1]
Bishnupur was ceded to the British with the rest of Burdwan chakla in 1760. In 1787, Bishnupur was united with Birbhum to form a separate administrative unit. In 1793 it was transferred to the Burdwan collectorate. In 1879, the district acquired its present shape with the thanas of Khatra and Raipur and the outpost of Simplapal being transferred from Manbhum, and the thanas of Sonamukhi, Kotulpur and Indas being retransferred from Burdwan. However, it was known for sometime as West Burdwan and in 1881 came to be known as Bankura district.[1]
Geography

Hirbandh is located at 23°03′48″N 86°48′08″E
Hirbandh CD block is located in the western part of the district and belongs to the hard rock area.[2]
Hirbandh CD block is bounded by Indpur CD block on the north, Khatra CD block on the east and on a part of the south, Ranibandh CD block on the rest of the south and Manbazar I CD block, in Purulia district, on the west.[3][4]
Hirbandh CD block has an area of 190.97 km2. It has 1 panchayat samity, 5 gram panchayats, 59 gram sansads (village councils), 121 mouzas and 116 inhabited villages. Hirbandh police station serves this block.[5] Headquarters of this CD block is at Hirbandh.[6]
Gram panchayats of Hirbandh block/ panchayat samiti are: Baharamuri, Gopalpur, Hirbandh, Malian and Mashiara.[7]
Demographics
Population
According to the 2011 Census of India Hirbandh CD block had a total population of 83,834, all of which were rural. There were 42,917 (51%) males and 40,917 (49%) females. Population in the age range of 0 to 6 years was 9,977. Scheduled Castes numbered 22,827 (27.23%) and Scheduled Tribes numbered 23,806 (28.40%).[8]
According to the 2001 census, Hirbandh community development block had a total population of 72,499 of which 37,230 were males and 35,269 were females. Decadal growth for the period 1991-2001 was 16.53% for Hirdih, against 13.79% in Bankura district.[9] Decadal growth in West Bengal was 17.84%.[10]
Villages in Hirbandh CD block are (2011 census figures in brackets): Hirbandh (1,733), Baharamuri (2,401), Malian (2,457), Gopalpur (999) and Mosiara (2,559).[8]
Literacy
According to the 2011 census, the total number of literates in Hirbandh CD block was 47,399 (64.18% of the population over 6 years) out of which males numbered 29,446 (77.80% of the male population over 6 years) and females numbered 17,953 (49.86%) of the female population over 6 years). The gender disparity (the difference between female and male literacy rates) was 27.94%.[8]
See also – List of West Bengal districts ranked by literacy rate
| Literacy in CD Blocks of Bankura district |
|---|
| Bankura Sadar subdivision |
| Saltora – 61.45% |
| Mejia – 66.83% |
| Gangajalghati – 68.11% |
| Chhatna – 65.73% |
| Bankura I – 68.74% |
| Bankura II – 73.59% |
| Barjora – 71.67% |
| Onda – 65.82% |
| Bishnupur subdivision |
| Indas – 71.70% |
| Joypur – 74.57% |
| Patrasayer – 64.8% |
| Kotulpur – 78.01% |
| Sonamukhi – 66.16% |
| Bishnupur – 66.30% |
| Khatra subdivision |
| Indpur – 67.42% |
| Ranibandh – 68.53% |
| Khatra – 72.18% |
| Hirbandh – 64.18% |
| Raipur – 71.33% |
| Sarenga – 74.25% |
| Simlapal – 68.44% |
| Taldangra – 70.87% |
| Source: 2011 Census: CD Block Wise Primary Census Abstract Data |
Language and religion
According to the District Census Handbook 2011, Bankura, as of 2001, Bengali was the mother-tongue of 89.9% of the population, followed by Santali (8.1%), Kurmali Thar (1.1%), Hindi (0.5%) and Telugu (0.1%).[11]
There is a tribal presence in many of the CD blocks of the district. Santali is spoken by around 10% of the population in the district. Some people also speak Mundari.[12]
According to the West Bengal Official Language Act 1961 and the West Bengal Official Language (Amendment Act) 2012, the Bengali language is to be used for official purposes in the whole of West Bengal. In addition to Bengali, the Nepali language is to be used for official purposes in the three hills subdivisions, namely Darjeeling, Kalimpong and Kurseong, in the district of Darjeeling, and Urdu is to be used for official purposes in district/subdivision/ block/ municipality where the population speaking Urdu exceeds 10% of the total population. The English language will continue to be used for official purposes as it was being used prior to the enactment of these laws.[13][14][15][16]
The West Bengal Official Language (Second Amendment) Bill, 2012, included Hindi, Santhali, Odiya and Punjabi as official languages if it is spoken by a population exceeding 10 per cent of the whole in a particular block or sub-division or a district. Subsequently, Kamtapuri, Rajbanshi and Kurmali were also included in the list of minority languages by the West Bengal Official Language (Second Amendment) Bill, 2018.[17][18]However, as of 2020, there is no official / other reliable information about the areas covered.
In the 2011 census Hindus numbered 67,889 and formed 80.98% of the population in Hirbandh CD Block. Muslims numbered 1,945 and formed 2.32% of the population. Christians numbered 3 and formed 0.004% of the population. Others numbered 13,997 and formed 16.70% of the population.[19] Others include Addi Bassi, Marang Boro, Santal, Saranath, Sari Dharma, Sarna, Alchchi, Bidin, Sant, Saevdharm, Seran, Saran, Sarin, Kheria,[20] and other religious communities.[19]
Rural poverty
In Hirbandh CD block 49.95% families were living below poverty line in 2007.[21]According to the Rural Household Survey in 2005, 28.87% of the total number of families were BPL families in the Bankura district.[22]
Migration has been observed in the following CD blocks of Bankura district: Bankura I, Chhatna, Saltora, Indpur, Ranibandh, Hirbandh, Khatra, Raipur and Sarenga. Although authentic figures are not available, a sample survey has been done. According to the sample survey, around 54.5% to 85.4% of the families on an average migrate from these blocks. Another study shows that around 23% of the people from the under-privileged blocks in the western and southern Bankura migrate. Those migrating belong mostly to the SC or ST population. They migrate for periods varying from 15 days to 6/8 months. Most people migrate to meet their food deficit and go to Bardhaman and Hooghly districts but some go to Gujarat and Maharashtra as construction labour.[21]
Economy
Livelihood
Livelihood
in Hirbandh CD block
In the Hirbandh CD block in 2011, among the class of total workers, cultivators numbered 5,979 and formed 15.96%, agricultural labourers numbered 23,479and formed 62.66%, household industry workers numbered 1,000 and formed 2.67% and other workers numbered 5,801 and formed 23.96%.[23]Total workers numbered 37,470 and formed 44.70% of the total population, and non-workers numbered 46,364 and formed 55.30% of the population.[24]
Note: In the census records a person is considered a cultivator, if the person is engaged in cultivation/ supervision of land owned by self/government/institution. When a person who works on another person's land for wages in cash or kind or share, is regarded as an agricultural labourer. Household industry is defined as an industry conducted by one or more members of the family within the household or village, and one that does not qualify for registration as a factory under the Factories Act. Other workers are persons engaged in some economic activity other than cultivators, agricultural labourers and household workers. It includes factory, mining, plantation, transport and office workers, those engaged in business and commerce, teachers, entertainment artistes and so on.[25]
Infrastructure
There are 116 inhabited villages in the Hirbandh CD block, as per the District Census Handbook, Bankura, 2011. 100% villages have power supply. 100% villages have drinking water supply. 17 villages (14.66%) have post offices. 108 villages (93.10%) have telephones (including landlines, public call offices and mobile phones). 41 villages (35.34%) have pucca (paved) approach roads and 33 villages (28.45%) have transport communication (includes bus service, rail facility and navigable waterways). 4 villages (3.45%) have agricultural credit societies and 6 villages (5.17%) have banks.[26]
Agriculture
There were 33 fertiliser depots, 6 seed stores and 40 fair price shops in the Hirbandh CD block.[27]
In 2013-14, persons engaged in agriculture in Hirbandh CD block could be classified as follows: bargadars 1.34%, patta (document) holders 10.28%, small farmers (possessing land between 1 and 2 hectares) 7.12%, marginal farmers (possessing land up to 1 hectare) 23.81% and agricultural labourers 57.45%.[27]
In 2003-04 net area sown in Hirbandh CD block was 11,062 hectares and the area in which more than one crop was grown was 2,561 hectares.[28]
In 2013-14, the total area irrigated in Hirbandh CD block was 3,209 hectares, out of which 929 hectares was by canal water, 1,050 hectares by tank water, 940 hectares by river lift irrigation, 70 hectares by open dug wells and 220 hectares by other methods.[27]
In 2013-14, Hirbandh CD block produced 19,285 tonnes of Aman paddy, the main winter crop, from 7,829 hectares, 107 tonnes of wheat from 50 hectares and 1,431 tonnes of potatoes from 53 hectares. It also produced pulses and mustard.[27]
Handloom and pottery industries
The handloom industry engages the largest number of persons in the non farm sector and hence is important in Bankura district. The handloom industry is well established in all the CD blocks of the district and includes the famous Baluchari saris. In 2004-05 Hirbandh CD block had 407 looms in operation.[29]
Bankura district is famous for the artistic excellence of its pottery products that include the famous Bankura horse. The range of pottery products is categorised as follows: domestic utilities, terracota and other decorative items and roofing tiles and other heavy pottery items. Around 3,200 families were involved in pottery making in the district in 2002. 95 families were involved in Hirbandh CD block.[30]
Banking
In 2013-14, Hirbandh CD block had offices of 1 commercial bank and 3 gramin banks.[27]
Backward Regions Grant Fund
The Bankura district is listed as a backward region and receives financial support from the Backward Regions Grant Fund. The fund, created by the Government of India, is designed to redress regional imbalances in development. As of 2012, 272 districts across the country were listed under this scheme. The list includes 11 districts of West Bengal.[31][32]
Transport
In 2013-14, Hirbandh CD block had 6 originating/ terminating bus routes. The nearest railway station is 45 km from the CD block headquarters.[27]
State Highway 2 running from Bankura to Malancha (in North 24 Parganas district) and State Highway 4 running from Jhalda (in Purulia district) to Digha foreshore (in Purba Medinipur district) pass through this CD block.[33]
Education
In 2013-14, Hirbandh CD block had 95 primary schools with 6,121 students, 9 middle schools with 1,342 students, 6 high schools with 4,424 students and 7 higher secondary schools with 4,581 students. Hirbandh CD block had 78 institutions for special and non-formal education with 3,100 students.[34]
See also – Education in India
According to the 2011 census, in the Hirbandh CD block, among the 116 inhabited villages, 24 villages did not have a school, 21 villages had two or more primary schools, 20 villages had at least 1 primary and 1 middle school and 14 villages had at least 1 middle and 1 secondary school.[35]
Healthcare
In 2014, Hirbandh CD block had 1 rural hospital and 2 primary health centres with total 44 beds and 6 doctors. It had 18 family welfare sub centres and 1 family welfare centre. 2,991 patients were treated indoor and 171,046 patients were treated outdoor in the hospitals, health centres and subcentres of the CD block.[36]
Amjhuri (Hirbandh) Rural Hospital, with 30 beds at Hirbandh, is the major government medical facility in the Hirbandh CD block. There are primary health centres at Mosiara (Dharampur) (with 4 beds) and Molian (Shyamnagar) (with 10 beds).[37][38]
References
- O’Malley, L.S.S. "Bengal District Gazetteers: Bankura". Bankura District Authorities. Retrieved 29 August 2016.
- "District Census Handbook Bankura" (PDF). pages 13-17. Directorate of Census Operations West Bengal. Retrieved 8 December 2016.
- "District Census Handbook Bankura, Census of India 2011, Series 20, Part XII A" (PDF). Map on fifth page. Directorate of census Operations V, West Bengal. Retrieved 8 April 2020.
- "Puruliya Tehsil Map". Maps of India. Retrieved 8 April 2020.
- "District Statistical Handbook 2014 Bankura". Tables 2.1, 2.2. Department of Planning and Statistics, Government of West Bengal. Retrieved 15 May 2020.
- "District Census Handbook: Bankura" (PDF). Map of Bankura with CD Block HQs and Police Stations (on the fifth page). Directorate of Census Operations, West Bengal, 2011. Retrieved 20 November 2016.
- "Directory of District, Subdivision, Panchayat Samiti/ Block and Gram Panchayats in West Bengal". Bankura - Revised in March 2008. Panchayats and Rural Development Department, Government of West Bengal. Retrieved 27 August 2016.
- "C.D. block Wise Primary Census Abstract Data(PCA)". 2011 census: West Bengal – District-wise CD blocks. Registrar General and Census Commissioner, India. Retrieved 29 August 2016.
- "Provisional population totals, West Bengal, Table 4, Bankura District". Census of India 2001. Census Commission of India. Archived from the original on 28 September 2011. Retrieved 18 August 2016.
- "Provisional Population Totals, West Bengal. Table 4". Census of India 2001. Census Commission of India. Archived from the original on 27 September 2007. Retrieved 17 July 2016.
- "District Census Handbook Bankura, Census of India 2011, Series 20, Part XII A" (PDF). Page 48: Mother tongue. Directorate of census Operations V, West Bengal. Retrieved 8 April 2020.
- "Bengal District Gazetteers: Bankura by L.S.S.O'Malley, first published 1908, reprint 1995" (PDF). Language p. 51-52. Bankura District Administration. Retrieved 25 July 2016.
- "West Bengal Official Language Act 1961". Latest Laws.com. Retrieved 10 May 2020.
- "The West Bengal Official Language Act 1961". Advocate Tanmoy Law Library. Retrieved 10 May 2020.
- "The West Bengal Official Language Act, 1961" (PDF). Retrieved 10 May 2020.
- "Official status for Urdu in some West Bengal Areas". The Hindu, 2 April 2012. Retrieved 10 May 2020.
- "Multilingual Bengal". The Telegraph, 11 December 2012. Retrieved 15 January 2019.
- "Kamtapuri, Rajbanshi make it to the list of official languages in Bengal". Outlook, 28 February 2015. Retrieved 15 January 2019.
- "C1 Population by Religious Community". West Bengal. Registrar General and Census Commissioner, India. Retrieved 28 August 2016.
- "ST-14 A Details Of Religions Shown Under 'Other Religions And Persuasions' In Main Table". West Bengal. Registrar General and Census Commissioner, India. Retrieved 28 August 2016.
- "District Human Development Report: Bankura" (PDF). April 2007. Page 27, Pages 237-244. Development & Planning Department, Government of West Bengal. Archived from the original (PDF) on 7 February 2017. Retrieved 8 December 2016.
- "West Bengal Summary". Rural Household Survey 2005. Department of Panchayat & Rural Development, Government of West Bengal. Retrieved 10 April 2020.
- "District Census Handbook Bankura, Census of India 2011, Series 20, Part XII A" (PDF). Table 33: Distribution of Workers by Sex in Four Categories of Economic Activity in Sub-district 2011. Directorate of Census Operations, West Bengal. Retrieved 8 April 2020.
- "District Census Handbook Bankura, Census of India 2011, Series 20, Part XII A" (PDF). Table 30: Number and percentage of Main workers, Marginal workers and Non workers by Sex, in Sub-districts, 2011. Directorate of Census Operations, West Bengal. Retrieved 8 April 2020.
- "District Census Handbook Bankura, Census of India 2011, Series 20, Part XII A" (PDF). Census Concepts and Definitions, Page 27. Directorate of Census Operations, West Bengal. Retrieved 8 April 2020.
- "District Census Handbook, Bankura, 2011, Series 20, Part XII A" (PDF). Page 83, Table 36: Distribution of villages according to availability of different amenities, 2011. Directorate of Census Operations, West Bengal. Retrieved 10 April 2020.
- "District Statistical Handbook 2014 Bankura". Tables 8.2, 17.2, 18.2, 18.1, 20.1, 21.2, 4.4, 3.1, 3.3 – arranged as per use. Department of Planning and Statistics, Government of West Bengal. Retrieved 15 May 2020.
- "District Human Development Report: Bankura" (PDF). April 2007. Page: 58. Development & Planning Department, Government of West Bengal. Archived from the original (PDF) on 7 February 2017. Retrieved 23 August 2016.
- "District Human Development Report: Bankura" (PDF). April 2007. Page: 85. Development & Planning Department, Government of West Bengal. Archived from the original (PDF) on 7 February 2017. Retrieved 23 August 2016.
- "District Human Development Report: Bankura" (PDF). April 2007. Pages: 83-84. Development & Planning Department, Government of West Bengal. Archived from the original (PDF) on 7 February 2017. Retrieved 23 August 2016.
- "Backward Regions Grant Funds: Programme Guidelines" (PDF). Ministry of Panchayati Raj, Government of India. Archived from the original (PDF) on 30 October 2017. Retrieved 10 April 2020.
- "Backward Regions Grant Fund". Press Release, 14 June 2012. Press Information Bureau, Government of India. Retrieved 10 April 2020.
- "List of State Highways in West Bengal". West Bengal Traffic Police. Retrieved 23 August 2016.
- "District Statistical Handbook 2014 Bankura". Tables 4.4. Department of Planning and Statistics, Government of West Bengal. Retrieved 15 May 2020.
- "District Census Handbook, Bankura, 2011, Series 20, Part XII A" (PDF). Page 1293, Appendix I A: Villages by number of Primary Schools and Appendix I B: Villages by Primary, Middle and Secondary Schools. Directorate of Census Operations, West Bengal. Retrieved 10 April 2020.
- "District Statistical Handbook 2014 Bankura". Tables 3.1, 3.2, 3.3. Department of Planning and Statistics, Government of West Bengal. Retrieved 15 May 2020.
- "Health & Family Welfare Department" (PDF). Health Statistics – Rural Hospitals. Government of West Bengal. Retrieved 10 April 2020.
- "Health & Family Welfare Department" (PDF). Health Statistics – Primary Health Centres. Government of West Bengal. Retrieved 10 April 2020.