Demographics of Uttar Pradesh
The demographics of Uttar Pradesh is a complex topic, which is undergoing dynamic change. Uttar Pradesh is India's most populous state. It has a population of about 199,812,341[1] as per the 2011 census. If it were a separate country, Uttar Pradesh would be the world's fifth most populous nation, next only to China, India, the United States of America and Indonesia. Uttar Pradesh has a population more than that of Pakistan.[2] There is an average population density of 828 persons per km² i.e. 2,146 per sq mi. The capital of Uttar Pradesh is Lucknow, and Allahabad serves as the state’s judicial capital. Hindus and Muslims both consider the state as a holy place.
The peripheral regions of Uttar Pradesh, are home to a number of tribal communities such as Agaria, Baiga, Bhar, Bhoksa, Bind, Chero, Gond, Kol and Korwa. Five of these tribal communities have been recognised by the Government of India as disadvantaged scheduled tribes, viz. Tharus, Boksas, Bhotias, Jaunswaris and Rajis.[3] The Literacy rate of the state according to the 2011 Census is 70.69%. With the literacy rate for Males at 79.20%, while it is 59.30% for the Females. While this is still below the national average of 74.04% (82.14% for men, 65.16% for women) the rate of growth has been much higher in Uttar Pradesh as compared to the rest of India.
District
As of the 2011 census, Allahabad is the most populous district of Uttar Pradesh while Mahoba being the least populated. Only 3 districts of Jaunpur, Azamgarh and Deoria have a sex ratio greater than 1000 while Gautam Buddha Nagar stands lowest in the tally with a very low ratio of 851. On the contrary, Gautam Buddha Nagar scores highest in literacy rate at 80.12% and Kanpur Nagar 2nd at 79.54%, while both being the poorest districts in terms of sex-ratio, depicting a negative-correlation among literacy and sex-ratio in this case. Districts of Srawasti, Bahraich and Balrampur haven't even crossed the 50% literacy mark yet.
The following table enumerates population, sex-ratio and literacy rates for each district of Uttar Pradesh:
| District |
Population |
Sex ratio |
Literacy rate | ||||
|---|---|---|---|---|---|---|---|
| Male | Female | Total | Male | Female | Total | ||
| Agra | 2,364,953 | 2,053,844 | 4,418,797 | 868 | 80.62% | 61.18% | 71.58% |
| Aligarh | 1,951,996 | 1,721,893 | 3,673,889 | 882 | 77.97% | 55.68% | 67.51% |
| Allahabad | 3,131,807 | 2,822,584 | 5,954,391 | 901 | 82.55% | 60.99% | 72.32% |
| Ambedkar Nagar | 1,212,410 | 1,185,478 | 2,397,888 | 978 | 81.66% | 62.66% | 72.23% |
| Auraiya | 740,040 | 639,505 | 1,379,545 | 864 | 86.11% | 70.61% | 78.95% |
| Azamgarh | 2,285,004 | 2,328,909 | 4,613,913 | 1,019 | 81.34% | 60.91% | 70.93% |
| Baghpat | 700,070 | 602,978 | 1,303,048 | 861 | 82.45% | 59.95% | 72.01% |
| Bahraich | 1,843,884 | 1,643,847 | 3,487,731 | 892 | 58.34% | 39.18% | 49.36% |
| Ballia | 1,672,902 | 1,566,872 | 3,239,774 | 937 | 81.49% | 59.75% | 70.94% |
| Balrampur | 1,114,721 | 1,033,944 | 2,148,665 | 928 | 59.73% | 38.43% | 49.51% |
| Banda | 965,876 | 833,534 | 1,799,410 | 863 | 77.78% | 53.67% | 66.67% |
| Bara Banki | 1,707,073 | 1,553,626 | 3,260,699 | 910 | 70.27% | 52.34% | 61.75% |
| Bareilly | 2,357,665 | 2,090,694 | 4,448,359 | 887 | 67.50% | 48.30% | 58.49% |
| Basti | 1,255,272 | 1,209,192 | 2,464,464 | 963 | 77.88% | 56.23% | 67.22% |
| Bijnor | 1,921,215 | 1,761,498 | 3,682,713 | 917 | 76.56% | 59.72% | 68.48% |
| Budaun | 1,967,759 | 1,714,137 | 3,681,896 | 871 | 60.98% | 40.09% | 51.29% |
| Bulandshahr | 1,845,260 | 1,653,911 | 3,499,171 | 896 | 80.93% | 55.57% | 68.88% |
| Chandauli | 1,017,905 | 934,851 | 1,952,756 | 918 | 81.72% | 60.35% | 71.48% |
| Chitrakoot | 527,721 | 464,009 | 991,730 | 879 | 75.80% | 52.74% | 65.05% |
| Deoria | 1,537,436 | 1,563,510 | 3,100,946 | 1,017 | 83.27% | 59.38% | 71.13% |
| Etah | 947,339 | 827,141 | 1,774,480 | 873 | 81.28% | 58.80% | 70.81% |
| Etawah | 845,856 | 735,954 | 1,581,810 | 870 | 86.06% | 69.61% | 78.41% |
| Faizabad | 1,259,628 | 1,211,368 | 2,470,996 | 962 | 78.12% | 59.03% | 68.73% |
| Farrukhabad | 1,006,240 | 878,964 | 1,885,204 | 874 | 77.40% | 59.44% | 69.04% |
| Fatehpur | 1,384,722 | 1,248,011 | 2,632,733 | 901 | 77.19% | 56.58% | 67.43% |
| Firozabad | 1,332,046 | 1,166,110 | 2,498,156 | 875 | 80.82% | 61.75% | 71.92% |
| Gautam Buddha Nagar | 890,214 | 757,901 | 1,648,115 | 851 | 88.06% | 70.82% | 80.12% |
| Ghaziabad | 2,488,834 | 2,192,811 | 4,681,645 | 881 | 85.42% | 69.79% | 78.07% |
| Ghazipur | 1,855,075 | 1,765,193 | 3,620,268 | 952 | 82.80% | 60.29% | 71.78% |
| Gonda | 1,787,146 | 1,646,773 | 3,433,919 | 921 | 69.41% | 47.09% | 58.71% |
| Gorakhpur | 2,277,777 | 2,163,118 | 4,440,895 | 950 | 81.80% | 59.36% | 70.83% |
| Hamirpur | 593,537 | 510,748 | 1,104,285 | 861 | 79.76% | 55.95% | 68.77% |
| Hardoi | 2,191,442 | 1,901,403 | 4,092,845 | 868 | 74.39% | 53.19% | 64.57% |
| Jalaun | 906,092 | 783,882 | 1,689,974 | 865 | 83.48% | 62.46% | 73.75% |
| Jaunpur | 2,220,465 | 2,273,739 | 4,494,204 | 1,024 | 83.80% | 59.81% | 74% |
| Jhansi | 1,057,436 | 941,167 | 1,998,603 | 890 | 85.38% | 63.49% | 75.05% |
| Jyotiba Phule Nagar | 963,449 | 876,772 | 1,840,221 | 910 | 74.54% | 52.10% | 63.84% |
| Kannauj | 881,776 | 774,840 | 1,656,616 | 879 | 80.91% | 63.33% | 72.70% |
| Kanpur Dehat | 963,255 | 832,929 | 1,796,184 | 865 | 83.45% | 66.86% | 75.78% |
| Kanpur Nagar | 2,459,806 | 2,121,462 | 4,581,268 | 862 | 83.62% | 75.05% | 79.65% |
| Kanshiram Nagar | 764,165 | 672,554 | 1,436,719 | 880 | 71.56% | 49.00% | 61.02% |
| Kaushambi | 838,485 | 761,111 | 1,599,596 | 908 | 72.78% | 48.56% | 61.28% |
| Kheri | 2,123,187 | 1,898,056 | 4,021,243 | 894 | 69.57% | 50.42% | 60.56% |
| Kushinagar | 1,818,055 | 1,746,489 | 3,564,544 | 961 | 77.71% | 52.36% | 65.25% |
| Lalitpur | 641,011 | 580,581 | 1,221,592 | 906 | 74.98% | 50.84% | 63.52% |
| Lucknow | 2,394,476 | 2,195,362 | 4,589,838 | 917 | 82.56% | 71.54% | 77.29% |
| Mahamaya Nagar | 836,127 | 728,581 | 1,564,708 | 871 | 82.38% | 59.23% | 71.59% |
| Mahoba | 466,358 | 409,600 | 875,958 | 878 | 75.83% | 53.22% | 65.27% |
| Mahrajganj | 1,381,754 | 1,302,949 | 2,684,703 | 943 | 75.85% | 48.92% | 62.76% |
| Mainpuri | 993,377 | 875,152 | 1,868,529 | 881 | 84.53% | 66.30% | 75.99% |
| Mathura | 1,367,125 | 1,180,059 | 2,547,184 | 863 | 81.97% | 56.89% | 70.36% |
| Mau | 1,114,709 | 1,091,259 | 2,205,968 | 979 | 82.45% | 63.63% | 73.09% |
| Meerut | 1,825,743 | 1,617,946 | 3,443,689 | 886 | 80.74% | 63.98% | 72.84% |
| Mirzapur | 1,312,302 | 1,184,668 | 2,496,970 | 903 | 78.97% | 56.86% | 68.48% |
| Moradabad | 2,503,186 | 2,268,820 | 4,772,006 | 906 | 64.83% | 47.86% | 56.77% |
| Muzaffarnagar | 2,193,434 | 1,950,078 | 4,143,512 | 889 | 78.44% | 58.69% | 69.12% |
| Pilibhit | 1,072,002 | 959,005 | 2,031,007 | 895 | 71.70% | 50.00% | 61.47% |
| Pratapgarh | 1,606,085 | 1,603,056 | 3,209,141 | 998 | 81.88% | 58.45% | 70.09% |
| Rae Bareli | 1,752,542 | 1,653,017 | 3,405,559 | 943 | 77.63% | 56.29% | 67.25% |
| Rampur | 1,223,889 | 1,111,930 | 2,335,819 | 909 | 61.40% | 44.44% | 53.34% |
| Saharanpur | 1,834,106 | 1,632,276 | 3,466,382 | 890 | 78.28% | 61.74% | 70.49% |
| Sant Kabir Nagar | 869,656 | 845,527 | 1,715,183 | 972 | 78.39% | 54.80% | 66.72% |
| Sant Ravidas Nagar (Bhadohi) | 807,099 | 771,114 | 1,578,213 | 955 | 81.47% | 56.03% | 68.97% |
| Shahjahanpur | 1,606,403 | 1,400,135 | 3,006,538 | 872 | 68.18% | 49.57% | 59.54% |
| Shrawasti | 593,897 | 523,464 | 1,117,361 | 881 | 57.16% | 34.78% | 46.74% |
| Siddharthnagar | 1,295,095 | 1,264,202 | 2,559,297 | 976 | 70.92% | 47.41% | 59.25% |
| Sitapur | 2,375,264 | 2,108,728 | 4,483,992 | 888 | 70.31% | 50.67% | 61.12% |
| Sonbhadra | 971,344 | 891,215 | 1,862,559 | 918 | 74.92% | 52.14% | 64.03% |
| Sultanpur | 1,914,586 | 1,882,531 | 3,797,117 | 983 | 80.19% | 58.28% | 69.27% |
| Unnao | 1,630,087 | 1,478,280 | 3,108,367 | 907 | 75.05% | 56.76% | 66.37% |
| Varanasi | 1,921,857 | 1,754,984 | 3,676,841 | 913 | 83.78% | 66.69% | 75.60% |
| Uttar Pradesh | 104,480,510 | 95,331,831 | 199,812,341 | 912 | 77.28% | 57.18% | 67.68% |
| |||||||
Rank of districts
| Population Growth | |||
|---|---|---|---|
| Census | Population | %± | |
| 1951 | 60,274,000 | — | |
| 1961 | 70,144,000 | 16.4% | |
| 1971 | 83,849,000 | 19.5% | |
| 1981 | 105,137,000 | 25.4% | |
| 1991 | 132,062,000 | 25.6% | |
| 2001 | 166,198,000 | 25.8% | |
| 2011 | 199,581,477 | 20.1% | |
| Source:Census of India[5] | |||
Following rankings are as per Population Census 2011.[6]
By population
By population density
- Ghaziabad - 1995
- Varanasi - 1954
- Lucknow - 1456
- Sant Ravidas Nagar (Bhadohi) - 1409
- Kanpur Nagar - 1369
By literacy
- Gautam Budha Nagar(Noida) - 80.12%
- Kanpur Nagar - 79.65%
- Auraiya - 78.95%
- Etawah - 78.41%
- Ghaziabad - 78.07%
Religion
In U.P. the religion-wise percentage of population is Hindus 79.80, Muslims 19.03, Sikhs 0.32, Christians 0.18, Jains 0.11, Buddhists 0.10 while 0.29% people didn't state their religion.[6][7]
| Religion | Rural | Urban | Total |
|---|---|---|---|
| Buddhist | 0.09% | 0.02% | 0.10% |
| Christian | 0.09% | 0.09% | 0.18% |
| Hindu | 70.80% | 9.00% | 79.80 |
| Jain | 0.02% | 0.09% | 0.11% |
| Muslim | 10.64% | 8.59% | 19.23% |
| Other religions and persuasions | 0.00% | 0.00% | 0.01% |
| Religion not stated | 0.19% | 0.10% | 0.29% |
| Sikh | 0.22% | 0.11% | 0.32% |
| Grand Total | 77.73% | 22.27% | 100.00% |
Literacy among women is quite low, going as low as 50.59% in Muslim community. On the contrary, the Jain community with quite high literacy rates, for both males and females as well. Also noteworthy is that Sikh and Hindu communities have very poor sex-ratios.
| Religion |
Population |
Sex ratio |
Literacy rate | ||||
|---|---|---|---|---|---|---|---|
| Male | Female | Total | Male | Female | Total | ||
| Hindu | 83,555,724 | 75,756,930 | 159,312,654 | 907 | 79.73% | 58.61% | 69.68% |
| Muslim | 19,867,314 | 18,616,653 | 38,483,967 | 937 | 66.42% | 50.59% | 58.76% |
| Christian | 182,838 | 173,610 | 356,448 | 950 | 79.44% | 67.54% | 73.63% |
| Sikh | 341,451 | 302,049 | 643,500 | 885 | 84.91% | 73.15% | 79.35% |
| Buddhist | 107,424 | 98,861 | 206,285 | 920 | 79.19% | 57.07% | 68.59% |
| Jain | 110,994 | 102,273 | 213,267 | 921 | 95.81% | 92.16% | 94.05% |
| Other religions and persuasions | 7,070 | 6,528 | 13,598 | 923 | 80.18% | 61.30% | 71.11% |
| Religion not stated | 307,695 | 274,927 | 582,622 | 894 | 78.37% | 60.84% | 70.01% |
| Uttar Pradesh | 104,480,510 | 95,331,831 | 199,812,341 | 912 | 77.28% | 57.18% | 67.68% |
| |||||||
District-wise religious population
Population count for each district (with percentages[lower-roman 1]) as per 2011 Census.[4]
| District | Buddhist | Christian | Hindu | Jain | Muslim | Sikh | Other religions | Religion not stated | District Population | ||||||||
|---|---|---|---|---|---|---|---|---|---|---|---|---|---|---|---|---|---|
| Count | % | Count | % | Count | % | Count | % | Count | % | Count | % | Count | % | Count | % | ||
| Agra | 4,049 | 0.09% | 10,076 | 0.23% | 3,922,718 | 88.77% | 21,508 | 0.49% | 411,313 | 9.31% | 12,057 | 0.27% | 384 | 0.01% | 36,692 | 0.83% | 4,418,797 |
| Aligarh | 2,582 | 0.07% | 7,635 | 0.21% | 2,904,140 | 79.05% | 2,805 | 0.08% | 729,283 | 19.85% | 5,875 | 0.16% | 91 | 0.00% | 21,478 | 0.58% | 3,673,889 |
| Allahabad | 4,391 | 0.07% | 13,782 | 0.23% | 5,102,041 | 85.69% | 2,247 | 0.04% | 796,756 | 13.38% | 4,377 | 0.07% | 305 | 0.01% | 30,492 | 0.51% | 5,954,391 |
| Ambedkar Nagar | 1,817 | 0.08% | 2,536 | 0.11% | 1,985,654 | 82.81% | 235 | 0.01% | 401,678 | 16.75% | 869 | 0.04% | 33 | 0.00% | 5,066 | 0.21% | 2,397,888 |
| Auraiya | 332 | 0.02% | 1,004 | 0.07% | 1,273,546 | 92.32% | 228 | 0.02% | 101,963 | 7.39% | 371 | 0.03% | 444 | 0.03% | 1,657 | 0.12% | 1,379,545 |
| Azamgarh | 5,652 | 0.12% | 3,810 | 0.08% | 3,878,626 | 84.06% | 183 | 0.00% | 718,692 | 15.58% | 719 | 0.02% | 226 | 0.00% | 6,005 | 0.13% | 4,613,913 |
| Baghpat | 161 | 0.01% | 1,840 | 0.14% | 917,474 | 70.41% | 16,139 | 1.24% | 364,583 | 27.98% | 483 | 0.04% | 25 | 0.00% | 2,343 | 0.18% | 1,303,048 |
| Bahraich | 2,793 | 0.08% | 6,400 | 0.18% | 2,291,892 | 65.71% | 1,177 | 0.03% | 1,169,330 | 33.53% | 8,212 | 0.24% | 38 | 0.00% | 7,889 | 0.23% | 3,487,731 |
| Ballia | 1,595 | 0.05% | 4,463 | 0.14% | 3,004,240 | 92.73% | 233 | 0.01% | 213,440 | 6.59% | 892 | 0.03% | 64 | 0.00% | 14,847 | 0.46% | 3,239,774 |
| Balrampur | 1,866 | 0.09% | 3,228 | 0.15% | 1,333,242 | 62.05% | 198 | 0.01% | 805,975 | 37.51% | 900 | 0.04% | 87 | 0.00% | 3,169 | 0.15% | 2,148,665 |
| Banda | 168 | 0.01% | 1,367 | 0.08% | 1,637,549 | 91.00% | 916 | 0.05% | 157,612 | 8.76% | 231 | 0.01% | 50 | 0.00% | 1,517 | 0.08% | 1,799,410 |
| Bara Banki | 1,553 | 0.05% | 4,857 | 0.15% | 2,505,444 | 76.84% | 3,016 | 0.09% | 737,106 | 22.61% | 2,090 | 0.06% | 211 | 0.01% | 6,422 | 0.20% | 3,260,699 |
| Bareilly | 4,371 | 0.10% | 14,822 | 0.33% | 2,830,768 | 63.64% | 931 | 0.02% | 1,536,534 | 34.54% | 28,187 | 0.63% | 339 | 0.01% | 32,407 | 0.73% | 4,448,359 |
| Basti | 9,753 | 0.40% | 3,493 | 0.14% | 2,082,976 | 84.52% | 107 | 0.00% | 364,510 | 14.79% | 900 | 0.04% | 99 | 0.00% | 2,626 | 0.11% | 2,464,464 |
| Bijnor | 1,736 | 0.05% | 6,184 | 0.17% | 2,032,081 | 55.18% | 2,134 | 0.06% | 1,585,210 | 43.04% | 50,624 | 1.37% | 41 | 0.00% | 4,703 | 0.13% | 3,682,713 |
| Budaun | 1,959 | 0.05% | 6,320 | 0.17% | 2,867,707 | 77.89% | 678 | 0.02% | 790,515 | 21.47% | 1,135 | 0.03% | 87 | 0.00% | 13,495 | 0.37% | 3,681,896 |
| Bulandshahr | 669 | 0.02% | 4,088 | 0.12% | 2,707,195 | 77.37% | 1,572 | 0.04% | 777,407 | 22.22% | 2,765 | 0.08% | 86 | 0.00% | 5,389 | 0.15% | 3,499,171 |
| Chandauli | 340 | 0.02% | 2,153 | 0.11% | 1,727,869 | 88.48% | 100 | 0.01% | 215,081 | 11.01% | 1,389 | 0.07% | 1,175 | 0.06% | 4,649 | 0.24% | 1,952,756 |
| Chitrakoot | 101 | 0.01% | 693 | 0.07% | 955,372 | 96.33% | 285 | 0.03% | 34,559 | 3.48% | 63 | 0.01% | 27 | 0.00% | 630 | 0.06% | 991,730 |
| Deoria | 1,182 | 0.04% | 3,626 | 0.12% | 2,730,957 | 88.07% | 209 | 0.01% | 358,539 | 11.56% | 818 | 0.03% | 146 | 0.00% | 5,469 | 0.18% | 3,100,946 |
| Etah | 2,887 | 0.16% | 2,464 | 0.14% | 1,611,126 | 90.79% | 5,671 | 0.32% | 146,346 | 8.25% | 708 | 0.04% | 18 | 0.00% | 5,260 | 0.30% | 1,774,480 |
| Etawah | 1,733 | 0.11% | 1,362 | 0.09% | 1,457,892 | 92.17% | 3,917 | 0.25% | 113,961 | 7.20% | 1,045 | 0.07% | 94 | 0.01% | 1,806 | 0.11% | 1,581,810 |
| Faizabad | 737 | 0.03% | 3,225 | 0.13% | 2,094,271 | 84.75% | 358 | 0.01% | 365,806 | 14.80% | 1,912 | 0.08% | 185 | 0.01% | 4,502 | 0.18% | 2,470,996 |
| Farrukhabad | 3,161 | 0.17% | 3,137 | 0.17% | 1,596,278 | 84.67% | 487 | 0.03% | 276,846 | 14.69% | 3,160 | 0.17% | 100 | 0.01% | 2,035 | 0.11% | 1,885,204 |
| Fatehpur | 172 | 0.01% | 2,201 | 0.08% | 2,274,674 | 86.40% | 199 | 0.01% | 350,700 | 13.32% | 402 | 0.02% | 47 | 0.00% | 4,338 | 0.16% | 2,632,733 |
| Firozabad | 3,395 | 0.14% | 3,370 | 0.13% | 2,140,745 | 85.69% | 19,077 | 0.76% | 314,812 | 12.60% | 1,804 | 0.07% | 61 | 0.00% | 14,892 | 0.60% | 2,498,156 |
| Gautam Buddha Nagar | 895 | 0.05% | 7,366 | 0.45% | 1,394,025 | 84.58% | 4,518 | 0.27% | 215,500 | 13.08% | 9,261 | 0.56% | 91 | 0.01% | 16,459 | 1.00% | 1,648,115 |
| Ghaziabad | 3,487 | 0.07% | 19,026 | 0.41% | 3,414,427 | 72.93% | 16,412 | 0.35% | 1,186,776 | 25.35% | 23,001 | 0.49% | 265 | 0.01% | 18,251 | 0.39% | 4,681,645 |
| Ghazipur | 3,145 | 0.09% | 4,181 | 0.12% | 3,233,790 | 89.32% | 213 | 0.01% | 368,153 | 10.17% | 810 | 0.02% | 184 | 0.01% | 9,792 | 0.27% | 3,620,268 |
| Gonda | 649 | 0.02% | 4,735 | 0.14% | 2,739,076 | 79.77% | 338 | 0.01% | 678,615 | 19.76% | 1,893 | 0.06% | 57 | 0.00% | 8,556 | 0.25% | 3,433,919 |
| Gorakhpur | 2,848 | 0.06% | 9,662 | 0.22% | 4,009,037 | 90.28% | 460 | 0.01% | 403,847 | 9.09% | 2,123 | 0.05% | 207 | 0.00% | 12,711 | 0.29% | 4,440,895 |
| Hamirpur | 74 | 0.01% | 814 | 0.07% | 1,010,014 | 91.46% | 41 | 0.00% | 91,269 | 8.26% | 196 | 0.02% | 273 | 0.02% | 1,604 | 0.15% | 1,104,285 |
| Hardoi | 6,671 | 0.16% | 5,822 | 0.14% | 3,508,131 | 85.71% | 446 | 0.01% | 556,219 | 13.59% | 5,688 | 0.14% | 98 | 0.00% | 9,770 | 0.24% | 4,092,845 |
| Jalaun | 2,875 | 0.17% | 1,148 | 0.07% | 1,509,708 | 89.33% | 256 | 0.02% | 171,581 | 10.15% | 463 | 0.03% | 145 | 0.01% | 3,798 | 0.22% | 1,689,974 |
| Jaunpur | 7,898 | 0.18% | 4,947 | 0.11% | 3,981,502 | 88.59% | 349 | 0.01% | 483,750 | 10.76% | 1,286 | 0.03% | 114 | 0.00% | 14,358 | 0.32% | 4,494,204 |
| Jhansi | 1,203 | 0.06% | 7,050 | 0.35% | 1,823,930 | 91.26% | 7,328 | 0.37% | 147,842 | 7.40% | 4,951 | 0.25% | 311 | 0.02% | 5,988 | 0.30% | 1,998,603 |
| Jyotiba Phule Nagar | 189 | 0.01% | 5,952 | 0.32% | 1,075,440 | 58.44% | 517 | 0.03% | 750,368 | 40.78% | 5,295 | 0.29% | 21 | 0.00% | 2,439 | 0.13% | 1,840,221 |
| Kannauj | 2,033 | 0.12% | 1,263 | 0.08% | 1,375,788 | 83.05% | 606 | 0.04% | 273,967 | 16.54% | 504 | 0.03% | 65 | 0.00% | 2,390 | 0.14% | 1,656,616 |
| Kanpur Dehat | 819 | 0.05% | 1,300 | 0.07% | 1,612,968 | 89.80% | 155 | 0.01% | 176,327 | 9.82% | 478 | 0.03% | 103 | 0.01% | 4,034 | 0.22% | 1,796,184 |
| Kanpur Nagar | 2,733 | 0.06% | 15,751 | 0.34% | 3,792,174 | 82.78% | 5,710 | 0.12% | 720,660 | 15.73% | 29,676 | 0.65% | 589 | 0.01% | 13,975 | 0.31% | 4,581,268 |
| Kanshiram Nagar | 3,907 | 0.27% | 1,969 | 0.14% | 1,211,427 | 84.32% | 313 | 0.02% | 213,822 | 14.88% | 2,280 | 0.16% | 72 | 0.01% | 2,929 | 0.20% | 1,436,719 |
| Kaushambi | 687 | 0.04% | 2,225 | 0.14% | 1,372,381 | 85.80% | 545 | 0.03% | 220,423 | 13.78% | 522 | 0.03% | 3 | 0.00% | 2,810 | 0.18% | 1,599,596 |
| Kheri | 18,454 | 0.46% | 7,502 | 0.19% | 3,078,262 | 76.55% | 487 | 0.01% | 807,600 | 20.08% | 94,388 | 2.35% | 226 | 0.01% | 14,324 | 0.36% | 4,021,243 |
| Kushinagar | 4,619 | 0.13% | 5,006 | 0.14% | 2,928,462 | 82.16% | 383 | 0.01% | 620,244 | 17.40% | 767 | 0.02% | 133 | 0.00% | 4,930 | 0.14% | 3,564,544 |
| Lalitpur | 69 | 0.01% | 1,351 | 0.11% | 1,163,804 | 95.27% | 20,390 | 1.67% | 33,724 | 2.76% | 1,034 | 0.08% | 41 | 0.00% | 1,179 | 0.10% | 1,221,592 |
| Lucknow | 3,877 | 0.08% | 20,493 | 0.45% | 3,537,787 | 77.08% | 4,975 | 0.11% | 985,070 | 21.46% | 23,883 | 0.52% | 504 | 0.01% | 13,249 | 0.29% | 4,589,838 |
| Mahamaya Nagar | 424 | 0.03% | 1,350 | 0.09% | 1,397,225 | 89.30% | 1,289 | 0.08% | 159,448 | 10.19% | 524 | 0.03% | 63 | 0.00% | 4,385 | 0.28% | 1,564,708 |
| Mahoba | 94 | 0.01% | 965 | 0.11% | 815,142 | 93.06% | 234 | 0.03% | 57,454 | 6.56% | 389 | 0.04% | 157 | 0.02% | 1,523 | 0.17% | 875,958 |
| Mahrajganj | 16,030 | 0.60% | 3,527 | 0.13% | 2,196,884 | 81.83% | 243 | 0.01% | 458,650 | 17.08% | 1,381 | 0.05% | 338 | 0.01% | 7,650 | 0.28% | 2,684,703 |
| Mainpuri | 8,814 | 0.47% | 1,729 | 0.09% | 1,746,649 | 93.48% | 4,161 | 0.22% | 100,723 | 5.39% | 475 | 0.03% | 38 | 0.00% | 5,940 | 0.32% | 1,868,529 |
| Mathura | 883 | 0.03% | 3,179 | 0.12% | 2,310,776 | 90.72% | 2,056 | 0.08% | 216,933 | 8.52% | 2,872 | 0.11% | 126 | 0.00% | 10,359 | 0.41% | 2,547,184 |
| Mau | 564 | 0.03% | 2,109 | 0.10% | 1,769,937 | 80.23% | 155 | 0.01% | 428,555 | 19.43% | 340 | 0.02% | 129 | 0.01% | 4,179 | 0.19% | 2,205,968 |
| Meerut | 1,855 | 0.05% | 10,582 | 0.31% | 2,183,255 | 63.40% | 18,544 | 0.54% | 1,185,643 | 34.43% | 24,912 | 0.72% | 236 | 0.01% | 18,662 | 0.54% | 3,443,689 |
| Mirzapur | 341 | 0.01% | 2,373 | 0.10% | 2,292,534 | 91.81% | 701 | 0.03% | 195,765 | 7.84% | 1,133 | 0.05% | 27 | 0.00% | 4,096 | 0.16% | 2,496,970 |
| Moradabad | 1,260 | 0.03% | 13,157 | 0.28% | 2,488,265 | 52.14% | 2,426 | 0.05% | 2,248,392 | 47.12% | 7,555 | 0.16% | 382 | 0.01% | 10,569 | 0.22% | 4,772,006 |
| Muzaffarnagar | 1,516 | 0.04% | 6,495 | 0.16% | 2,382,914 | 57.51% | 16,345 | 0.39% | 1,711,453 | 41.30% | 18,601 | 0.45% | 60 | 0.00% | 6,128 | 0.15% | 4,143,512 |
| Pilibhit | 360 | 0.02% | 3,510 | 0.17% | 1,449,007 | 71.34% | 138 | 0.01% | 489,686 | 24.11% | 84,787 | 4.17% | 45 | 0.00% | 3,474 | 0.17% | 2,031,007 |
| Pratapgarh | 7,795 | 0.24% | 3,920 | 0.12% | 2,731,351 | 85.11% | 746 | 0.02% | 452,394 | 14.10% | 1,451 | 0.05% | 43 | 0.00% | 11,441 | 0.36% | 3,209,141 |
| Rae Bareli | 722 | 0.02% | 3,634 | 0.11% | 2,975,998 | 87.39% | 397 | 0.01% | 413,243 | 12.13% | 2,424 | 0.07% | 602 | 0.02% | 8,539 | 0.25% | 3,405,559 |
| Rampur | 384 | 0.02% | 9,201 | 0.39% | 1,073,890 | 45.97% | 1,307 | 0.06% | 1,181,337 | 50.57% | 65,316 | 2.80% | 63 | 0.00% | 4,321 | 0.18% | 2,335,819 |
| Saharanpur | 1,937 | 0.06% | 6,523 | 0.19% | 1,966,892 | 56.74% | 10,208 | 0.29% | 1,454,052 | 41.95% | 18,627 | 0.54% | 135 | 0.00% | 8,008 | 0.23% | 3,466,382 |
| Sant Kabir Nagar | 4,393 | 0.26% | 1,766 | 0.10% | 1,300,586 | 75.83% | 95 | 0.01% | 404,410 | 23.58% | 447 | 0.03% | 35 | 0.00% | 3,451 | 0.20% | 1,715,183 |
| Sant Ravidas Nagar (Bhadohi) | 1,562 | 0.10% | 1,365 | 0.09% | 1,368,291 | 86.70% | 161 | 0.01% | 203,887 | 12.92% | 199 | 0.01% | 7 | 0.00% | 2,741 | 0.17% | 1,578,213 |
| Shahjahanpur | 2,312 | 0.08% | 4,630 | 0.15% | 2,412,595 | 80.24% | 301 | 0.01% | 527,581 | 17.55% | 51,090 | 1.70% | 84 | 0.00% | 7,945 | 0.26% | 3,006,538 |
| Shrawasti | 323 | 0.03% | 1,427 | 0.13% | 768,643 | 68.79% | 68 | 0.01% | 343,981 | 30.79% | 407 | 0.04% | 56 | 0.01% | 2,456 | 0.22% | 1,117,361 |
| Siddharthnagar | 11,964 | 0.47% | 3,042 | 0.12% | 1,789,704 | 69.93% | 179 | 0.01% | 748,073 | 29.23% | 681 | 0.03% | 356 | 0.01% | 5,298 | 0.21% | 2,559,297 |
| Sitapur | 2,663 | 0.06% | 6,579 | 0.15% | 3,555,450 | 79.29% | 1,410 | 0.03% | 893,725 | 19.93% | 11,611 | 0.26% | 79 | 0.00% | 12,475 | 0.28% | 4,483,992 |
| Sonbhadra | 1,747 | 0.09% | 3,963 | 0.21% | 1,738,769 | 93.35% | 487 | 0.03% | 103,567 | 5.56% | 1,649 | 0.09% | 1,907 | 0.10% | 10,470 | 0.56% | 1,862,559 |
| Sultanpur | 9,989 | 0.26% | 4,453 | 0.12% | 3,119,590 | 82.16% | 426 | 0.01% | 650,261 | 17.13% | 1,629 | 0.04% | 336 | 0.01% | 10,433 | 0.27% | 3,797,117 |
| Unnao | 920 | 0.03% | 3,574 | 0.11% | 2,732,016 | 87.89% | 240 | 0.01% | 363,453 | 11.69% | 1,204 | 0.04% | 31 | 0.00% | 6,929 | 0.22% | 3,108,367 |
| Varanasi | 1,146 | 0.03% | 7,696 | 0.21% | 3,107,681 | 84.52% | 1,898 | 0.05% | 546,987 | 14.88% | 3,309 | 0.09% | 298 | 0.01% | 7,826 | 0.21% | 3,676,841 |
| STATE[lower-roman 2] | 206,285 | 0.10% | 356,448 | 0.18% | 159,312,654 | 79.73% | 213,267 | 0.11% | 38,483,967 | 19.26% | 643,500 | 0.32% | 13,598 | 0.01% | 582,622 | 0.29% | 199,812,341 |
| |||||||||||||||||
Caste
As per 2011 census, Dalits constitute 21.1% of Uttar Pradesh population.[8][9][10] Mallah community is divided in 27 sub-castes. Other Backward Classes (OBCs) constitute 40% of Uttar Pradesh’s population.[11][12][13][14] Yadavs form the single largest group amongst the OBCs, with around 20% population.[15] There are 200-odd OBCs in U.P. In Uttar Pradesh, Muslims are divided into 68 castes and sub-castes, 35 of them are OBCs. Forward castes constitute around 18–20% of Uttar Pradesh population,[16][17] in which Brahmins are 12–14%[18] and Thakurs are 7–8%.[18] For accurate caste population data in India, Government of India has not publicly released Socio Economic and Caste Census 2011 caste population data for every single non-SC/ST castes (General castes, OBC/EBCs) in India.[19][20][21][22][23]
| Castes of Uttar Pradesh[24][25][26][27][28][29] | ||
|---|---|---|
| Caste | Population (%) | |
| OBC | 40% | |
| Dalits(SCs) | 20.8% | |
| Tribals(STs) | 0.1% | |
| Forward caste | 23% | |
| Muslims | 19% | |
| Others | 0.9% | |
Racial and ancestral makeup
Uttar Pradesh is the most populous state in India with a population of over 199.5 million people on 1 March 2011. It is more populated than the world's 242 countries. If independent it would be the 6th largest country in the world as per Population. At the 2001 census of India, about 80% of Uttar Pradesh population is Hindu, while Muslims make up around 18% of the population, most of whom are ethnic Pathans. The remaining population consists of Sikhs, Buddhists, Christians and Jains.
The population of Uttar Pradesh is divided into numerous castes and sub-castes. Historically, Hindu society is divided into four sub-divisions or varnas, the Brahmins, Kshatriyas, Vaishyas and Shudras. Muslims are also divided as the Shias and Sunnis. In actual practice, Hindu society in generally used to be divided into numerous lineage groups called jatis. Each jati is then sub-divided into clans, called gotras.
The peripheral regions of Uttar Pradesh, are home to a number of tribal communities such as Agaria, Baiga, Bhar, Bhoksa, Chero, Gond, Kol and Korwa. Five of these tribal communities have been recognised by the Government of India as disadvantaged scheduled tribes, viz. Tharus, Boksas, Bhotias, Jaunswaris and Rajis.[3]
Languages
Most people in Uttar Pradesh speak Hindustani, which in a literate form is referred to as Hindi and Urdu.
In addition, the people of Uttar Pradesh speak a variety of local dialects of Hindi, which are not always easy to classify or identify. E.g., the language of Allahabad is often classified today as Awadhi, but, its actually a mix of several surrounding dialects, including Awadhi and Bundelkhandi. Most Allahabadis refer to their dialect as Allahabadi. Furthermore, in neighbouring Banda, the dialect is exactly the same, but, they refer to it as Bundelkhandi.
It's said that in India, the dialects change every 50-mile, and its particularly true of Uttar Pradesh.
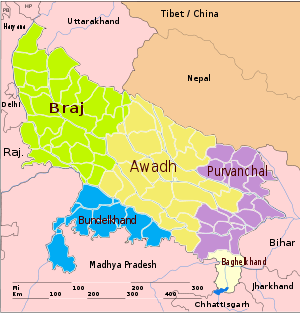
The dialect map of Uttar Pradesh is complex, but, in general, in three of the five sub regions of UP, viz, the Doab, Rohilkhand, and Bundelkhand, both Western and Eastern Hindi, as well as a mixture of the two are spoken. E.g., in Upper and parts of lower Doab (till Etawah), various forms of western Hindi are spoken, including Khari boli and Brij Bhasha. In the rest of lower Doab, various mixes of western and Eastern Hindi (Brij Bhasha/ Bundelkhandi and Awadhi) are spoken). Likewise, in Western Bundelkhand, Bundeli (a language closely related with Brij Bhasha) is spoken, while in Eastern Bundelkhand the dialect is still called 'Bundeli' but is part of Eastern Hindi (actually a mixture of Western and Eastern Hindi). In Western Rohilkhand, Khari boli is spoken. in Central Rohilkhand a mix of Awadhi and Khari boli is spoken, while in Eastern Rohilkhand, Awadhi is the dialect.
In the other two sub-regions of UP, viz., Awadh and Purvanchal too, there exist a wide variation in the dialects spoken. Awadhi is the main dialect in the Awadh sub-region of Uttar Pradesh. But, its form changes from west to east. In western Purvanchal, Eastern Hindi (Awadhi) is spoken, while in districts adjoining Bihar, Bhojpuri, also known as Bihari language is spoken. In southern Purvanchal, Baghelkhandi (a form of Eastern Hindi) is the predominant dialect.
As mentioned earlier, often these dialects merge into each other, for example in Shahjahanpur, in Rohilkhand, Khari boli merges into Awadhi.[30]
Likewise, older districts of Basti, Jaunpur, and western Mirzapur in Purvanchal and Shahjehanpur, Pilbhit, Eastern Badayun and Eastern Farrukhabad in central UP are Awadhi speaking.
See also
References
- ORGI. "Census of India Website : Office of the Registrar General & Census Commissioner, India". www.censusindia.gov.in. Retrieved 14 February 2018.
- "North India and south Pakistan". 23 March 2012.
- People of India Uttar Pradesh Volume XLII edited by A Hasan & J C Das, Manohar Publications
- "Religion PCA - State wise".
- "Archived copy" (PDF). Archived from the original (PDF) on 9 April 2011. Retrieved 2011-04-07.CS1 maint: archived copy as title (link)
- "List of districts of Uttar Pradesh".
- C1 - Population by religious community, Uttar Pradesh. Census India 2017. Retrieved 14 February 2018.
- Shailvee Sharda. "Job better than aid, say UP dalits". The Times of India. Retrieved 6 July 2016.
- "UP polls: Why is BJP hesitating in announcing its CM candidate?". Indiatvnews.com. 16 June 2016. Retrieved 6 July 2016.
- "Half of India's dalit population lives in 4 states". The Times of India.
- "UP has the highest OBC population in all Indian states".
- "Why smaller castes could hold the key to power in 2017 UP Assembly polls". 29 December 2016.
- "Survey puts OBC population at 40 pc". 3 September 2007.
- "OBC population in UP stands at 7 crore".
- "UP ke votebank".
- "Why the most backward castes are crucial for BJP's sandwich alliance to succeed in Uttar Pradesh".
- "Uttar Pradesh polls: BSP, SP and BJP leaving no stone to come up trumps".
- Hebbar, Nistula (3 May 2019). "BJP striving to please Rajputs and Brahmins". The Hindu. ISSN 0971-751X. Retrieved 3 June 2019.
- "'Centre not releasing caste census data because it doesn't want to face Mandal II'". Thehindubusinessline.com. Retrieved 6 July 2016.
- "Centre releases census data on religion, hides caste figures". Dnaindia.com. 26 August 2015. Retrieved 6 July 2016.
- "Before releasing caste numbers, the government needs to account for discrepancies in data". Scroll.in. Retrieved 6 July 2016.
- "Why Is Modi Govt. Hiding Socio-Economic Caste Census 2011 Data?". Youthkiawaaz.com. March 2016. Retrieved 6 July 2016.
- "Caste-based Census data should be made public, demand Bihar CM Nitish Kumar". The Hindu. 24 June 2016. Retrieved 6 July 2016.
- "How BJP is changing the caste arithmetic in Uttar Pradesh | Latest News & Updates at Daily News & Analysis". Dnaindia.com. 1 May 2014. Retrieved 8 March 2017.
- "Archived copy". Archived from the original on 8 March 2016. Retrieved 2016-02-15.CS1 maint: archived copy as title (link)
- "The Scramble For Dalit Votes in Uttar Pradesh". Swarajyamag.com. 3 February 2016. Retrieved 8 March 2017.
- "UP govt declares holiday on Maharana Pratap Jayanti to 'woo' Thakur voters". English.pradesh18.com. 8 May 2015. Retrieved 8 March 2017.
- "Brahmins population in India".
- "Uttar Pradesh Assembly Elections 2017 | Indian National Congress | AAP | BJP | NDA | Samajwadi Party | Candidates List | Opinion Poll | Exit Poll | Election News Malayalam". Manoramaonline.com. Archived from the original on 19 May 2017. Retrieved 8 March 2017.
- People of India: Uttar Pradesh Volume XLII Part One edited by A Hasan & J C Das pages 21 to 23 Manohar Publications