1968 United States presidential election in Alabama
The United States presidential election in Alabama, 1968 was held on November 5, 1968.
| |||||||||||||||||||||||||||||||||
All 10 Alabama electoral votes to the Electoral College | |||||||||||||||||||||||||||||||||
|---|---|---|---|---|---|---|---|---|---|---|---|---|---|---|---|---|---|---|---|---|---|---|---|---|---|---|---|---|---|---|---|---|---|
| |||||||||||||||||||||||||||||||||
 County results
| |||||||||||||||||||||||||||||||||
| |||||||||||||||||||||||||||||||||

| Elections in Alabama | ||||||||
|---|---|---|---|---|---|---|---|---|
 | ||||||||
|
||||||||
|
||||||||
|
| ||||||||
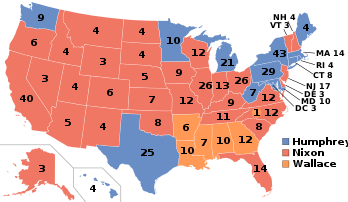
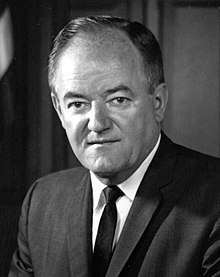
Southern segregationist candidate George Wallace, the former Governor of Alabama running as a third party candidate with his American Independent Party, won his home state in a high margin. Wallace received the official Democratic Party ballot line in Alabama, while national Democratic Party nominee Hubert H. Humphrey was forced to run on a fusion ticket of "Alabama Independent Democrat" and the National Democratic party ballot line.[1]
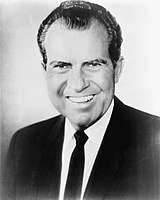
Wallace won 65.86% to Democrat Hubert Humphrey's 18.72%, a 47.13% margin. Republican Richard Nixon, while narrowly winning the election nationally, finished a distant third in Alabama with only 13.99%, receiving significant support only in a few northern counties with historically significant GOP votes, and in higher-income urban areas.[2] Wallace's 65.86% of the popular vote would make Alabama not only his best performing state in the 1968 election, but the strongest performing state out of any candidate, with only Washington DC being stronger.[3]
Wallace won 64 of the state's 67 counties. As African-Americans in the South were slowly gaining the right to vote as a result of federal civil rights legislation passed in 1964 and 1965, Wallace's weakest region was Alabama’s Black Belt, where he won most counties with narrow majorities or pluralities.[4] He lost three counties in this region, Sumter County, Greene County, and Macon County, all with majority black populations, to pro-civil rights candidate Hubert Humphrey. In black-majority Macon County, pro-civil rights Democrat Hubert Humphrey won a commanding landslide, taking 69.7% of the vote to Wallace's 25.4%, reflecting the deep divide between the state's white and black voter populations. As of the 2016 presidential election, this is the last election in which Mobile County, Shelby County, Baldwin County, Lee County, and Houston County were not carried by the Republican candidate[5] and the last election in which Wilcox County, Lowndes County, and Bullock County were not carried by the national Democratic candidate.[5]
Results
| Party | Nominee | Popular Vote | Percentage | Electoral Vote |
|---|---|---|---|---|
| Democratic (American Independent) |
George Wallace | 691,425 | 65.86% | 10 |
| Alabama Independent Democrat/ National Democratic (Democratic) |
Hubert Humphrey | 196,597 | 18.72% | 0 |
| Republican | Richard Nixon | 146,923 | 13.99% | 0 |
| American Independent | No Candidate | 10,960 | 1.04% | 0 |
| E. Harold Munn | Prohibition | 4,02 | 0.38% | 0 |
| Write-ins | — | 8 | 0.00% | 0 |
Results by county
| County | George Corley Wallace Democratic |
Richard Milhous Nixon Republican |
Hubert Horatio Humphrey Alabama Independent Democrat |
Various candidates Other parties |
Margin[lower-alpha 2] | Total votes cast[6] | |||||
|---|---|---|---|---|---|---|---|---|---|---|---|
| # | % | # | % | # | % | # | % | # | % | ||
| Autauga | 5,523 | 71.03% | 606 | 7.79% | 1,553 | 19.97% | 94 | 1.21% | 3,970 | 51.06% | 7,776 |
| Baldwin | 14,167 | 76.98% | 2,154 | 11.70% | 1,821 | 9.89% | 262 | 1.42% | 12,013[lower-alpha 3] | 65.28% | 18,404 |
| Barbour | 5,491 | 69.10% | 386 | 4.86% | 1,898 | 23.89% | 171 | 2.15% | 3,593 | 45.21% | 7,946 |
| Bibb | 3,746 | 80.16% | 263 | 5.63% | 652 | 13.95% | 12 | 0.26% | 3,094 | 66.21% | 4,673 |
| Blount | 6,536 | 71.93% | 2,013 | 22.15% | 331 | 3.64% | 206 | 2.27% | 4,523[lower-alpha 3] | 49.78% | 9,086 |
| Bullock | 2,161 | 49.71% | 190 | 4.37% | 1,964 | 45.18% | 32 | 0.74% | 197 | 4.53% | 4,347 |
| Butler | 5,601 | 76.09% | 500 | 6.79% | 1,240 | 16.85% | 20 | 0.27% | 4,361 | 59.24% | 7,361 |
| Calhoun | 19,211 | 71.75% | 3,061 | 11.43% | 4,146 | 15.48% | 357 | 1.33% | 15,065 | 56.27% | 26,775 |
| Chambers | 7,885 | 74.14% | 1,082 | 10.17% | 1,358 | 12.77% | 311 | 2.92% | 6,527 | 61.37% | 10,636 |
| Cherokee | 4,773 | 83.96% | 343 | 6.03% | 462 | 8.13% | 107 | 1.88% | 4,311 | 75.83% | 5,685 |
| Chilton | 6,611 | 74.26% | 1,602 | 18.00% | 566 | 6.36% | 123 | 1.38% | 5,009[lower-alpha 3] | 56.26% | 8,902 |
| Choctaw | 4,250 | 69.75% | 176 | 2.89% | 1,641 | 26.93% | 26 | 0.43% | 2,609 | 42.82% | 6,093 |
| Clarke | 6,168 | 71.50% | 488 | 5.66% | 1,717 | 19.90% | 253 | 2.93% | 4,451 | 51.60% | 8,626 |
| Clay | 4,048 | 80.25% | 706 | 14.00% | 256 | 5.08% | 34 | 0.67% | 3,342[lower-alpha 3] | 66.25% | 5,044 |
| Cleburne | 3,314 | 82.95% | 485 | 12.14% | 160 | 4.01% | 36 | 0.90% | 2,829[lower-alpha 3] | 70.81% | 3,995 |
| Coffee | 8,885 | 82.53% | 682 | 6.33% | 1,071 | 9.95% | 128 | 1.19% | 7,814 | 72.58% | 10,766 |
| Colbert | 11,341 | 72.60% | 1,727 | 11.06% | 2,291 | 14.67% | 262 | 1.68% | 9,050 | 57.93% | 15,621 |
| Conecuh | 3,828 | 71.60% | 186 | 3.48% | 1,151 | 21.53% | 181 | 3.39% | 2,677 | 50.07% | 5,346 |
| Coosa | 2,830 | 74.26% | 330 | 8.66% | 623 | 16.35% | 28 | 0.73% | 2,207 | 57.91% | 3,811 |
| Covington | 11,419 | 86.98% | 831 | 6.33% | 791 | 6.03% | 87 | 0.66% | 10,588[lower-alpha 3] | 80.65% | 13,128 |
| Crenshaw | 4,513 | 82.35% | 209 | 3.81% | 726 | 13.25% | 32 | 0.58% | 3,787 | 69.10% | 5,480 |
| Cullman | 11,063 | 64.08% | 4,964 | 28.75% | 1,115 | 6.46% | 123 | 0.71% | 6,099[lower-alpha 3] | 35.33% | 17,265 |
| Dale | 8,109 | 83.55% | 607 | 6.25% | 862 | 8.88% | 127 | 1.31% | 7,247 | 74.67% | 9,705 |
| Dallas | 8,798 | 52.89% | 1,246 | 7.49% | 6,516 | 39.17% | 76 | 0.46% | 2,282 | 13.72% | 16,636 |
| DeKalb | 8,144 | 54.81% | 5,314 | 35.76% | 1,274 | 8.57% | 127 | 0.85% | 2,830[lower-alpha 3] | 19.05% | 14,859 |
| Elmore | 9,038 | 76.52% | 801 | 6.78% | 1,745 | 14.77% | 228 | 1.93% | 7,293 | 61.75% | 11,812 |
| Escambia | 8,474 | 78.72% | 680 | 6.32% | 1,492 | 13.86% | 119 | 1.11% | 6,982 | 64.86% | 10,765 |
| Etowah | 21,416 | 68.67% | 4,351 | 13.95% | 4,613 | 14.79% | 806 | 2.58% | 16,803 | 53.88% | 31,186 |
| Fayette | 4,683 | 75.07% | 827 | 13.26% | 676 | 10.84% | 52 | 0.83% | 3,856[lower-alpha 3] | 61.81% | 6,238 |
| Franklin | 5,909 | 64.96% | 2,524 | 27.75% | 588 | 6.46% | 75 | 0.82% | 3,385[lower-alpha 3] | 37.21% | 9,096 |
| Geneva | 7,871 | 91.73% | 284 | 3.31% | 380 | 4.43% | 46 | 0.54% | 7,491 | 87.30% | 8,581 |
| Greene | 1,555 | 39.18% | 180 | 4.54% | 2,229 | 56.16% | 5 | 0.13% | -674 | -16.98% | 3,969 |
| Hale | 2,934 | 55.78% | 266 | 5.06% | 2,003 | 38.08% | 57 | 1.08% | 931 | 17.70% | 5,260 |
| Henry | 4,233 | 79.99% | 84 | 1.59% | 955 | 18.05% | 20 | 0.38% | 3,278 | 61.94% | 5,292 |
| Houston | 13,872 | 83.89% | 974 | 5.89% | 1,488 | 9.00% | 202 | 1.22% | 12,384 | 74.89% | 16,536 |
| Jackson | 8,504 | 77.96% | 1,191 | 10.92% | 1,022 | 9.37% | 191 | 1.75% | 7,313[lower-alpha 3] | 67.04% | 10,908 |
| Jefferson | 106,233 | 51.81% | 39,752 | 19.39% | 55,845 | 27.24% | 3,203 | 1.56% | 50,388 | 24.57% | 205,033 |
| Lamar | 5,229 | 88.25% | 364 | 6.14% | 302 | 5.10% | 30 | 0.51% | 4,865[lower-alpha 3] | 82.11% | 5,925 |
| Lauderdale | 13,467 | 71.32% | 2,952 | 15.63% | 2,166 | 11.47% | 298 | 1.58% | 10,515[lower-alpha 3] | 55.69% | 18,883 |
| Lawrence | 6,253 | 83.05% | 580 | 7.70% | 650 | 8.63% | 46 | 0.61% | 5,603 | 74.42% | 7,529 |
| Lee | 7,721 | 58.78% | 2,366 | 18.01% | 2,803 | 21.34% | 246 | 1.87% | 4,918 | 37.44% | 13,136 |
| Limestone | 8,430 | 81.25% | 870 | 8.39% | 889 | 8.57% | 186 | 1.79% | 7,541 | 72.68% | 10,375 |
| Lowndes | 1,822 | 55.84% | 234 | 7.17% | 1,127 | 34.54% | 80 | 2.45% | 695 | 21.30% | 3,263 |
| Macon | 1,619 | 25.37% | 257 | 4.03% | 4,450 | 69.74% | 55 | 0.86% | -2,831 | -44.37% | 6,381 |
| Madison | 29,823 | 57.40% | 13,213 | 25.43% | 8,004 | 15.41% | 913 | 1.76% | 16,610[lower-alpha 3] | 31.97% | 51,953 |
| Marengo | 5,185 | 56.64% | 457 | 4.99% | 3,479 | 38.01% | 33 | 0.36% | 1,706 | 18.63% | 9,154 |
| Marion | 6,415 | 76.34% | 1,492 | 17.76% | 365 | 4.34% | 131 | 1.56% | 4,923[lower-alpha 3] | 58.58% | 8,403 |
| Marshall | 12,742 | 76.39% | 2,725 | 16.34% | 955 | 5.73% | 258 | 1.55% | 10,017[lower-alpha 3] | 60.05% | 16,680 |
| Mobile | 61,673 | 67.08% | 10,509 | 11.43% | 18,615 | 20.25% | 1,139 | 1.24% | 43,058 | 46.83% | 91,936 |
| Monroe | 5,217 | 71.23% | 375 | 5.12% | 1,673 | 22.84% | 59 | 0.81% | 3,544 | 48.39% | 7,324 |
| Montgomery | 27,202 | 58.47% | 6,746 | 14.50% | 12,088 | 25.98% | 489 | 1.05% | 15,114 | 32.49% | 46,525 |
| Morgan | 16,841 | 75.60% | 3,043 | 13.66% | 1,878 | 8.43% | 515 | 2.31% | 13,798[lower-alpha 3] | 61.94% | 22,277 |
| Perry | 2,768 | 49.85% | 308 | 5.55% | 2,457 | 44.25% | 20 | 0.36% | 311 | 5.60% | 5,553 |
| Pickens | 4,549 | 71.89% | 321 | 5.07% | 1,434 | 22.66% | 24 | 0.38% | 3,115 | 49.23% | 6,328 |
| Pike | 6,038 | 72.39% | 658 | 7.89% | 1,565 | 18.76% | 80 | 0.96% | 4,473 | 53.63% | 8,341 |
| Randolph | 5,103 | 75.00% | 839 | 12.33% | 666 | 9.79% | 196 | 2.88% | 4,264[lower-alpha 3] | 62.67% | 6,804 |
| Russell | 7,584 | 67.44% | 704 | 6.26% | 2,707 | 24.07% | 250 | 2.22% | 4,877 | 43.37% | 11,245 |
| St. Clair | 7,050 | 72.70% | 1,635 | 16.86% | 869 | 8.96% | 143 | 1.47% | 5,415[lower-alpha 3] | 55.84% | 9,697 |
| Shelby | 7,736 | 71.83% | 1,706 | 15.84% | 1,105 | 10.26% | 223 | 2.07% | 6,030[lower-alpha 3] | 55.99% | 10,770 |
| Sumter | 2,158 | 44.89% | 303 | 6.30% | 2,336 | 48.60% | 10 | 0.21% | -178 | -3.71% | 4,807 |
| Talladega | 13,505 | 72.00% | 1,935 | 10.32% | 3,099 | 16.52% | 217 | 1.16% | 10,406 | 55.48% | 18,756 |
| Tallapoosa | 9,043 | 76.50% | 1,205 | 10.19% | 1,331 | 11.26% | 242 | 2.05% | 7,712 | 65.24% | 11,821 |
| Tuscaloosa | 18,611 | 65.60% | 3,822 | 13.47% | 5,556 | 19.58% | 382 | 1.35% | 13,055 | 46.02% | 28,371 |
| Walker | 14,416 | 74.37% | 2,628 | 13.56% | 1,971 | 10.17% | 370 | 1.91% | 11,788[lower-alpha 3] | 60.81% | 19,385 |
| Washington | 4,545 | 79.98% | 200 | 3.52% | 902 | 15.87% | 36 | 0.63% | 3,643 | 64.11% | 5,683 |
| Wilcox | 2,511 | 56.62% | 237 | 5.34% | 1,658 | 37.38% | 29 | 0.65% | 853 | 19.24% | 4,435 |
| Winston | 3,032 | 54.86% | 2,174 | 39.33% | 258 | 4.67% | 63 | 1.14% | 858[lower-alpha 3] | 15.53% | 5,527 |
| Totals | 691,425 | 65.86% | 146,923 | 13.99% | 196,579 | 18.72% | 14,982 | 1.43% | 494,846 | 47.14% | 1,049,909 |
Notes
- Although he was born in California and he served as a U.S. Senator from California, in 1968 Richard Nixon's official state of residence was New York, because he moved there to practice law after his defeat in the 1962 California gubernatorial election. During his first term as president, Nixon re-established his residency in California. Consequently, most reliable reference books list Nixon's home state as New York in the 1968 election and his home state as California in the 1972 (and 1960) election.
- Because Wallace was listed as the “Democratic” nominee in Alabama and carried the state, whilst Humphrey ran second, all margins given are Wallace vote minus Humphrey vote and percentage margins Wallace percentage minus Humphrey percentage unless noted otherwise.
- In this county where Nixon rather than Humphrey ran second behind Wallace, margin given is Wallace vote minus Nixon vote and percentage margin Wallace percentage minus Nixon percentage.
References
- "1968 Presidential General Election Results – Alabama". Dave Leip's Atlas of U.S. Presidential Elections. Retrieved 2014-09-02.
- Phillips, Kevin P.; The Emerging Republican Majority, p. 227 ISBN 9780691163246
- "1968 Presidential Election Statistics". Dave Leip's Atlas of U.S. Presidential Elections. Retrieved 2018-03-05.
- Phillips; The Emerging Republican Majority; p. 258
- Menendez, Albert J.; The Geography of Presidential Elections in the United States, 1868-2004, pp. 146-147 ISBN 0786422173
- State of Alabama Department of Archives and History, ‘General Election November 5, 1968’, Alabama Official and Statistical Register 1971