Cherokee County, Alabama
Cherokee County, Alabama is a county located in the northeastern part of the U.S. state of Alabama. As of the 2010 census, the population was 25,989.[1] Its county seat is Centre.[2] The county is named for the Cherokee tribe.
Cherokee County | |
|---|---|
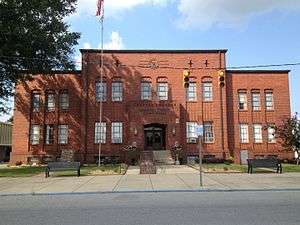 Cherokee County Courthouse in Centre | |
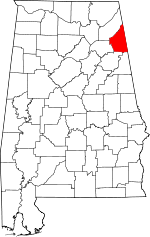 Location within the U.S. state of Alabama | |
 Alabama's location within the U.S. | |
| Coordinates: 34°10′11″N 85°35′39″W | |
| Country | |
| State | |
| Founded | January 9, 1836 |
| Named for | Cherokee Nation |
| Seat | Centre |
| Largest city | Centre |
| Area | |
| • Total | 600 sq mi (2,000 km2) |
| • Land | 554 sq mi (1,430 km2) |
| • Water | 46 sq mi (120 km2) 7.7%% |
| Population (2010) | |
| • Total | 25,989 |
| • Estimate (2019) | 26,196 |
| • Density | 43/sq mi (17/km2) |
| Time zone | UTC−6 (Central) |
| • Summer (DST) | UTC−5 (CDT) |
| Congressional districts | 3rd, 4th |
| Website | www |
| |
History
The area included in today's Cherokee County, for centuries, had belonged to the Muscogee (Creek) Nation of Native Americans. Cherokees began moving into the area a generation before the forced Indian Removal. To this day, there are few Native Americans in Cherokee County.
On January 9, 1836, the Alabama legislature created Cherokee County with its present boundaries.[3] Two years later, the United States government removed, by force, all Cherokees who had refused to leave on what would become known as the Trail of Tears.
Cherokee County was in the news again on Palm Sunday, March 27, 1994, when it was hit by a F4 tornado. Goshen United Methodist Church was destroyed only twelve minutes after the National Weather Service at Birmingham had issued a warning for northern Calhoun, southeastern Etowah, and southern Cherokee counties.
Geography
According to the 2000 census, the county has a total area of 600 square miles (1,600 km2), of which 554 square miles (1,430 km2) (or 92.19%) is land and 46 square miles (120 km2) (7.7%) is water.[4] It is the second-smallest county in Alabama by land area.
Major highways


Adjacent counties
- DeKalb County - north
- Chattooga County, Georgia - northeast
- Floyd County, Georgia - east
- Polk County, Georgia - southeast
- Cleburne County - south
- Calhoun County - south
- Etowah County - west
National protected areas
Demographics
| Historical population | |||
|---|---|---|---|
| Census | Pop. | %± | |
| 1840 | 8,773 | — | |
| 1850 | 13,884 | 58.3% | |
| 1860 | 18,360 | 32.2% | |
| 1870 | 11,132 | −39.4% | |
| 1880 | 19,108 | 71.6% | |
| 1890 | 20,459 | 7.1% | |
| 1900 | 21,096 | 3.1% | |
| 1910 | 20,226 | −4.1% | |
| 1920 | 20,862 | 3.1% | |
| 1930 | 20,219 | −3.1% | |
| 1940 | 19,928 | −1.4% | |
| 1950 | 17,634 | −11.5% | |
| 1960 | 16,303 | −7.5% | |
| 1970 | 15,606 | −4.3% | |
| 1980 | 18,760 | 20.2% | |
| 1990 | 19,543 | 4.2% | |
| 2000 | 23,988 | 22.7% | |
| 2010 | 25,989 | 8.3% | |
| Est. 2019 | 26,196 | [5] | 0.8% |
| U.S. Decennial Census[6] 1790–1960[7] 1900–1990[8] 1990–2000[9] 2010–2018[1] | |||
2010
As of the 2010 census,[10] there were 25,989 people, 10,626 households, and 7,493 families living in the county. The population density was 47 people per square mile (18/km2). There were 16,267 housing units at an average density of 27 per square mile (10/km2). The racial makeup of the county was 92.7% White, 4.6% Black or African American, 0.5% Native American, 0.2% Asian, 0.35% from other races, and 1.5% from two or more races. 1.2% of the population were Hispanic or Latino of any race.
Of the 10,626 households 25.1% had children under the age of 18 living with them, 55.3% were married couples living together, 10.4% had a female householder with no husband present, and 29.5% were non-families. 26.0% of households were one person and 10.4% were one person aged 65 or older. The average household size was 2.42 and the average family size was 2.89.
The age distribution was 21.4% under the age of 18, 7.3% from 18 to 24, 22.8% from 25 to 44, 30.6% from 45 to 64, and 17.9% 65 or older. The median age was 43.9 years. For every 100 females there were 98.4 males. For every 100 females age 18 and over, there were 101.8 males.
The median household income was $40,690 and the median family income was $47,365. Males had a median income of $40,050 versus $27,352 for females. The per capita income for the county was $21,322. About 13.7% of families and 17.6% of the population were below the poverty line, including 27.3% of those under age 18 and 9.4% of those age 65 or over.
2000
At the 2000 census there were 23,988 people, 9,719 households, and 7,201 families living in the county. The population density was 43 people per square mile (17/km2). There were 14,025 housing units at an average density of 25 per square mile (10/km2). The racial makeup of the county was 92.83% White, 5.54% Black or African American, 0.31% Native American, 0.14% Asian, 0.35% from other races, and 0.83% from two or more races. 0.85% of the population were Hispanic or Latino of any race.[11] Of the 9,719 households 28.90% had children under the age of 18 living with them, 61.40% were married couples living together, 9.20% had a female householder with no husband present, and 25.90% were non-families. 23.90% of households were one person and 10.40% were one person aged 65 or older. The average household size was 2.43 and the average family size was 2.86.
The age distribution was 22.20% under the age of 18, 7.60% from 18 to 24, 27.60% from 25 to 44, 26.70% from 45 to 64, and 15.90% 65 or older. The median age was 40 years. For every 100 females there were 96.70 males. For every 100 females age 18 and over, there were 93.50 males.
The median household income was $30,874 and the median family income was $36,920. Males had a median income of $29,978 versus $20,958 for females. The per capita income for the county was $15,543. About 11.80% of families and 15.60% of the population were below the poverty line, including 20.40% of those under age 18 and 14.90% of those age 65 or over.
Government
| Year | GOP | Dem | Others |
|---|---|---|---|
| 2016 | 83.4% 8,953 | 14.4% 1,547 | 2.2% 233 |
| 2012 | 76.7% 7,506 | 21.8% 2,132 | 1.6% 154 |
| 2008 | 74.9% 7,298 | 23.7% 2,306 | 1.5% 141 |
| 2004 | 65.5% 5,923 | 33.6% 3,040 | 1.0% 86 |
| 2000 | 53.1% 4,154 | 44.7% 3,497 | 2.2% 172 |
| 1996 | 36.2% 3,048 | 52.2% 4,399 | 11.6% 974 |
| 1992 | 34.9% 2,745 | 53.6% 4,222 | 11.5% 909 |
| 1988 | 47.0% 2,868 | 52.1% 3,176 | 0.9% 57 |
| 1984 | 51.0% 3,225 | 47.9% 3,029 | 1.0% 65 |
| 1980 | 38.6% 2,482 | 58.5% 3,764 | 3.0% 192 |
| 1976 | 23.9% 1,492 | 74.6% 4,668 | 1.5% 96 |
| 1972 | 71.9% 3,179 | 26.7% 1,182 | 1.4% 61 |
| 1968 | 6.0% 343 | 8.1% 462 | 85.8% 4,880 |
| 1964 | 49.7% 1,893 | 50.3% 1,916 | |
| 1960 | 22.0% 872 | 78.0% 3,097 | 0.1% 4 |
| 1956 | 24.1% 845 | 75.8% 2,661 | 0.2% 7 |
| 1952 | 16.8% 539 | 83.0% 2,664 | 0.3% 8 |
| 1948 | 16.8% 217 | 83.2% 1,076 | |
| 1944 | 18.6% 408 | 80.6% 1,774 | 0.8% 18 |
| 1940 | 12.7% 381 | 86.9% 2,617 | 0.4% 12 |
| 1936 | 14.9% 374 | 84.3% 2,114 | 0.8% 19 |
| 1932 | 15.7% 359 | 83.1% 1,897 | 1.2% 27 |
| 1928 | 62.8% 1,515 | 37.1% 894 | 0.2% 4 |
| 1924 | 37.1% 845 | 60.6% 1,380 | 2.2% 51 |
| 1920 | 43.7% 1,576 | 54.7% 1,969 | 1.6% 58 |
| 1916 | 30.3% 508 | 67.8% 1,136 | 1.9% 32 |
| 1912 | 5.0% 88 | 46.6% 814 | 48.4% 846[lower-alpha 1] |
| 1908 | 42.6% 602 | 50.4% 712 | 6.9% 98 |
| 1904 | 29.7% 502 | 53.5% 905 | 16.8% 285 |
Communities
City
- Centre (County Seat)
- Piedmont (partly in Calhoun County)
Towns
- Cedar Bluff
- Collinsville (Partly in DeKalb County)
- Gaylesville
- Leesburg
- Sand Rock (Partly in DeKalb County)
Census-designated places
Unincorporated communities
Ghost town
See also
References
- "State & County QuickFacts". United States Census Bureau. Archived from the original on February 20, 2014. Retrieved May 15, 2014.
- "Find a County". National Association of Counties. Archived from the original on May 3, 2015. Retrieved 2011-06-07.
- "Cherokee County, Ala". Calhoun Times. September 1, 2004. p. 39. Retrieved 24 April 2015.
- "2010 Census Gazetteer Files". United States Census Bureau. August 22, 2012. Retrieved August 22, 2015.
- "Population and Housing Unit Estimates". Retrieved May 18, 2019.
- "U.S. Decennial Census". United States Census Bureau. Retrieved August 22, 2015.
- "Historical Census Browser". University of Virginia Library. Retrieved August 22, 2015.
- Forstall, Richard L., ed. (March 24, 1995). "Population of Counties by Decennial Census: 1900 to 1990". United States Census Bureau. Retrieved August 22, 2015.
- "Census 2000 PHC-T-4. Ranking Tables for Counties: 1990 and 2000" (PDF). United States Census Bureau. April 2, 2001. Retrieved August 22, 2015.
- "U.S. Census website". United States Census Bureau. Retrieved July 10, 2015.
- "U.S. Census website". United States Census Bureau. Retrieved 2011-05-14.
- "Dave Leip's Atlas of U.S. Presidential Elections". Retrieved November 16, 2016.
Notes
- 799 votes for Progressive Theodore Roosevelt and 47 for Socialist Eugene Debs
External links
- Cherokee County Chamber of Commerce
- Cherokee County Historical Society
- Cherokee County Historical Museum
Places adjacent to Cherokee County, Alabama | ||||||||||
|---|---|---|---|---|---|---|---|---|---|---|
| ||||||||||
Municipalities and communities of Cherokee County, Alabama, United States | ||
|---|---|---|
| City | Map of Alabama highlighting Cherokee County | |
| Towns | ||
| CDPs | ||
| Unincorporated communities | ||
| Ghost town | ||
| Footnotes | ‡This populated place also has portions in an adjacent county or counties | |
Montgomery (capital) | ||
| Topics | ||
| Society |
| |
| Regions | ||
| Flora and fauna | ||
| Largest cities | ||
| Metros |
| |
| Counties |
| |
| Authority control |
|
|---|