St. Clair County, Alabama
St. Clair County is a county located in the central portion of the U.S. state of Alabama.[1] As of the 2010 census, the population was 83,593.[2] It has two county seats in Ashville and another in Pell City.[3] It is one of two counties in Alabama, and one of 33 in the United States, with more than one county seat. Its name is in honor of General Arthur St. Clair, an officer in the French and Indian War.[1]
St. Clair County | |
|---|---|
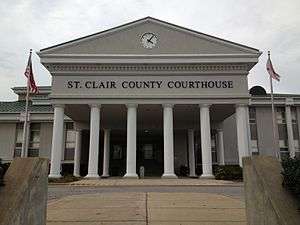 St. Clair County Courthouse in Pell City | |
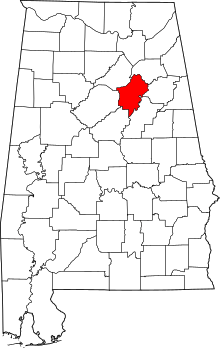 Location within the U.S. state of Alabama | |
 Alabama's location within the U.S. | |
| Coordinates: 33°42′57″N 86°19′05″W | |
| Country | |
| State | |
| Founded | November 20, 1818[1] |
| Named for | Arthur St. Clair |
| Seat | Ashville & Pell City |
| Largest city | Pell City |
| Area | |
| • Total | 654 sq mi (1,690 km2) |
| • Land | 632 sq mi (1,640 km2) |
| • Water | 22 sq mi (60 km2) 3.3%% |
| Population (2010) | |
| • Total | 83,593 |
| • Estimate (2019) | 89,512 |
| • Density | 130/sq mi (49/km2) |
| Time zone | UTC−6 (Central) |
| • Summer (DST) | UTC−5 (CDT) |
| Congressional district | 3rd |
| Website | www |
| |
St. Clair County is included in the Birmingham-Hoover, Alabama Metropolitan Statistical Area.
History
St. Clair County was established on November 20, 1818 by the Alabama Territory legislature by splitting the area from Shelby County.[1][4] The county seat was incorporated and named "Ashville" in honor of John Ash.[1] In 1836, a portion of St. Clair County was separated to establish Cherokee County and DeKalb County. In 1866, after the Civil War, a northeast section of the county was used to create Etowah County.[1]
Geography
According to the U.S. Census Bureau, the county has a total area of 654 square miles (1,690 km2), of which 632 square miles (1,640 km2) is land and 22 square miles (57 km2) (3.3%) is water.[5]
Adjacent counties
- Etowah County - north
- Calhoun County - east
- Talladega County - southeast
- Shelby County - southwest
- Jefferson County - west
- Blount County - northwest
Transportation
Major highways
.svg.png)
.svg.png)


Demographics
| Historical population | |||
|---|---|---|---|
| Census | Pop. | %± | |
| 1820 | 4,166 | — | |
| 1830 | 5,975 | 43.4% | |
| 1840 | 5,638 | −5.6% | |
| 1850 | 6,829 | 21.1% | |
| 1860 | 11,013 | 61.3% | |
| 1870 | 9,360 | −15.0% | |
| 1880 | 14,462 | 54.5% | |
| 1890 | 17,353 | 20.0% | |
| 1900 | 19,425 | 11.9% | |
| 1910 | 20,715 | 6.6% | |
| 1920 | 23,383 | 12.9% | |
| 1930 | 24,510 | 4.8% | |
| 1940 | 27,336 | 11.5% | |
| 1950 | 26,687 | −2.4% | |
| 1960 | 25,388 | −4.9% | |
| 1970 | 27,956 | 10.1% | |
| 1980 | 41,205 | 47.4% | |
| 1990 | 50,009 | 21.4% | |
| 2000 | 64,742 | 29.5% | |
| 2010 | 83,593 | 29.1% | |
| Est. 2019 | 89,512 | [6] | 7.1% |
| U.S. Decennial Census[7] 1790–1960[8] 1900–1990[9] 1990–2000[10] 2010–2018[2] | |||
At the 2000 census there were 64,742 people, 24,143 households, and 18,445 families living in the county. The population density was 102 people per square mile (39/km2). There were 27,303 housing units at an average density of 43 per square mile (17/km2). The racial makeup of the county was 90.03% White, 8.13% Black or African American, 0.37% Native American, 0.17% Asian, 0.03% Pacific Islander, 0.41% from other races, and 0.85% from two or more races. 1.06% of the population were Hispanic or Latino of any race.[11] In 2000 the largest ancestry groups in St. Clair county were:
- English 71%
- Irish 13.1%
- African 8.13%
- German 8%
- Scots-Irish 3.5%
- Dutch 2.4%
- Scottish 2%
Of the 24,143 households 35.10% had children under the age of 18 living with them, 62.80% were married couples living together, 10.00% had a female householder with no husband present, and 23.60% were non-families. 20.80% of households were one person and 8.20% were one person aged 65 or older. The average household size was 2.60 and the average family size was 3.01.
The age distribution was 25.40% under the age of 18, 7.90% from 18 to 24, 30.70% from 25 to 44, 24.30% from 45 to 64, and 11.70% 65 or older. The median age was 36 years. For every 100 females, there were 101.80 males. For every 100 females age 18 and over, there were 98.80 males.
The median household income was $37,285 and the median family income was $43,152. Males had a median income of $33,914 versus $24,433 for females. The per capita income for the county was $17,960. About 9.60% of families and 12.10% of the population were below the poverty line, including 15.20% of those under age 18 and 12.60% of those age 65 or over.
2010 census
At the 2010 census there were 83,593 people, 31,624 households, and 23,364 families living in the county. The population density was 132 people per square mile (51/km2). There were 35,541 housing units at an average density of 56 per square mile (22/km2). The racial makeup of the county was 88.2% White, 8.6% Black or African American, 0.3% Native American, 0.6% Asian, 0.1% Pacific Islander, 0.9% from other races, and 1.3% from two or more races. 2.1% of the population were Hispanic or Latino of any race.[12] Of the 31,624 households 30.7% had children under the age of 18 living with them, 58.3% were married couples living together, 11.2% had a female householder with no husband present, and 26.1% were non-families. 22.5% of households were one person and 8.5% were one person aged 65 or older. The average household size was 2.58 and the average family size was 3.02.
The age distribution was 23.7% under the age of 18, 7.8% from 18 to 24, 27.8% from 25 to 44, 27.6% from 45 to 64, and 13.1% 65 or older. The median age was 38.6 years. For every 100 females, there were 100.5 males. For every 100 females age 18 and over, there were 102.3 males.
The median household income was $48,837 and the median family income was $56,107. Males had a median income of $43,287 versus $32,843 for females. The per capita income for the county was $22,192. About 8.3% of families and 10.6% of the population were below the poverty line, including 13.2% of those under age 18 and 9.5% of those age 65 or over.
Government
| Year | GOP | Dem | Others |
|---|---|---|---|
| 2016 | 82.4% 31,651 | 14.6% 5,589 | 3.0% 1,160 |
| 2012 | 82.4% 29,031 | 16.5% 5,801 | 1.1% 403 |
| 2008 | 81.1% 27,649 | 17.9% 6,091 | 1.0% 348 |
| 2004 | 80.6% 23,500 | 18.7% 5,456 | 0.7% 205 |
| 2000 | 71.1% 17,117 | 26.9% 6,485 | 2.0% 488 |
| 1996 | 62.3% 12,762 | 30.2% 6,187 | 7.5% 1,540 |
| 1992 | 57.6% 12,447 | 30.1% 6,517 | 12.3% 2,660 |
| 1988 | 70.7% 10,604 | 28.9% 4,335 | 0.4% 58 |
| 1984 | 71.0% 10,408 | 27.3% 4,000 | 1.7% 246 |
| 1980 | 56.9% 7,768 | 38.4% 5,236 | 4.8% 650 |
| 1976 | 44.9% 4,877 | 52.0% 5,653 | 3.1% 339 |
| 1972 | 79.8% 6,952 | 17.7% 1,538 | 2.5% 220 |
| 1968 | 16.9% 1,635 | 9.0% 869 | 74.2% 7,193 |
| 1964 | 70.8% 4,813 | 29.2% 1,989 | |
| 1960 | 45.9% 2,589 | 53.9% 3,039 | 0.2% 12 |
| 1956 | 49.1% 2,441 | 48.6% 2,420 | 2.3% 114 |
| 1952 | 40.5% 1,590 | 59.3% 2,326 | 0.2% 6 |
| 1948 | 35.7% 1,063 | 64.3% 1,917 | |
| 1944 | 37.9% 1,117 | 61.7% 1,819 | 0.5% 14 |
| 1940 | 38.3% 1,540 | 61.2% 2,462 | 0.6% 22 |
| 1936 | 37.7% 1,464 | 61.8% 2,399 | 0.4% 17 |
| 1932 | 39.4% 1,449 | 59.5% 2,185 | 1.1% 41 |
| 1928 | 66.3% 2,581 | 33.7% 1,313 | 0.1% 2 |
| 1924 | 50.6% 1,432 | 45.3% 1,281 | 4.1% 115 |
| 1920 | 55.0% 2,561 | 41.6% 1,934 | 3.4% 158 |
| 1916 | 44.8% 851 | 52.0% 987 | 3.2% 61 |
| 1912 | 14.4% 260 | 43.5% 787 | 42.1% 762 |
| 1908 | 43.6% 782 | 45.7% 820 | 10.7% 192 |
| 1904 | 30.6% 593 | 46.8% 908 | 22.7% 440 |
Communities
Cities
- Ashville (county seat)
- Leeds (mostly in Jefferson County and Shelby County)
- Margaret
- Moody
- Pell City (county seat)
- Springville
- Trussville (mostly in Jefferson County)
Towns
- Argo (partly in Jefferson County)
- Odenville
- Ragland
- Riverside
- Steele
- Vincent (partly in Shelby County and Talladega County)
Unincorporated communities
Former Towns
- Branchville (now a neighborhood in Odenville)
Places of interest
St. Clair County is home to Logan Martin Lake. It also contains Horse Pens 40, a private outdoor park on top of Chandler Mountain.
See also
References
- "ACES Winston County Office" (links/history), Alabama Cooperative Extension System (ACES), 2007, webpage: ACES-St.Clair.
- "State & County QuickFacts". United States Census Bureau. Retrieved May 17, 2014.
- "Find a County". National Association of Counties. Retrieved June 7, 2011.
- A digest of the laws of the State of Alabama: containing the statutes and resolutions in force at the end of the General Assembly in January, 1823. Published by Ginn & Curtis, J. & J. Harper, Printers, New-York, 1828. Title 10. Chapter XIX. Pages 88-89. "An Act to alter and ascertain more particularly the Boundaries of the County of Shelby and to lay off a new County in the northeast part thereof, to be called and known by the name of St. Clair County--Passed November 20 1818." (Google Books)
- "2010 Census Gazetteer Files". United States Census Bureau. August 22, 2012. Retrieved August 22, 2015.
- "Population and Housing Unit Estimates". Retrieved May 17, 2019.
- "U.S. Decennial Census". United States Census Bureau. Retrieved August 22, 2015.
- "Historical Census Browser". University of Virginia Library. Retrieved August 22, 2015.
- Forstall, Richard L., ed. (March 24, 1995). "Population of Counties by Decennial Census: 1900 to 1990". United States Census Bureau. Retrieved August 22, 2015.
- "Census 2000 PHC-T-4. Ranking Tables for Counties: 1990 and 2000" (PDF). United States Census Bureau. April 2, 2001. Retrieved August 22, 2015.
- "U.S. Census website". United States Census Bureau. Retrieved May 14, 2011.
- "U.S. Census website". United States Census Bureau. Retrieved 2015-08-08.
- "Dave Leip's Atlas of U.S. Presidential Elections". Retrieved November 21, 2016.
External links

- Official Site
Places adjacent to St. Clair County, Alabama | ||||||||||
|---|---|---|---|---|---|---|---|---|---|---|
| ||||||||||
Municipalities and communities of St. Clair County, Alabama, United States | ||
|---|---|---|
| Cities | Map of Alabama highlighting St. Clair County | |
| Towns | ||
| Unincorporated communities | ||
| Former towns | ||
| Footnotes | ‡This populated place also has portions in an adjacent county or counties | |
Montgomery (capital) | ||
| Topics | ||
| Society |
| |
| Regions | ||
| Flora and fauna | ||
| Largest cities | ||
| Metros |
| |
| Counties |
| |
| Authority control |
|
|---|