Covington County, Alabama
Covington County (briefly Jones County), is a county located in the south central portion of the U.S. state of Alabama. As of the 2010 census the population was 37,765.[1] Its county seat is Andalusia.[2] Its name is in honor of Brigadier General Leonard Covington of Maryland[3] and Mississippi, who died in the War of 1812.
Covington County | |
|---|---|
 The Covington County Courthouse in Andalusia | |
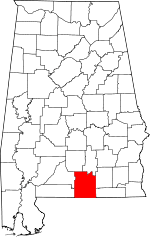 Location within the U.S. state of Alabama | |
 Alabama's location within the U.S. | |
| Coordinates: 31°14′31″N 86°27′09″W | |
| Country | |
| State | |
| Founded | December 17, 1821 |
| Named for | Leonard Covington |
| Seat | Andalusia |
| Largest city | Andalusia |
| Area | |
| • Total | 1,044 sq mi (2,700 km2) |
| • Land | 1,030 sq mi (2,700 km2) |
| • Water | 13 sq mi (30 km2) 1.3%% |
| Population (2010) | |
| • Total | 37,765 |
| • Estimate (2019) | 37,049 |
| • Density | 36/sq mi (14/km2) |
| Time zone | UTC−6 (Central) |
| • Summer (DST) | UTC−5 (CDT) |
| Congressional district | 2nd |
| Website | www |
| |
History
Covington County was established on December 17, 1821. The Alabama state legislature changed the name to Jones County on August 6, 1868. Two months later on October 10, 1868, the original name was restored.[4]
The county was declared a disaster area in September 1979 due to damage from Hurricane Frederic and again in October 1995 due to Hurricane Opal.
Geography
According to the U.S. Census Bureau, the county has a total area of 1,044 square miles (2,700 km2), of which 1,030 square miles (2,700 km2) is land and 13 square miles (34 km2) (1.3%) is water.[5] The county is located in the Gulf Coastal Plain region of the state. It is drained by the Conecuh and Yellow rivers.[6]
Major highways


Adjacent counties
- Butler County (north)
- Crenshaw County (north)
- Coffee County (east)
- Geneva County (east)
- Walton County, Florida (southeast)
- Okaloosa County, Florida (southwest)
- Escambia County (west)
- Conecuh County (west)
National protected area
- Conecuh National Forest (part)
Demographics
| Historical population | |||
|---|---|---|---|
| Census | Pop. | %± | |
| 1830 | 1,522 | — | |
| 1840 | 2,435 | 60.0% | |
| 1850 | 3,645 | 49.7% | |
| 1860 | 6,469 | 77.5% | |
| 1870 | 4,868 | −24.7% | |
| 1880 | 5,639 | 15.8% | |
| 1890 | 7,536 | 33.6% | |
| 1900 | 15,346 | 103.6% | |
| 1910 | 32,124 | 109.3% | |
| 1920 | 38,103 | 18.6% | |
| 1930 | 41,356 | 8.5% | |
| 1940 | 42,417 | 2.6% | |
| 1950 | 40,373 | −4.8% | |
| 1960 | 35,631 | −11.7% | |
| 1970 | 34,079 | −4.4% | |
| 1980 | 36,850 | 8.1% | |
| 1990 | 36,478 | −1.0% | |
| 2000 | 37,631 | 3.2% | |
| 2010 | 37,765 | 0.4% | |
| Est. 2019 | 37,049 | [7] | −1.9% |
| U.S. Decennial Census[8] 1790–1960[9] 1900–1990[10] 1990–2000[11] 2010–2018[1] | |||
At the 2000 census there were 37,631 people, 15,640 households, and 10,791 families living in the county. The population density was 36 people per square mile (14/km2). There were 18,578 housing units at an average density of 18 per square mile (7/km2). The racial makeup of the county was 86.2% White, 12.4% Black or African American, 0.5% Native American, 0.2% Asian, <0.1% Pacific Islander, 0.2% from other races, and 0.6% from two or more races. 0.8% of the population were Hispanic or Latino of any race.[12] Of the 15,640 households 29.5% had children under the age of 18 living with them, 54.1% were married couples living together, 11.3% had a female householder with no husband present, and 31.0% were non-families. 28.6% of households were one person and 14.1% were one person aged 65 or older. The average household size was 2.37 and the average family size was 2.90.
The age distribution was 23.5% under the age of 18, 8.1% from 18 to 24, 26.1% from 25 to 44, 24.3% from 45 to 64, and 17.9% 65 or older. The median age was 40 years. For every 100 females there were 91.60 males. For every 100 females age 18 and over, there were 88.00 males.
The median household income was $26,336 and the median family income was $33,201. Males had a median income of $27,453 versus $19,640 for females. The per capita income for the county was $15,365. About 14.1% of families and 18.4% of the population were below the poverty line, including 23.9% of those under age 18 and 19.2% of those age 65 or over.
2010 census
At the 2010 census there were 37,765 people, 15,531 households, and 10,791 families living in the county. The population density was 37 people per square mile (14/km2). There were 18,829 housing units at an average density of 18 per square mile (7/km2). The racial makeup of the county was 84.8% White, 12.5% Black or African American, 0.6% Native American, 0.4% Asian, 0.0% Pacific Islander, 0.4% from other races, and 1.4% from two or more races. 1.3% of the population were Hispanic or Latino of any race.[13] Of the 15,531 households 26.0% had children under the age of 18 living with them, 50.2% were married couples living together, 13.1% had a female householder with no husband present, and 32.1% were non-families. 28.1% of households were one person and 12.6% were one person aged 65 or older. The average household size was 2.39 and the average family size was 2.91.
The age distribution was 22.6% under the age of 18, 7.8% from 18 to 24, 22.8% from 25 to 44, 28.4% from 45 to 64, and 18.4% 65 or older. The median age was 42.4 years. For every 100 females there were 93.9 males. For every 100 females age 18 and over, there were 96.4 males.
The median household income was $33,852 and the median family income was $43,468. Males had a median income of $32,463 versus $26,241 for females. The per capita income for the county was $19,822. About 15.7% of families and 19.0% of the population were below the poverty line, including 28.3% of those under age 18 and 12.8% of those age 65 or over.
As of 2012 the largest self-reported European ancestry group in Covington County is English with 41.2% of people in Covington County citing that they were of English descent. They were followed by people who wrote that they were of "American" ancestry, who made up 16.0% of Covington county. Irish was the third largest self-reported European ancestry with 14.5% of people in the county writing that they were of Irish descent.
Government
| Year | GOP | Dem | Others |
|---|---|---|---|
| 2016 | 83.2% 13,267 | 15.0% 2,387 | 1.8% 286 |
| 2012 | 78.7% 12,153 | 20.5% 3,158 | 0.8% 128 |
| 2008 | 78.8% 12,444 | 20.5% 3,240 | 0.7% 103 |
| 2004 | 76.0% 11,119 | 23.4% 3,423 | 0.6% 85 |
| 2000 | 65.8% 8,961 | 32.6% 4,440 | 1.6% 212 |
| 1996 | 50.7% 6,035 | 38.1% 4,543 | 11.2% 1,335 |
| 1992 | 49.0% 6,840 | 35.8% 5,004 | 15.2% 2,118 |
| 1988 | 67.3% 8,130 | 31.9% 3,845 | 0.8% 98 |
| 1984 | 71.6% 9,944 | 27.5% 3,812 | 0.9% 127 |
| 1980 | 51.5% 7,014 | 46.3% 6,305 | 2.1% 289 |
| 1976 | 40.7% 4,977 | 57.9% 7,081 | 1.4% 166 |
| 1972 | 85.3% 9,278 | 14.2% 1,547 | 0.5% 56 |
| 1968 | 6.3% 831 | 6.0% 791 | 87.6% 11,506 |
| 1964 | 82.3% 7,554 | 17.7% 1,621 | |
| 1960 | 26.2% 2,047 | 73.4% 5,744 | 0.4% 33 |
| 1956 | 30.1% 2,257 | 65.3% 4,887 | 4.6% 346 |
| 1952 | 24.1% 1,581 | 75.6% 4,956 | 0.3% 21 |
| 1948 | 5.3% 154 | 94.8% 2,782 | |
| 1944 | 7.9% 256 | 92.0% 2,972 | 0.1% 3 |
| 1940 | 3.9% 186 | 96.1% 4,635 | 0.1% 3 |
| 1936 | 3.8% 167 | 95.9% 4,265 | 0.3% 15 |
| 1932 | 2.5% 99 | 97.2% 3,855 | 0.4% 14 |
| 1928 | 45.6% 1,681 | 54.3% 2,000 | 0.1% 5 |
| 1924 | 7.5% 156 | 85.9% 1,776 | 6.6% 136 |
| 1920 | 20.7% 548 | 76.8% 2,039 | 2.5% 67 |
| 1916 | 14.0% 305 | 79.9% 1,738 | 6.0% 131 |
| 1912 | 6.5% 110 | 73.5% 1,251 | 20.0% 340 |
| 1908 | 21.2% 315 | 70.9% 1,054 | 7.9% 118 |
| 1904 | 23.2% 310 | 68.0% 907 | 8.8% 117 |
Communities
Towns
See also
References
- "State & County QuickFacts". United States Census Bureau. Archived from the original on May 17, 2014. Retrieved May 16, 2014.
- "Find a County". National Association of Counties. Archived from the original on May 31, 2011. Retrieved June 7, 2011.
- Gannett, Henry (1905). The Origin of Certain Place Names in the United States. Govt. Print. Off. pp. 94.
- Owen, Thomas McAdory (1921). History of Alabama and Dictionary of Alabama Biography. I. Chicago: S. J. Clarke Publishing Company. p. 429.
- "2010 Census Gazetteer Files". United States Census Bureau. August 22, 2012. Retrieved August 22, 2015.
-

- "Population and Housing Unit Estimates". Retrieved May 20, 2019.
- "U.S. Decennial Census". United States Census Bureau. Retrieved August 22, 2015.
- "Historical Census Browser". University of Virginia Library. Retrieved August 22, 2015.
- Forstall, Richard L., ed. (March 24, 1995). "Population of Counties by Decennial Census: 1900 to 1990". United States Census Bureau. Retrieved August 22, 2015.
- "Census 2000 PHC-T-4. Ranking Tables for Counties: 1990 and 2000" (PDF). United States Census Bureau. April 2, 2001. Retrieved August 22, 2015.
- "U.S. Census website". United States Census Bureau. Retrieved May 14, 2011.
- "U.S. Census website". United States Census Bureau. Retrieved 2015-07-19.
- "Dave Leip's Atlas of U.S. Presidential Elections". Retrieved November 16, 2016.
Places adjacent to Covington County, Alabama | ||||||||||
|---|---|---|---|---|---|---|---|---|---|---|
| ||||||||||
Municipalities and communities of Covington County, Alabama, United States | ||
|---|---|---|
| Cities | Map of Alabama highlighting Covington County | |
| Towns | ||
| Unincorporated community | ||
Montgomery (capital) | ||
| Topics | ||
| Society |
| |
| Regions | ||
| Flora and fauna | ||
| Largest cities | ||
| Metros |
| |
| Counties |
| |
| Authority control |
|
|---|