Coosa County, Alabama
Coosa County is a county located in the east central portion of the U.S. state of Alabama. As of the 2010 census the population was 11,539.[1] Its county seat is Rockford.[2] Its name derives from a town of the Creek tribe and the Coosa River, which forms one of the county borders.
Coosa County | |
|---|---|
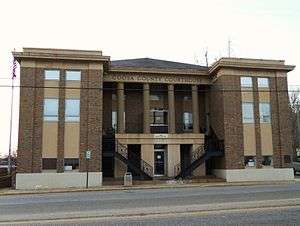 County courthouse in Rockford | |
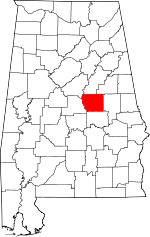 Location within the U.S. state of Alabama | |
 Alabama's location within the U.S. | |
| Coordinates: 32°56′11″N 86°14′47″W | |
| Country | |
| State | |
| Founded | December 18, 1832 |
| Seat | Rockford |
| Largest city | Goodwater |
| Area | |
| • Total | 666 sq mi (1,720 km2) |
| • Land | 651 sq mi (1,690 km2) |
| • Water | 15 sq mi (40 km2) 2.3%% |
| Population (2010) | |
| • Total | 11,539 |
| • Estimate (2019) | 10,663 |
| • Density | 17/sq mi (6.7/km2) |
| Time zone | UTC−6 (Central) |
| • Summer (DST) | UTC−5 (CDT) |
| Congressional district | 6th |
| Website | www |
| |
Coosa County is included in the Talladega-Sylacauga, AL Micropolitan Statistical Area, which is also included in the Birmingham-Hoover-Talladega, AL Combined Statistical Area.
History
The county was established on December 18, 1832, formed from parts of Montgomery and Shelby counties. It gained a small snippet from Montgomery County in 1837 and lost a portion to the south upon the creation of Elmore County in 1866.
Geography
According to the U.S. Census Bureau, the county has a total area of 666 square miles (1,720 km2), of which 651 square miles (1,690 km2) is land and 15 square miles (39 km2) (2.3%) is water.[3] The county is located in the Piedmont region of the state.
Major Highways


Adjacent Counties
- Talladega County (north)
- Clay County (northeast)
- Tallapoosa County (east)
- Elmore County (south)
- Chilton County (west)
- Shelby County (northwest)
Demographics
| Historical population | |||
|---|---|---|---|
| Census | Pop. | %± | |
| 1840 | 6,995 | — | |
| 1850 | 14,543 | 107.9% | |
| 1860 | 19,273 | 32.5% | |
| 1870 | 11,945 | −38.0% | |
| 1880 | 15,113 | 26.5% | |
| 1890 | 15,906 | 5.2% | |
| 1900 | 16,144 | 1.5% | |
| 1910 | 16,634 | 3.0% | |
| 1920 | 14,839 | −10.8% | |
| 1930 | 12,460 | −16.0% | |
| 1940 | 13,460 | 8.0% | |
| 1950 | 11,766 | −12.6% | |
| 1960 | 10,726 | −8.8% | |
| 1970 | 10,662 | −0.6% | |
| 1980 | 11,377 | 6.7% | |
| 1990 | 11,063 | −2.8% | |
| 2000 | 12,202 | 10.3% | |
| 2010 | 11,539 | −5.4% | |
| Est. 2019 | 10,663 | [4] | −7.6% |
| U.S. Decennial Census[5] 1790–1960[6] 1900–1990[7] 1990–2000[8] 2010–2018[1] | |||
From 2000 to 2003, Coosa County's growth rate of -5.8% made it the biggest percentage population loser among the state's 67 counties.[9] Annette Jones Watters of the University of Alabama's Alabama State Data Center cited Coosa as one of eight counties to lose greater than 6% of its population from 2000 to early 2007.[10]
At the 2000 census there were 12,202 people, 4,682 households, and 3,408 families living in the county. The population density was 19 people per square mile (7/km2). There were 6,142 housing units at an average density of 9 per square mile (4/km2). The racial makeup of the county was 63.94% White, 34.19% Black or African American, 0.32% Native American, 0.04% Asian, 0.01% Pacific Islander, 0.62% from other races, and 0.88% from two or more races. 1.29% of the population were Hispanic or Latino of any race.[11] Of the 4,682 households 30.00% had children under the age of 18 living with them, 54.80% were married couples living together, 13.50% had a female householder with no husband present, and 27.20% were non-families. 24.30% of households were one person and 9.80% were one person aged 65 or older. The average household size was 2.52 and the average family size was 2.98.
The age distribution was 23.70% under the age of 18, 8.60% from 18 to 24, 29.00% from 25 to 44, 24.30% from 45 to 64, and 14.40% 65 or older. The median age was 38 years. For every 100 females, there were 104.40 males. For every 100 females age 18 and over, there were 102.50 males.
The median household income was $29,873 and the median family income was $36,082. Males had a median income of $25,390 versus $18,171 for females. The per capita income for the county was $14,875. About 11.80% of families and 14.90% of the population were below the poverty line, including 19.50% of those under age 18 and 13.40% of those age 65 or over.
2010 census
At the 2010 census there were 11,539 people, 4,794 households, and 3,293 families living in the county. The population density was 18 people per square mile (7/km2). There were 6,478 housing units at an average density of 9.7 per square mile (/km3.8). The racial makeup of the county was 66.3% White, 31.0% Black or African American, 0.3% Native American, 0.1% Asian, 0.1% Pacific Islander, 1.2% from other races, and 0.9% from two or more races. 2.0% of the population were Hispanic or Latino of any race.[12] Of the 4,794 households 23.0% had children under the age of 18 living with them, 49.5% were married couples living together, 14.1% had a female householder with no husband present, and 31.3% were non-families. 27.9% of households were one person and 11.1% were one person aged 65 or older. The average household size was 2.38 and the average family size was 2.89.
The age distribution was 20.5% under the age of 18, 7.4% from 18 to 24, 23.2% from 25 to 44, 31.8% from 45 to 64, and 17.1% 65 or older. The median age was 44.2 years. For every 100 females, there were 98.5 males. For every 100 females age 18 and over, there were 98.7 males.
The median household income was $35,560 and the median family income was $47,451. Males had a median income of $40,315 versus $26,826 for females. The per capita income for the county was $19,209. About 11.4% of families and 16.0% of the population were below the poverty line, including 20.6% of those under age 18 and 14.2% of those age 65 or over.
Government
| Year | GOP | Dem | Others |
|---|---|---|---|
| 2016 | 64.4% 3,381 | 33.9% 1,782 | 1.7% 89 |
| 2012 | 57.7% 3,049 | 41.5% 2,191 | 0.8% 42 |
| 2008 | 58.4% 3,248 | 40.9% 2,273 | 0.8% 42 |
| 2004 | 58.1% 2,905 | 41.1% 2,055 | 0.8% 41 |
| 2000 | 52.2% 2,382 | 46.1% 2,104 | 1.8% 81 |
| 1996 | 41.7% 1,721 | 51.3% 2,121 | 7.0% 289 |
| 1992 | 41.1% 1,973 | 48.6% 2,330 | 10.3% 495 |
| 1988 | 56.2% 2,405 | 43.4% 1,860 | 0.4% 18 |
| 1984 | 59.0% 2,585 | 40.6% 1,781 | 0.4% 19 |
| 1980 | 40.7% 1,714 | 56.6% 2,383 | 2.7% 112 |
| 1976 | 31.8% 1,196 | 67.3% 2,533 | 1.0% 37 |
| 1972 | 77.2% 2,672 | 22.3% 773 | 0.5% 16 |
| 1968 | 8.7% 330 | 16.4% 623 | 75.0% 2,858 |
| 1964 | 72.8% 1,978 | 27.2% 740 | |
| 1960 | 41.7% 1,073 | 58.0% 1,493 | 0.4% 9 |
| 1956 | 42.5% 1,070 | 56.0% 1,411 | 1.5% 38 |
| 1952 | 34.4% 788 | 65.5% 1,501 | 0.1% 2 |
| 1948 | 24.5% 275 | 75.5% 849 | |
| 1944 | 26.6% 394 | 72.9% 1,079 | 0.5% 8 |
| 1940 | 18.9% 317 | 80.3% 1,347 | 0.8% 13 |
| 1936 | 14.8% 239 | 83.2% 1,346 | 2.0% 32 |
| 1932 | 16.3% 250 | 82.7% 1,265 | 1.0% 15 |
| 1928 | 60.6% 1,078 | 39.3% 699 | 0.1% 1 |
| 1924 | 38.7% 508 | 60.1% 790 | 1.2% 16 |
| 1920 | 42.0% 741 | 57.1% 1,007 | 0.9% 16 |
| 1916 | 34.9% 485 | 62.4% 867 | 2.7% 37 |
| 1912 | 9.0% 109 | 63.3% 763 | 27.7% 334 |
| 1908 | 35.9% 447 | 57.6% 717 | 6.4% 80 |
| 1904 | 31.0% 472 | 61.3% 933 | 7.8% 118 |
Communities
Census-designated places
Unincorporated communities
- Dollar
- Equality (partly in Elmore County and Tallapoosa County)
- Fishpond
- Hatchet
- Marble Valley
- Nixburg
See also
References
- "State & County QuickFacts". United States Census Bureau. Archived from the original on May 17, 2014. Retrieved May 16, 2014.
- "Find a County". National Association of Counties. Archived from the original on May 31, 2011. Retrieved June 7, 2011.
- "2010 Census Gazetteer Files". United States Census Bureau. August 22, 2012. Retrieved August 22, 2015.
- "Population and Housing Unit Estimates". Retrieved May 17, 2019.
- "U.S. Decennial Census". United States Census Bureau. Retrieved August 22, 2015.
- "Historical Census Browser". University of Virginia Library. Retrieved August 22, 2015.
- Forstall, Richard L., ed. (March 24, 1995). "Population of Counties by Decennial Census: 1900 to 1990". United States Census Bureau. Retrieved August 22, 2015.
- "Census 2000 PHC-T-4. Ranking Tables for Counties: 1990 and 2000" (PDF). United States Census Bureau. April 2, 2001. Retrieved August 22, 2015.
- "Population growth - Alabama counties". U.S. Census Bureau, ePodunk. Retrieved May 15, 2007.
- "Shelby County Continues to Set the Pace for County Growth; Black Belt Counties Lose Population, According to UA's State Data Center". University of Alabama. March 21, 2007. Archived from the original on May 17, 2008. Retrieved May 15, 2007.
- "U.S. Census website". United States Census Bureau. Retrieved May 14, 2011.
- "U.S. Census website". United States Census Bureau. Retrieved 2015-07-19.
- "Dave Leip's Atlas of U.S. Presidential Elections". Retrieved November 16, 2016.
Places adjacent to Coosa County, Alabama | ||||||||||
|---|---|---|---|---|---|---|---|---|---|---|
| ||||||||||
Municipalities and communities of Coosa County, Alabama, United States | ||
|---|---|---|
| Towns | Map of Alabama highlighting Coosa County | |
| CDPs | ||
| Unincorporated communities | ||
| Footnotes | ‡This populated place also has portions in an adjacent county or counties | |
Montgomery (capital) | ||
| Topics | ||
| Society |
| |
| Regions | ||
| Flora and fauna | ||
| Largest cities | ||
| Metros |
| |
| Counties |
| |

| Authority control |
|
|---|