Chilton County, Alabama
Chilton County is a county located in the central portion of the U.S. state of Alabama. As of the 2010 census, the population was 43,643.[1] The county seat is Clanton. Its name is in honor of William Parish Chilton, Sr. (1810–1871), a lawyer who became Chief Justice of the Alabama Supreme Court and later represented Montgomery County in the Congress of the Confederate States of America.
Chilton County | |
|---|---|
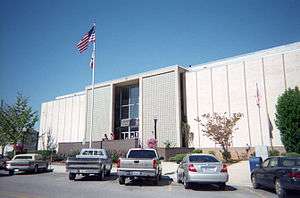 Chilton County Courthouse in Clanton | |
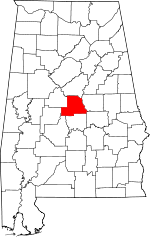 Location within the U.S. state of Alabama | |
 Alabama's location within the U.S. | |
| Coordinates: 32°50′43″N 86°42′52″W | |
| Country | |
| State | |
| Founded | December 30, 1868 |
| Named for | William Parish Chilton, Sr. |
| Seat | Clanton |
| Largest city | Clanton |
| Area | |
| • Total | 701 sq mi (1,820 km2) |
| • Land | 693 sq mi (1,790 km2) |
| • Water | 7.9 sq mi (20 km2) 1.1%% |
| Population (2010) | |
| • Total | 43,643 |
| • Estimate (2019) | 44,428 |
| • Density | 62/sq mi (24/km2) |
| Time zone | UTC−6 (Central) |
| • Summer (DST) | UTC−5 (CDT) |
| Congressional district | 6th |
| Website | www |
| |
Chilton County is included in the Birmingham-Hoover, AL Metropolitan Statistical Area.
In 2010, the center of population of Alabama was located in Chilton County, near the city of Jemison, an area known as Jemison Division.[2]
The county is known for its peaches and its unique landscape. It is home to swamps, prairies, and mountains due to the foothills of the Appalachians which end in the county, the Coosa River basin, and its proximity to the Black Belt Prairie that was long a center of cotton production.
History
Baker County was established on December 30, 1868, named for Alfred Baker, with its county seat at Grantville. Residents of the county petitioned the Alabama legislature for the renaming of their county; it was not something forced upon them. On December 17, 1874, the petitioners accepted the suggestion of Chilton County, even though the Chief Justice had not lived within its boundaries.[3] In 1870, the county seat was moved after the courthouse burned to what is now Clanton.
In 1942, the U.S. Navy commissioned a new vessel, the USS Chilton, in honor of Chilton County.
Geography
According to the U.S. Census Bureau, the county has a total area of 701 square miles (1,820 km2), of which 693 square miles (1,790 km2) is land and 7.9 square miles (20 km2) (1.1%) is water.[4]
Major highways
.svg.png)


Adjacent counties
- Shelby County (north)
- Coosa County (east)
- Elmore County (southeast)
- Autauga County (south)
- Perry County (southwest)
- Dallas County (southwest)
- Bibb County (northwest)
National protected area
- Talladega National Forest (part)
Demographics
| Historical population | |||
|---|---|---|---|
| Census | Pop. | %± | |
| 1870 | 6,194 | — | |
| 1880 | 10,793 | 74.2% | |
| 1890 | 14,549 | 34.8% | |
| 1900 | 16,522 | 13.6% | |
| 1910 | 23,187 | 40.3% | |
| 1920 | 22,770 | −1.8% | |
| 1930 | 24,579 | 7.9% | |
| 1940 | 27,955 | 13.7% | |
| 1950 | 26,922 | −3.7% | |
| 1960 | 25,693 | −4.6% | |
| 1970 | 25,180 | −2.0% | |
| 1980 | 30,612 | 21.6% | |
| 1990 | 32,458 | 6.0% | |
| 2000 | 39,593 | 22.0% | |
| 2010 | 43,643 | 10.2% | |
| Est. 2019 | 44,428 | [5] | 1.8% |
| U.S. Decennial Census[6] 1790–1960[7] 1900–1990[8] 1990–2000[9] 2010–2018[1] | |||
2010
According to the 2010 United States Census, the population identifies by the following ethnicities:
- 84.1% White
- 9.7% Black
- 0.4% Native American
- 0.3% Asian
- 0.0% Native Hawaiian or Pacific Islander
- 1.2% Two or more races
- 7.8% Hispanic or Latino (of any race)
Chilton County is the 23rd-richest county per capita income in Alabama.[10]
2000
At the 2000 census,[11] there were 39,593 people, 15,287 households, and 11,342 families residing in the county. The population density was 57 per square mile (22/km2). There were 17,651 housing units at an average density of 25 per square mile (10/km2). The racial makeup of the county was 86.71% White, 10.61% Black or African American, 0.28% Native American, 0.18% Asian, 0.02% Pacific Islander, 1.51% from other races, and 0.69% from two or more races. Nearly 2.91% of the population were Hispanic or Latino of any race.
There were 15,287 households of which 34.40% had children under the age of 18 living with them, 60.10% were married couples living together, 10.50% had a female householder with no husband present, and 25.80% were non-families. Nearly 22.90% of all households were made up of individuals, and 10.20% had someone living alone who was 65 years of age or older. The average household size was 2.57, and the average family size was 3.00.
25.70% of the population were under the age of 18, 9.10% from 18 to 24, 29.00% from 25 to 44, 23.40% from 45 to 64, and 12.90% who were 65 years of age or older. The median age was 36 years. For every 100 females, there were 97.80 males. For every 100 females age 18 and over, there were 93.90 males.
The median household income was $32,588 and the median family income was $39,505. Males had a median income of $31,006 versus $21,275 for females. The per capita income for the county was $15,303. About 12.60% of families and 15.70% of the population were below the poverty line, including 19.40% of those under age 18 and 18.20% of those age 65 or over.
Government
The County Commission is made up of seven members elected by cumulative vote (CV). "Chilton County adopted cumulative voting in 1988 as part of the settlement of a vote dilution lawsuit brought against its previous election system. According to the 1990 Census, African Americans constituted 9.9% of the county's voting age population." Although passage of the Voting Rights Act of 1965 enabled African Americans to register and vote, in Chilton County no African American was elected to the County Commission until the first cumulative voting election, held in 1988.[12]
African Americans in Alabama had been essentially disenfranchised by the 1901 state constitution, which required payment of a poll tax and qualification by a literacy test in order to register to vote. Discriminatory in practice as administered by white officials, this system excluded most blacks from the state's political system for decades in the 20th century before Congress passed the Voting Rights Act of 1965. Since then, African Americans were able finally to register and vote in the county and state for the first time since the late 19th century.[12]
In counties in which there is a minority population and members are elected at-large or by single-member districts, minorities may be unable to elect representatives in a system dominated by the majority. The adoption of cumulative voting in Chilton County has enabled the minority to elect candidates of their choice by pooling their votes. Bobby Agee was elected as a Chilton County Commissioner in 1988 and again in the second cumulative voting election in 1992.[12] Cumulative voting depends on a multi-seat election, whether at-large or by district. "The cumulative options provide a minority of voters an opportunity to concentrate their support for a candidate or candidates more effectively than they can under the more traditional voting rules used in this country."[12] In 2014, the county commission had an African-American commissioner among its seven members. However, in 2018, the county commissioners were all white males.[13]
The commission hires a County Administrator to handle daily management of county business.
| Year | GOP | Dem | Others |
|---|---|---|---|
| 2016 | 82.1% 15,081 | 15.9% 2,911 | 2.1% 377 |
| 2012 | 79.7% 13,932 | 19.4% 3,397 | 0.9% 156 |
| 2008 | 78.5% 13,960 | 20.7% 3,674 | 0.9% 151 |
| 2004 | 76.9% 12,829 | 22.6% 3,778 | 0.5% 86 |
| 2000 | 66.7% 10,066 | 31.8% 4,806 | 1.5% 220 |
| 1996 | 55.4% 7,910 | 37.5% 5,354 | 7.1% 1,014 |
| 1992 | 56.2% 8,126 | 34.2% 4,946 | 9.7% 1,396 |
| 1988 | 69.4% 8,761 | 30.3% 3,820 | 0.3% 42 |
| 1984 | 70.5% 8,243 | 25.1% 2,934 | 4.4% 511 |
| 1980 | 57.6% 6,615 | 41.0% 4,706 | 1.4% 156 |
| 1976 | 45.5% 4,725 | 53.4% 5,550 | 1.1% 110 |
| 1972 | 82.9% 7,349 | 15.3% 1,356 | 1.8% 162 |
| 1968 | 18.0% 1,602 | 6.4% 566 | 75.6% 6,734 |
| 1964 | 76.0% 5,202 | 24.0% 1,645 | |
| 1960 | 63.9% 3,201 | 35.9% 1,798 | 0.2% 8 |
| 1956 | 61.0% 3,139 | 36.7% 1,891 | 2.3% 118 |
| 1952 | 52.9% 2,563 | 46.8% 2,269 | 0.3% 12 |
| 1948 | 44.4% 1,584 | 55.6% 1,985 | |
| 1944 | 41.0% 1,385 | 58.8% 1,984 | 0.2% 7 |
| 1940 | 42.0% 1,995 | 57.8% 2,746 | 0.2% 10 |
| 1936 | 36.2% 1,469 | 63.3% 2,565 | 0.5% 21 |
| 1932 | 47.1% 1,532 | 51.2% 1,664 | 1.8% 57 |
| 1928 | 69.4% 3,186 | 30.5% 1,402 | 0.1% 5 |
| 1924 | 63.2% 1,595 | 33.6% 848 | 3.2% 81 |
| 1920 | 69.1% 2,273 | 29.3% 962 | 1.6% 54 |
| 1916 | 59.3% 1,363 | 38.3% 881 | 2.4% 54 |
| 1912 | 6.2% 140 | 39.2% 880 | 54.6% 1,226 |
| 1908 | 54.9% 890 | 40.4% 656 | 4.7% 76 |
| 1904 | 39.1% 648 | 44.5% 738 | 16.4% 271 |
See also
References
- "State & County QuickFacts". United States Census Bureau. Archived from the original on August 9, 2014. Retrieved May 15, 2014.
- "Centers of Population by State: 2010". United States Census Bureau. Archived from the original on January 3, 2014. Retrieved May 15, 2014.
- "Central Alabama Genealogy". Retrieved April 30, 2012.
- "2010 Census Gazetteer Files". United States Census Bureau. August 22, 2012. Retrieved August 22, 2015.
- "Population and Housing Unit Estimates". Retrieved May 20, 2019.
- "U.S. Decennial Census". United States Census Bureau. Retrieved August 22, 2015.
- "Historical Census Browser". University of Virginia Library. Retrieved August 22, 2015.
- Forstall, Richard L., ed. (March 24, 1995). "Population of Counties by Decennial Census: 1900 to 1990". United States Census Bureau. Retrieved August 22, 2015.
- "Census 2000 PHC-T-4. Ranking Tables for Counties: 1990 and 2000" (PDF). United States Census Bureau. April 2, 2001. Retrieved August 22, 2015.
- "U.S. Census website". United States Census Bureau. Retrieved May 14, 2011.
- Jason Kirksey, Richard Engstrom and Edward Still, "Cumulative Voting in an Alabama County/ Shaw v. Reno and New Election Systems", "Chapter Three: Full Representation in Local Elections", Voting and Democracy Report: 1995, in Voting Rights Review of the Southern Regional Council, reprinted at FairVote website
- https://chiltoncounty.org/commission/
- "Dave Leip's Atlas of U.S. Presidential Elections". Retrieved November 16, 2016.
External links
- Official County Website
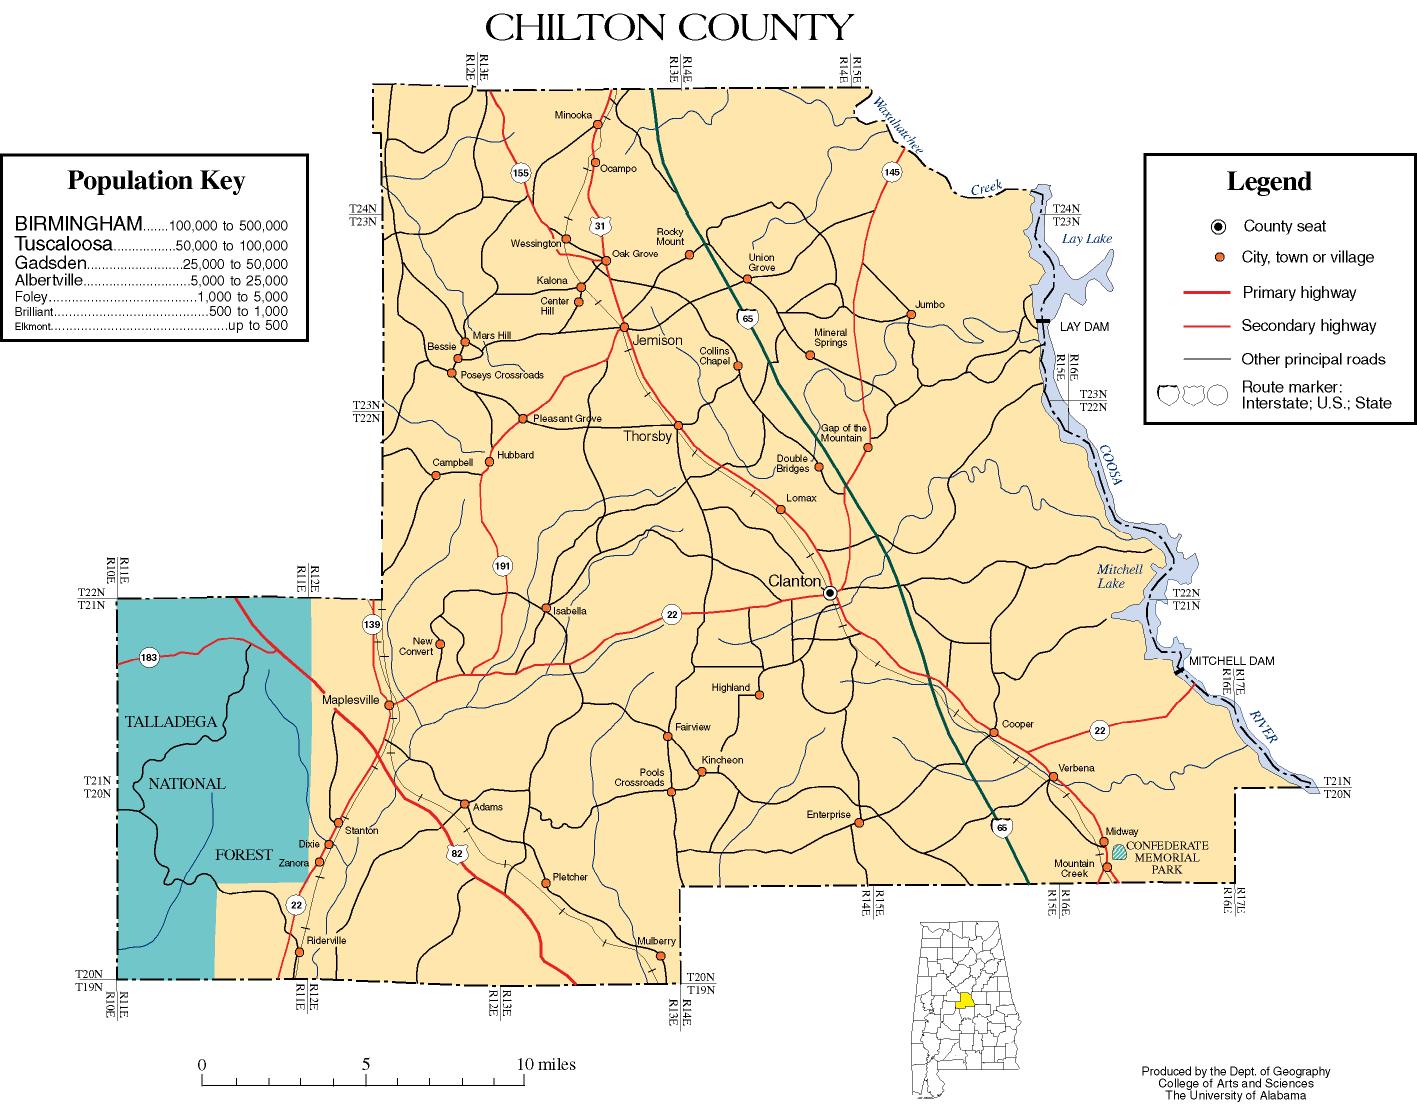
- Chilton County map of roads/towns (map © 2007 Univ. of Alabama).
Places adjacent to Chilton County, Alabama | ||||||||||
|---|---|---|---|---|---|---|---|---|---|---|
| ||||||||||
Municipalities and communities of Chilton County, Alabama, United States | ||
|---|---|---|
| Cities | Map of Alabama highlighting Chilton County | |
| Towns | ||
| Unincorporated communities | ||
| Footnotes | ‡This populated place also has portions in an adjacent county or counties | |
| Properties |
| |
|---|---|---|
See also: National Register of Historic Places listings in Chilton County, Alabama and List of National Historic Landmarks in Alabama | ||
Montgomery (capital) | ||
| Topics | ||
| Society |
| |
| Regions | ||
| Flora and fauna | ||
| Largest cities | ||
| Metros |
| |
| Counties |
| |
| Authority control |
|
|---|