York South—Weston
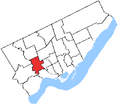
.png) York South–Weston in relation to the other Toronto ridings (2015 boundaries) | |||
| Federal electoral district | |||
| Legislature | House of Commons | ||
| MP |
Liberal | ||
| District created | 1976 | ||
| First contested | 1979 | ||
| Last contested | 2015 | ||
| District webpage | profile, map | ||
| Demographics | |||
| Population (2011)[1] | 116,606 | ||
| Electors (2015) | 69,754 | ||
| Area (km²)[1] | 26 | ||
| Pop. density (per km²) | 4,484.8 | ||
| Census divisions | Toronto | ||
| Census subdivisions | Toronto | ||
.gif)
York South—Weston (French: York-Sud—Weston) is a federal electoral district in Ontario, Canada, that has been represented in the House of Commons of Canada since 1979.[2]
Electoral district
Located in the west-end of Toronto, the riding is made up largely of the old City of York, a southwestern portion of the old city of North York, Weston, and parts of the old city of Toronto north of High Park.[2] The riding has a largely working class and immigrant population.
Its geographic boundaries are the part of the City of Toronto bounded by a line drawn from Humber River east along Highway 401, south along the Canadian National Railway situated west of Caledonia Road, west along Rogers Road, southeast along Old Weston Road, west along Lavender Road, south along Keele Street, southeast along the Canadian National/Canadian Pacific Railway, west along the Canadian Pacific Railway, and north along the Humber River to Highway 401.[2]
Former boundaries
York South—Weston was created in 1976 from parts of York South, York West, Davenport, High Park—Humber Valley, and Etobicoke ridings.[2]
Its new boundaries were originally of the part of Metropolitan Toronto bounded by a line drawn from Eglinton Avenue West north along Keele Street, west along Lawrence Avenue West, south along the Humber River, east and north along the north limit of the City of Toronto, south along Runnymede Road, east along Annette Street, south along Keele Street, east along Humberside Avenue, northwest along the Canadian National Railway, east along the north limit of the City of Toronto, north along the east side of Prospect Cemetery, and west along Eglinton Avenue West to Keele Street.[2]
In 1987, York South—Weston was redefined to consist of the parts of the cities of North York, Toronto and York bounded by a line drawn from the western limit of the City of North York east along Highway 401, south along Keele Street, west along Eglinton Avenue West, south along Keele Street, west along the southern limit of the City of York, southeast along the Canadian National Railway line, west along Dupont Street, northwest along Dundas Street West, west along Annette Street, north along Runnymede Road, west along the Canadian Pacific Railway line, and north along the western limits of the Cities of York and North York to Highway 401.[2]
In 1996, it was redefined to consist of the parts of the cities of North York, Toronto and York bounded by a line drawn from the western limit of the City of North York east along Highway 401, southeast along the Canadian National Railway situated immediately west of Caledonia Road, west along Rogers Road, south along Old Weston Road, west along the northern limit of the City of Toronto, southeast along the Canadian National Railway, west along the Canadian Pacific Railway, and north along the western limit of the cities of York and North York to Highway 401.[2]
In 2003, it was given its current boundaries as described above. This riding was unchanged during the 2012 electoral redistribution.
 1976 to 1987
 1987 to 1996
 1996 to 2003
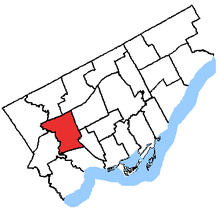 2003 to 2015
Members of Parliament
This riding has elected the following members of the House of Commons of Canada:
| Parliament | Years | Member | Party | |
|---|---|---|---|---|
| York South—Weston Riding created from York South, York West, Davenport, High Park—Humber Valley and Etobicoke |
||||
| 31st | 1979–1980 | Ursula Appolloni | Liberal | |
| 32nd | 1980–1984 | |||
| 33rd | 1984–1988 | John Nunziata | ||
| 34th | 1988–1993 | |||
| 35th | 1993–1996 | |||
| 1996–1997 | Independent | |||
| 36th | 1997–2000 | |||
| 37th | 2000–2004 | Alan Tonks | Liberal | |
| 38th | 2004–2006 | |||
| 39th | 2006–2008 | |||
| 40th | 2008–2011 | |||
| 41st | 2011–2015 | Mike Sullivan | New Democratic | |
| 42nd | 2015–Present | Ahmed Hussen | Liberal | |
Election results
In 2015, York South-Weston elected Canada's first Somali-born MP.
| Canadian federal election, 2015 | ||||||||
|---|---|---|---|---|---|---|---|---|
| Party | Candidate | Votes | % | ±% | Expenditures | |||
| Liberal | Ahmed Hussen | 20,093 | 46.0 | +13.2 | $82,886.06 | |||
| New Democratic | Mike Sullivan | 13,281 | 30.4 | -9.7 | $155,467.41 | |||
| Conservative | James Robinson | 8,399 | 19.2 | -5.1 | $16,183.98 | |||
| Libertarian | Stephen Lepone | 1,041 | 2.4 | – | $202.00 | |||
| Green | John Johnson | 892 | 2.0 | -0.8 | $455.00 | |||
| Total valid votes/Expense limit | 43,706 | 100.0 | $203,875.44 | |||||
| Total rejected ballots | 362 | 0.82 | +0.02 | |||||
| Turnout | 44,068 | 62.63 | +9.53 | |||||
| Eligible voters | 70,361 | |||||||
| Liberal gain from New Democratic | Swing | +11.45 | ||||||
| Source: Elections Canada[3][4] | ||||||||
| Canadian federal election, 2011 | ||||||||
|---|---|---|---|---|---|---|---|---|
| Party | Candidate | Votes | % | ±% | Expenditures | |||
| New Democratic | Mike Sullivan | 14,122 | 40.1 | +12.1 | – | |||
| Liberal | Alan Tonks | 11,542 | 32.8 | -13.8 | – | |||
| Conservative | Jilian Saweczko | 8,559 | 24.3 | +3.9 | – | |||
| Green | Sonny Day | 975 | 2.8 | -2.3 | – | |||
| Total valid votes/Expense limit | 35,198 | 100.0 | ||||||
| Total rejected ballots | 288 | 0.8 | +0.1 | |||||
| Turnout | 35,486 | 53.10 | +2.4 | |||||
| Eligible voters | 66,807 | – | – | |||||
| New Democratic gain from Liberal | Swing | +12.95 | ||||||
| Canadian federal election, 2008 | ||||||||
|---|---|---|---|---|---|---|---|---|
| Party | Candidate | Votes | % | ±% | Expenditures | |||
| Liberal | Alan Tonks | 16,071 | 46.6 | -10.5 | $48,748 | |||
| New Democratic | Mike Sullivan | 9,641 | 28.0 | +6.7 | $46,118 | |||
| Conservative | Aydin Cocelli | 7,021 | 20.4 | +3.0 | $27,300 | |||
| Green | Andre Papadimitriou | 1,757 | 5.1 | +1.3 | $2,977 | |||
| Total valid votes/Expense limit | 34,490 | 100.0 | $80,783 | |||||
| Total rejected ballots | 241 | 0.7 | ||||||
| Turnout | 34,731 | 50.7 | ||||||
| Liberal hold | Swing | -8.6 | ||||||
| Canadian federal election, 2006 | ||||||||
|---|---|---|---|---|---|---|---|---|
| Party | Candidate | Votes | % | ±% | Expenditures | |||
| Liberal | Alan Tonks | 22,871 | 57.06% | −2.77% | $36,134 | |||
| New Democratic | Paul Ferreira | 8,525 | 21.27% | +0.06% | $24,433 | |||
| Conservative | Stephen Halicki | 6,991 | 17.44% | +2.49% | $22,529 | |||
| Green | Maria De Angelis-Pater | 1,506 | 3.76% | +0.26% | $1,003 | |||
| Independent | Dragan Cimesa | 189 | 0.47% | – | – | |||
| Total valid votes | 40,082 | 100.0% | ||||||
| Canadian federal election, 2004 | ||||||||
|---|---|---|---|---|---|---|---|---|
| Party | Candidate | Votes | % | ±% | ||||
| Liberal | Alan Tonks | 20,537 | 59.8 | +14.2 | ||||
| New Democratic | Paul Ferreira | 7,281 | 21.2 | +17.5 | ||||
| Conservative | Stephen Halicki | 5,133 | 14.9 | +7.1 | ||||
| Green | Jessica Fracassi | 1,199 | 3.5 | +2.6 | ||||
| Communist | Shirley Hawley | 175 | 0.5 | +0.1 | ||||
| Total valid votes | 34,325 | |||||||
| Note: Conservative vote is compared to the total of the Canadian Alliance vote and Progressive Conservative vote in 2000 election. | ||||||||
| Canadian federal election, 2000 | ||||||||
|---|---|---|---|---|---|---|---|---|
| Party | Candidate | Votes | % | ±% | ||||
| Liberal | Alan Tonks | 15,841 | 45.6 | +12.2 | ||||
| Independent | John Nunziata | 14,344 | 41.3 | -3.7 | ||||
| Alliance | Dan Houssar | 1,754 | 5.0 | -1.2 | ||||
| New Democratic | Tom Parkin | 1,288 | 3.7 | -5.6 | ||||
| Progressive Conservative | Jason Daniel Baker | 986 | 2.8 | -2.2 | ||||
| Green | Denis Calnan | 293 | 0.8 | +0.4 | ||||
| Communist | Hassan Husseini | 130 | 0.4 | +0.1 | ||||
| Marxist–Leninist | Anna Dicarlo | 102 | 0.3 | 0.0 | ||||
| Total valid votes | 34,738 | 100.0 | ||||||
Note: Canadian Alliance vote is compared to the Reform vote in 1997 election.
| Canadian federal election, 1997 | ||||||||
|---|---|---|---|---|---|---|---|---|
| Party | Candidate | Votes | % | ±% | ||||
| Independent | John Nunziata | 17,163 | 45.0 | |||||
| Liberal | Judy Sgro | 12,732 | 33.4 | -36.7 | ||||
| New Democratic | Odoardo Di Santo | 3,552 | 9.3 | +3.9 | ||||
| Reform | Kathleen Crone | 2,363 | 6.2 | -8.6 | ||||
| Progressive Conservative | Jan Harnett | 1,925 | 5.1 | -1.8 | ||||
| Green | Shelley Lipsey | 171 | 0.4 | |||||
| Marxist–Leninist | Ginette Boutet | 112 | 0.3 | +0.1 | ||||
| Independent | Hassan Husseini | 98 | 0.3 | |||||
| Total valid votes | 38,116 | 100.0 | ||||||
| Canadian federal election, 1993 | ||||||||
|---|---|---|---|---|---|---|---|---|
| Party | Candidate | Votes | % | ±% | ||||
| Liberal | John Nunziata | 23,919 | 70.1 | +16.4 | ||||
| Reform | Kathleen Crone | 5,047 | 14.8 | |||||
| Progressive Conservative | Tony Figliano | 2,332 | 6.8 | -14.8 | ||||
| New Democratic | Sil Salvaterra | 1,864 | 5.5 | -17.7 | ||||
| Natural Law | Greg W. Roberts | 265 | 0.8 | |||||
| Libertarian | Roma Kelembet | 261 | 0.8 | 0.0 | ||||
| Independent | Danny Red Goldstick | 119 | 0.3 | |||||
| Abolitionist | Philip Scott Carter | 88 | 0.3 | |||||
| Commonwealth of Canada | Felix Duda | 80 | 0.2 | 0.0 | ||||
| Independent | Peter Hones | 71 | 0.2 | |||||
| Marxist–Leninist | Heather Robertson | 68 | 0.2 | |||||
| Total valid votes | 34,114 | 100.0 | ||||||
| Canadian federal election, 1988 | ||||||||
|---|---|---|---|---|---|---|---|---|
| Party | Candidate | Votes | % | ±% | ||||
| Liberal | John Nunziata | 21,111 | 53.7 | +16.0 | ||||
| New Democratic | Steve Krashinsky | 9,095 | 23.1 | -7.9 | ||||
| Progressive Conservative | Carlo Testa | 8,488 | 21.6 | -7.0 | ||||
| Libertarian | Clifford Trewin | 295 | 0.8 | 0.0 | ||||
| Communist | Omar Latif | 210 | 0.5 | +0.1 | ||||
| Commonwealth of Canada | Myrtle Thompson | 105 | 0.3 | |||||
| Total valid votes | 39,304 | 100.0 | ||||||
| Canadian federal election, 1984 | ||||||||
|---|---|---|---|---|---|---|---|---|
| Party | Candidate | Votes | % | ±% | ||||
| Liberal | John Nunziata | 14,217 | 37.7 | -2.5 | ||||
| New Democratic | Steve Krashinsky | 11,679 | 31.0 | +2.8 | ||||
| Progressive Conservative | Carlo Testa | 10,789 | 28.6 | -1.7 | ||||
| Independent | Mike Luczkiw | 526 | 1.4 | |||||
| Libertarian | Myron Petriw | 281 | 0.7 | -0.2 | ||||
| Communist | Mike Phillips | 174 | 0.5 | |||||
| Total valid votes | 37,666 | 100.0 | ||||||
| Canadian federal election, 1980 | ||||||||
|---|---|---|---|---|---|---|---|---|
| Party | Candidate | Votes | % | ±% | ||||
| Liberal | Ursula Appolloni | 16,520 | 47.2 | +7.0 | ||||
| New Democratic | Vince Del Buono | 9,280 | 26.5 | -1.7 | ||||
| Progressive Conservative | John Oostrom | 8,711 | 24.9 | -5.4 | ||||
| Libertarian | George Dance | 299 | 0.9 | -0.1 | ||||
| Communist | Mike Phillips | 99 | 0.3 | |||||
| Marxist–Leninist | Barbara Nunn | 82 | 0.2 | -0.1 | ||||
| Total valid votes | 34,991 | 100.0 | ||||||
| Canadian federal election, 1979 | ||||||||
|---|---|---|---|---|---|---|---|---|
| Party | Candidate | Votes | % | |||||
| Liberal | Ursula Appolloni | 14,913 | 40.2 | |||||
| Progressive Conservative | John Oostrom | 11,236 | 30.3 | |||||
| New Democratic | Vito Cautillo | 10,451 | 28.2 | |||||
| Libertarian | Maria Sproule | 336 | 0.9 | |||||
| Marxist–Leninist | Tim Sullivan | 117 | 0.3 | |||||
| Total valid votes | 37,053 | 100.0 | ||||||
Toronto Council Wards 11 and 12
Etobicoke North is also the name for two wards on Toronto City Council each represented by a city councillor:
- (Ward 11) York South - Weston - current councillor Frances Nunziata
- (Ward 12) York South - Weston - current councillor Frank Di Giorgio
The combined ward boundaries roughly corresponds to the federal electoral district.
See also
References
- "(Code 35105) Census Profile". 2011 census. Statistics Canada. 2012. Retrieved 2011-03-03.
Notes
- 1 2 Statistics Canada: 2012
- 1 2 3 4 5 6 7 "York South Weston electoral boundaries". Elections Canada, Government of Canada. 2007. Retrieved 2007-01-29.
- ↑ Elections Canada – Confirmed candidates for York South—Weston, 30 September 2015
- ↑ Elections Canada – Preliminary Election Expenses Limits for Candidates
External links
- York South-Weston history from the Parliament of Canada website includes election results and evolving boundary descriptions.
- 2011 results from Elections Canada
- Campaign expense data from Elections Canada