United States presidential election in Arkansas, 1988
|
| ||||||||||||||||||||||||||
| ||||||||||||||||||||||||||
| ||||||||||||||||||||||||||
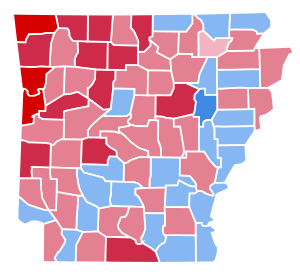 County Results
| ||||||||||||||||||||||||||
| ||||||||||||||||||||||||||

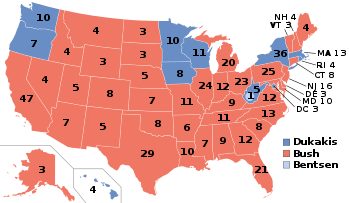
The 1988 United States presidential election in Arkansas took place on November 8, 1988. All fifty states and the District of Columbia, were part of the 1988 United States presidential election. Arkansas voters chose six electors to the Electoral College, which selected the president and vice president.
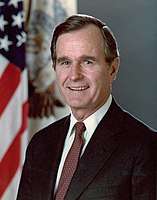
Arkansas was won by incumbent United States Vice President George H. W. Bush of Texas, who was running against Massachusetts Governor Michael Dukakis. Bush ran with Indiana Senator Dan Quayle as Vice President, and Dukakis ran with Texas Senator Lloyd Bentsen.
Arkansas weighed in for this election as 6 percentage points more Republican than the national average.
Partisan background
The presidential election of 1988 was a very partisan election for Arkansas, with nearly 99 percent of the electorate voting for either the Democratic or Republican parties.[1] The vast majority of the counties voted primarily Republican, including the highly populated center of Pulaski County. As of the 2016 presidential election this stands as the last election in which Pulaski County and Crittenden County voted for a Republican presidential candidate.[2]
In typical form for the time, the southeastern portion of the state, including counties such as Desha and Phillips continued to turn out primarily Democratic during this election. This region is part of the Mississippi Delta and of the "Black Belt" and is characterised by dark rich soils and a large, formerly slave African-American population.
Republican victory
Bush won the election in Arkansas with a solid 14 point landslide. Arkansas continued on in this election as a component of the conservative stronghold of the Deep South. The election results in Arkansas are reflective of a nationwide reconsolidation of base for the Republican Party, which took place through the 1980s. Through the passage of some very controversial economic programs, spearheaded by then President Ronald Reagan (called, collectively, "Reaganomics"), the mid-to-late 1980s saw a period of economic growth and stability. The hallmark for Reaganomics was, in part, the wide-scale deregulation of corporate interests, and tax cuts for the wealthy.[3]
Dukakis ran on a socially liberal platform, and advocated for higher economic regulation and environmental protection. Bush, alternatively, ran on a campaign of continuing the social and economic policies of former President Reagan - which gained him much support with social conservatives and people living in rural areas. Additionally, while the economic programs passed under Reagan, and furthered under Bush and Clinton, may have boosted the economy for a brief period, they are criticized by many analysts as "setting the stage" for economic troubles in the United State after 2007, such as the Great Recession.[4]
| Elections in Arkansas | ||||||||||
|---|---|---|---|---|---|---|---|---|---|---|
 | ||||||||||
|
||||||||||
Results
| United States presidential election in Arkansas, 1988 | |||||
|---|---|---|---|---|---|
| Party | Candidate | Votes | Percentage | Electoral votes | |
| Republican | George H. W. Bush | 466,578 | 56.37% | 6 | |
| Democratic | Michael Dukakis | 349,237 | 42.19% | 0 | |
| Independent | David Duke | 5,146 | 0.62% | 0 | |
| Independent | Ron Paul | 3,297 | 0.40% | 0 | |
| Independent | Lenora Fulani | 2,161 | 0.26% | 0 | |
| Independent | Earl Dodge | 1,319 | 0.16% | 0 | |
| Totals | 827,738 | 100.0% | 6 | ||
Results by county
| George Herbert Walker Bush Republican |
Michael Stanley Dukakis Democratic |
Various candidates Other parties |
Margin | Total votes cast | |||||
|---|---|---|---|---|---|---|---|---|---|
| County | # | % | # | % | # | % | # | % | # |
| Arkansas | 4,007 | 55.61% | 3,075 | 42.68% | 123 | 1.71% | 932 | 12.94% | 7,205 |
| Ashley | 4,111 | 47.48% | 4,466 | 51.58% | 82 | 0.95% | -355 | -4.10% | 8,659 |
| Baxter | 8,614 | 63.35% | 4,808 | 35.36% | 175 | 1.29% | 3,806 | 27.99% | 13,597 |
| Benton | 24,295 | 71.23% | 9,399 | 27.55% | 416 | 1.22% | 14,896 | 43.67% | 34,110 |
| Boone | 7,567 | 64.04% | 3,998 | 33.84% | 251 | 2.12% | 3,569 | 30.20% | 11,816 |
| Bradley | 2,089 | 48.93% | 2,167 | 50.76% | 13 | 0.30% | -78 | -1.83% | 4,269 |
| Calhoun | 1,316 | 56.14% | 1,024 | 43.69% | 4 | 0.17% | 292 | 12.46% | 2,344 |
| Carroll | 4,553 | 62.77% | 2,632 | 36.29% | 68 | 0.94% | 1,921 | 26.49% | 7,253 |
| Chicot | 1,901 | 43.74% | 2,426 | 55.82% | 19 | 0.44% | -525 | -12.08% | 4,346 |
| Clark | 3,389 | 41.69% | 4,675 | 57.50% | 66 | 0.81% | -1,286 | -15.82% | 8,130 |
| Clay | 2,766 | 44.33% | 3,442 | 55.16% | 32 | 0.51% | -676 | -10.83% | 6,240 |
| Cleburne | 4,932 | 58.85% | 3,404 | 40.62% | 45 | 0.54% | 1,528 | 18.23% | 8,381 |
| Cleveland | 1,462 | 50.75% | 1,404 | 48.73% | 15 | 0.52% | 58 | 2.01% | 2,881 |
| Columbia | 5,810 | 59.27% | 3,706 | 37.81% | 286 | 2.92% | 2,104 | 21.47% | 9,802 |
| Conway | 4,066 | 49.35% | 4,134 | 50.18% | 39 | 0.47% | -68 | -0.83% | 8,239 |
| Craighead | 11,887 | 54.99% | 9,083 | 42.02% | 645 | 2.98% | 2,804 | 12.97% | 21,615 |
| Crawford | 9,092 | 70.85% | 3,582 | 27.91% | 158 | 1.23% | 5,510 | 42.94% | 12,832 |
| Crittenden | 7,441 | 51.73% | 6,702 | 46.59% | 241 | 1.68% | 739 | 5.14% | 14,384 |
| Cross | 3,186 | 51.29% | 2,989 | 48.12% | 37 | 0.60% | 197 | 3.17% | 6,212 |
| Dallas | 1,947 | 49.19% | 1,990 | 50.28% | 21 | 0.53% | -43 | -1.09% | 3,958 |
| Desha | 2,334 | 42.94% | 2,859 | 52.60% | 242 | 4.45% | -525 | -9.66% | 5,435 |
| Drew | 2,995 | 53.29% | 2,578 | 45.87% | 47 | 0.84% | 417 | 7.42% | 5,620 |
| Faulkner | 10,678 | 58.42% | 7,302 | 39.95% | 299 | 1.64% | 3,376 | 18.47% | 18,279 |
| Franklin | 3,588 | 58.93% | 2,458 | 40.37% | 43 | 0.71% | 1,130 | 18.56% | 6,089 |
| Fulton | 1,918 | 48.47% | 2,018 | 51.00% | 21 | 0.53% | -100 | -2.53% | 3,957 |
| Garland | 19,281 | 60.93% | 11,406 | 36.05% | 955 | 3.02% | 7,875 | 24.89% | 31,642 |
| Grant | 2,717 | 55.40% | 2,142 | 43.68% | 45 | 0.92% | 575 | 11.73% | 4,904 |
| Greene | 5,161 | 50.06% | 5,065 | 49.13% | 84 | 0.81% | 96 | 0.93% | 10,310 |
| Hempstead | 3,938 | 50.49% | 3,841 | 49.25% | 20 | 0.26% | 97 | 1.24% | 7,799 |
| Hot Spring | 4,181 | 44.46% | 5,090 | 54.12% | 134 | 1.42% | -909 | -9.67% | 9,405 |
| Howard | 2,510 | 57.87% | 1,818 | 41.92% | 9 | 0.21% | 692 | 15.96% | 4,337 |
| Independence | 6,637 | 59.22% | 4,523 | 40.36% | 48 | 0.43% | 2,114 | 18.86% | 11,208 |
| Izard | 2,824 | 51.19% | 2,652 | 48.07% | 41 | 0.74% | 172 | 3.12% | 5,517 |
| Jackson | 3,049 | 41.90% | 4,199 | 57.71% | 28 | 0.38% | -1,150 | -15.81% | 7,276 |
| Jefferson | 12,520 | 42.08% | 16,664 | 56.01% | 568 | 1.91% | -4,144 | -13.93% | 29,752 |
| Johnson | 4,046 | 58.29% | 2,818 | 40.60% | 77 | 1.11% | 1,228 | 17.69% | 6,941 |
| Lafayette | 1,860 | 48.95% | 1,915 | 50.39% | 25 | 0.66% | -55 | -1.45% | 3,800 |
| Lawrence | 3,205 | 49.91% | 3,179 | 49.51% | 37 | 0.58% | 26 | 0.40% | 6,421 |
| Lee | 1,863 | 38.72% | 2,878 | 59.81% | 71 | 1.48% | -1,015 | -21.09% | 4,812 |
| Lincoln | 1,557 | 41.04% | 2,204 | 58.09% | 33 | 0.87% | -647 | -17.05% | 3,794 |
| Little River | 2,347 | 45.85% | 2,740 | 53.53% | 32 | 0.63% | -393 | -7.68% | 5,119 |
| Logan | 2,203 | 62.87% | 1,254 | 35.79% | 47 | 1.34% | 949 | 27.08% | 3,504 |
| Lonoke | 7,215 | 59.68% | 4,786 | 39.59% | 89 | 0.74% | 2,429 | 20.09% | 12,090 |
| Madison | 3,067 | 58.72% | 2,106 | 40.32% | 50 | 0.96% | 961 | 18.40% | 5,223 |
| Marion | 2,993 | 57.80% | 2,033 | 39.26% | 152 | 2.94% | 960 | 18.54% | 5,178 |
| Miller | 7,110 | 56.30% | 5,437 | 43.05% | 82 | 0.65% | 1,673 | 13.25% | 12,629 |
| Mississippi | 7,841 | 52.67% | 6,759 | 45.40% | 288 | 1.93% | 1,082 | 7.27% | 14,888 |
| Monroe | 1,862 | 46.88% | 2,052 | 51.66% | 58 | 1.46% | -190 | -4.78% | 3,972 |
| Montgomery | 1,752 | 55.99% | 1,362 | 43.53% | 15 | 0.48% | 390 | 12.46% | 3,129 |
| Nevada | 1,714 | 49.55% | 1,732 | 50.07% | 13 | 0.38% | -18 | -0.52% | 3,459 |
| Newton | 2,504 | 62.00% | 1,489 | 36.87% | 46 | 1.14% | 1,015 | 25.13% | 4,039 |
| Ouachita | 6,297 | 52.29% | 5,229 | 43.42% | 517 | 4.29% | 1,068 | 8.87% | 12,043 |
| Perry | 1,627 | 52.01% | 1,470 | 46.99% | 31 | 0.99% | 157 | 5.02% | 3,128 |
| Phillips | 3,892 | 39.47% | 5,580 | 56.59% | 389 | 3.94% | -1,688 | -17.12% | 9,861 |
| Pike | 2,105 | 55.44% | 1,681 | 44.27% | 11 | 0.29% | 424 | 11.17% | 3,797 |
| Poinsett | 3,644 | 48.16% | 3,873 | 51.19% | 49 | 0.65% | -229 | -3.03% | 7,566 |
| Polk | 4,099 | 62.15% | 2,390 | 36.24% | 106 | 1.61% | 1,709 | 25.91% | 6,595 |
| Pope | 10,084 | 66.68% | 4,941 | 32.67% | 98 | 0.65% | 5,143 | 34.01% | 15,123 |
| Prairie | 1,947 | 53.25% | 1,688 | 46.17% | 21 | 0.57% | 259 | 7.08% | 3,656 |
| Pulaski | 70,562 | 54.98% | 55,857 | 43.53% | 1,914 | 1.49% | 14,705 | 11.46% | 128,333 |
| Randolph | 2,560 | 47.25% | 2,781 | 51.33% | 77 | 1.42% | -221 | -4.08% | 5,418 |
| St. Francis | 4,298 | 47.86% | 4,656 | 51.85% | 26 | 0.29% | -358 | -3.99% | 8,980 |
| Saline | 12,353 | 58.89% | 8,436 | 40.22% | 188 | 0.90% | 3,917 | 18.67% | 20,977 |
| Scott | 2,507 | 58.82% | 1,707 | 40.05% | 48 | 1.13% | 800 | 18.77% | 4,262 |
| Searcy | 2,743 | 66.21% | 1,340 | 32.34% | 60 | 1.45% | 1,403 | 33.86% | 4,143 |
| Sebastian | 24,426 | 70.94% | 9,684 | 28.13% | 322 | 0.94% | 14,742 | 42.81% | 34,432 |
| Sevier | 2,254 | 52.09% | 2,037 | 47.08% | 36 | 0.83% | 217 | 5.02% | 4,327 |
| Sharp | 3,623 | 54.79% | 2,955 | 44.69% | 34 | 0.51% | 668 | 10.10% | 6,612 |
| Stone | 2,186 | 55.17% | 1,728 | 43.61% | 48 | 1.21% | 458 | 11.56% | 3,962 |
| Union | 10,581 | 61.32% | 5,931 | 34.37% | 744 | 4.31% | 4,650 | 26.95% | 17,256 |
| Van Buren | 3,562 | 57.37% | 2,607 | 41.99% | 40 | 0.64% | 955 | 15.38% | 6,209 |
| Washington | 23,601 | 64.38% | 12,557 | 34.25% | 500 | 1.36% | 11,044 | 30.13% | 36,658 |
| White | 11,094 | 60.84% | 6,957 | 38.15% | 183 | 1.00% | 4,137 | 22.69% | 18,234 |
| Woodruff | 1,097 | 36.16% | 1,924 | 63.41% | 13 | 0.43% | -827 | -27.26% | 3,034 |
| Yell | 3,535 | 55.84% | 2,763 | 43.64% | 33 | 0.52% | 772 | 12.19% | 6,331 |
| Totals | 466,578 | 56.37% | 349,237 | 42.19% | 11,923 | 1.44% | 117,341 | 14.18% | 827,738 |
See also
References
- ↑ "1988 Presidential General Election Results — Arkansas". Dave Leip's Atlas of U.S. Presidential Elections. Retrieved 2018-01-26.
- ↑ Sullivan, Robert David; ‘How the Red and Blue Map Evolved Over the Past Century’; America Magazine in The National Catholic Review; June 29, 2016
- ↑ "Since 1980s, the Kindest of Tax Cuts for the Rich". The New York Times. 2012-01-18. Retrieved 2013-07-21.
- ↑ Jerry Lanson (2008-11-06). "A historic victory. A changed nation. Now, can Obama deliver?". Christian Science Monitor. Retrieved 2013-07-21.