West Oxfordshire District Council election, 2016
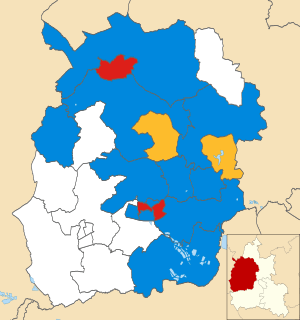
2016 local election results in West Oxfordshire
The 2016 West Oxfordshire District Council election was held on 5 May 2016 to elect members of West Oxfordshire District Council in England.[1][2] This was on the same day as other local elections.
Elections were held for 17 of the 49 seats on the council. No seats changed hands. The Conservative Party held 12 seats, the Labour Party held three seats and the Liberal Democrats held two seats. The Conservatives remained in overall control of the council with a total of 41 seats. The Labour Party and Liberal Democrats remained in opposition with four seats each.[3]
Ward results
Chadlington and Churchill
| Party | Candidate | Votes | % | ± | |
|---|---|---|---|---|---|
| Conservative | Terence Neil Owen | 421 | |||
| Green | Celia Jocelyn Kerslake | 84 | |||
| Labour | Aaron James Michael Miles | 66 | |||
| Liberal Democrat | Ivan Aguado Melet | 70 | |||
| Turnout | 41.18% | ||||
| Majority | 351 | ||||
| Conservative hold | Swing | ||||
Charlbury and Finstock
| Party | Candidate | Votes | % | ± | |
|---|---|---|---|---|---|
| Conservative | Paul John Honey | 318 | |||
| Green | Harriet Lorna Mary Kopinska | 76 | |||
| Labour | Ruth Helen Smith | 77 | |||
| Liberal Democrat | Liz Leffman | 944 | |||
| UKIP | Stephen Howell Nash | 31 | |||
| Turnout | 48.17% | ||||
| Majority | 626 | ||||
| Liberal Democrat hold | Swing | ||||
Chipping Norton
| Party | Candidate | Votes | % | ± | |
|---|---|---|---|---|---|
| Conservative | Clare Percival | 856 | |||
| Green | Paulo Von Zschock | 59 | |||
| Labour | Geoff Saul | 1008 | |||
| Liberal Democrat | Chris Tatton | 58 | |||
| UKIP | Neil David Cartwright | 109 | |||
| Turnout | 43.56% | ||||
| Majority | 152 | ||||
| Labour hold | Swing | ||||
Eynsham and Cassington
| Party | Candidate | Votes | % | ± | |
|---|---|---|---|---|---|
| Conservative | Edward Humfrey James | 688 | |||
| Green | Nicholas Goodwin | 248 | |||
| Labour | Elsa Louise Dawson | 494 | |||
| Liberal Democrat | William Harry Griffiths | 358 | |||
| Turnout | 37.47% | ||||
| Majority | 194 | ||||
| Conservative hold | Swing | ||||
Freeland and Hanborough
| Party | Candidate | Votes | % | ± | |
|---|---|---|---|---|---|
| Conservative | Carol Elizabeth Reynolds | 613 | |||
| Green | Alex Simon Friend | 158 | |||
| Labour | Sian Priscilla Florence O’Neill | 158 | |||
| Liberal Democrat | Mike Baggaley | 225 | |||
| UKIP | Barclay Ronald Lawrence | 143 | |||
| Turnout | 37.75% | ||||
| Majority | 388 | ||||
| Conservative hold | Swing | ||||
Hailey, Minster Lovell and Leafield
| Party | Candidate | Votes | % | ± | |
|---|---|---|---|---|---|
| Conservative | Warwick David Robinson | 450 | |||
| Green | Andy Wright | 71 | |||
| Independent | Graham Albert Lawrence Knaggs | 399 | |||
| Labour | Aaron Marc Bennett | 123 | |||
| Liberal Democrat | Christopher John Blount | 151 | |||
| Turnout | 37.85% | ||||
| Majority | 299 | ||||
| Conservative hold | Swing | ||||
Kingham, Rollright and Enstone
| Party | Candidate | Votes | % | ± | |
|---|---|---|---|---|---|
| Conservative | Nigel George Colston | 677 | |||
| Green | David James Chanter | 102 | |||
| Labour | Moira Christine Swann | 185 | |||
| Liberal Democrat | Glena Elizabeth Edna Chadwick | 95 | |||
| UKIP | Jim Stanley | 137 | |||
| Turnout | 37.87% | ||||
| Majority | 3179 | ||||
| Conservative hold | Swing | ||||
Milton-Under-Wychwood
| Party | Candidate | Votes | % | ± | |
|---|---|---|---|---|---|
| Conservative | Jeffrey Haine | 477 | |||
| Green | Rosanna Pearson | 48 | |||
| Labour | Andrew Lawrence Ferrero | 67 | |||
| Liberal Democrat | Matthew Gordon-Banks | 106 | |||
| Turnout | 41.72% | ||||
| Majority | 371 | ||||
| Conservative hold | Swing | ||||
North Leigh
| Party | Candidate | Votes | % | ± | |
|---|---|---|---|---|---|
| Conservative | Harry St John | 430 | |||
| Green | Stuart Sutherland MacDonald | 69 | |||
| Labour | Judith Frances Wardle | 143 | |||
| Liberal Democrat | Gillian Elizabeth Workman | 28 | |||
| Turnout | 43.84% | ||||
| Majority | 287 | ||||
| Conservative hold | Swing | ||||
Standlake, Aston and Stanton Harcourt
| Party | Candidate | Votes | % | ± | |
|---|---|---|---|---|---|
| Conservative | Elizabeth Hilary Northcote Fenton | 670 | |||
| Green | Alma Ann Tumilowicz | 91 | |||
| Labour | Dave Wesson | 134 | |||
| Liberal Democrat | Andrew Edward Crick | 122 | |||
| UKIP | Kenneth Robert Clark | 176 | |||
| Turnout | 35.95% | ||||
| Majority | 494 | ||||
| Conservative hold | Swing | ||||
Stonesfield and Tackley
| Party | Candidate | Votes | % | ± | |
|---|---|---|---|---|---|
| Conservative | Richard John Michael Bishop | 675 | |||
| Green | Maurice Fantato | 128 | |||
| Labour | David John Baldwin | 277 | |||
| Liberal Democrat | Mark Mann | 141 | |||
| Turnout | 38.58% | ||||
| Majority | 398 | ||||
| Conservative hold | Swing | ||||
Witney Central
| Party | Candidate | Votes | % | ± | |
|---|---|---|---|---|---|
| Conservative | Chris Holliday | 422 | |||
| Labour | Andrew Stanley Coles | 781 | |||
| Liberal Democrat | Edward Mortimer | 66 | |||
| Turnout | 32.89% | ||||
| Majority | 359 | ||||
| Labour hold | Swing | ||||
Witney East
| Party | Candidate | Votes | % | ± | |
|---|---|---|---|---|---|
| Conservative | Suzanne Elizabeth Bartington | 919 | |||
| Green | Nick Owen | 106 | |||
| Labour | Duncan Shaw Thomas Enright | 997 | |||
| Liberal Democrat | Carl Martin Rylett | 55 | |||
| Turnout | 35.92% | ||||
| Majority | 78 | ||||
| Labour hold | Swing | ||||
Witney North
| Party | Candidate | Votes | % | ± | |
|---|---|---|---|---|---|
| Conservative | Toby Jacob Morris | 442 | |||
| Green | Brigitte Anne Hickman | 201 | |||
| Labour | Trevor Ian License | 222 | |||
| Liberal Democrat | Diane West | 158 | |||
| Turnout | 32.48% | ||||
| Majority | 200 | ||||
| Conservative hold | Swing | ||||
Witney South
| Party | Candidate | Votes | % | ± | |
|---|---|---|---|---|---|
| Conservative | Jane Michelle Doughty | 673 | |||
| Green | Rhys Emmanuel John Danino | 125 | |||
| Labour | Stephen Parkinson | 456 | |||
| Liberal Democrat | Kate Southey | 116 | |||
| Turnout | 29.07% | ||||
| Majority | 217 | ||||
| Conservative hold | Swing | ||||
Witney West
| Party | Candidate | Votes | % | ± | |
|---|---|---|---|---|---|
| Conservative | Louise Jane Chapman | 524 | |||
| Green | Andy King | 83 | |||
| Labour | Calvert Charles Stuart McGibbon | 224 | |||
| Liberal Democrat | Emma De Launey Tatton | 48 | |||
| Turnout | 27.96% | ||||
| Majority | 300 | ||||
| Conservative hold | Swing | ||||
Woodstock and Bladon
| Party | Candidate | Votes | % | ± | |
|---|---|---|---|---|---|
| Conservative | Jill Rosemary Dunsmore | 600 | |||
| Green | Paul Dominic Creighton | 93 | |||
| Labour | Christopher Charles Johnson | 132 | |||
| Liberal Democrat | Elizabeth Margaret Embree Poskitt | 617 | |||
| Turnout | 44.96% | ||||
| Majority | 17 | ||||
| Liberal Democrat hold | Swing | ||||
References
- ↑ "Guide to May 2016 elections in Scotland, Wales, England and Northern Ireland". BBC News. Retrieved 21 April 2016.
- ↑ "Future elections". West Oxfordshire District Council. Retrieved 22 April 2016.
- ↑ "West Oxfordshire District Council Election Results – Thursday, 5th May 2016". West Oxfordshire District Council Election Results 2011–2018 (PDF). West Oxfordshire District Council. pp. 7–8. Retrieved 4 May 2018.
This article is issued from
Wikipedia.
The text is licensed under Creative Commons - Attribution - Sharealike.
Additional terms may apply for the media files.