Colchester Borough Council election, 2016
|
| |||||||||||||||||||||||||||||||||||||||||||||||
| |||||||||||||||||||||||||||||||||||||||||||||||
All 51 seats to Colchester Borough Council 26 seats needed for a majority | |||||||||||||||||||||||||||||||||||||||||||||||
|---|---|---|---|---|---|---|---|---|---|---|---|---|---|---|---|---|---|---|---|---|---|---|---|---|---|---|---|---|---|---|---|---|---|---|---|---|---|---|---|---|---|---|---|---|---|---|---|
| Turnout | 36.0% | ||||||||||||||||||||||||||||||||||||||||||||||
| |||||||||||||||||||||||||||||||||||||||||||||||
| |||||||||||||||||||||||||||||||||||||||||||||||
Elections to Colchester Borough Council took place on 5 May 2016. Colchester Borough Council normally elects one third of its councillors each year, however, due to boundary changes, the whole council is up for election.
Prior to this election, the cabinet (8 seats) was held by a coalition including the Liberal Democrats (5 seats), the Labour Party (2 seats) and a Highwoods & Stanway Independent (1 seat). Paul Smith (Liberal Democrat), a councillor from St. John's ward, was elected Leader of the Council by 32 to 28 votes.
Each voter had three available votes instead of the usual one vote.
Background
Following the 2015 election the Liberal Democrat-Labour-Independent coalition maintained control of the Council, although with a much reduced majority (14 to 4). The Liberal Democrats suffered heavy losses in North and West Colchester with 4 councillors being unseated, all by the Conservative Party. The Conservatives subsequently became the largest party on the Council but short of a majority by 4 councillors. Although failing to win additional seats, the Labour Party made moderate gains in vote share across the Borough. Following a promising performance at the 2014 election, the UK Independence Party failed to build on their success and lost in vote share across Colchester, failing to take a single ward. Like UKIP, and despite a notable boost in local and national membership, the Green Party of England and Wales also fell in vote share and failed to win any seats. However, both UKIP and the Green Party received the highest number of votes for their respective parties in a Colchester local election.
Prior to the election, Independent member for Stanway, Laura Sykes, resigned her post as Borough Councillor due to moving away from the area. This left the ruling coalition with a majority of 3 over the Conservative group.
Boundary Changes
A boundary review was undertaken throughout 2014/2015 as part of a review of local authority electoral wards. The new electoral wards have taken effect from this election reducing the number of councillors by 9 (from 60 to 51), reducing the number of wards by 10 (from 27 to 17) and standardising the number of councillors representing each ward (3 councillors per ward). Each ward is designed to contain approximately 8,000 electors, taking into account the projected population growth over the next 10 years.[1]
Candidates by Party
Results Summary
| Party | Seats | Gains | Losses | Net gain/loss | Seats % | Votes % | Votes | +/− | |
|---|---|---|---|---|---|---|---|---|---|
| Conservative | 22 | 1 | 6 | 43.1 | 37.5 | 47,088 | -2.6 | ||
| Liberal Democrat | 15 | 2 | 7 | 29.4 | 22.6 | 28,331 | +2.8 | ||
| Labour | 11 | 2 | 0 | 21.6 | 22.2 | 27,846 | +3.8 | ||
| Independent | 3 | 0 | 0 | 5.9 | 4.1 | 5,079 | +1.7 | ||
| Green | 0 | 0 | 0 | 0.0 | 9.7 | 12,046 | +1.5 | ||
| UKIP | 0 | 0 | 0 | 0.0 | 4.1 | 5,129 | -7.0 | ||
The total number of seats on the council was reduced from 60 to 51 seats, resulting in a nominal loss of 5 Conservative and 4 Liberal Democrats councillors. This is reflected in the changes in seats.
Council Composition
Prior to the election the composition of the council was:
| 20 | 9 | 3 | 27 |
| Liberal Democrats | Labour | Ind | Conservative |
After the election, the composition of the council was:
| 15 | 11 | 3 | 22 |
| Liberal Democrats | Labour | Ind | Conservative |
Ward Results
Due to boundary changes the number of wards was reduced from 27 to 17. Each ward is represented by 3 councillors. The length of an elected councillor's term will depend on the position of election within that ward (1st, 4 years; 2nd, 3 years; 3rd, 2 years). Terms will revert to 4-years as standard from the 2018 election.
The Statement of Nominated Persons was released by Colchester Borough Council's Returning Officer following the closing of nominations on 7 April 2016. This detailed the list of candidates nominated to stand in each ward.
Incumbent councillors are marked with an asterisk*
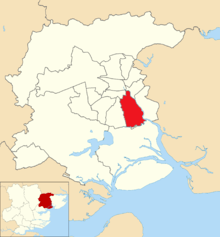
Berechurch

| Party | Candidate | Votes | % | ||
|---|---|---|---|---|---|
| Labour | Dave Harris* | 1,710 | 27.4 | ||
| Labour | Chris Pearson* | 1,283 | 20.5 | ||
| Labour | Martyn Warnes | 1,206 | 19.3 | ||
| Conservative | Annabel Glayzer | 366 | 5.9 | ||
| Conservative | Michael Brown | 359 | 5.7 | ||
| Conservative | Chris Brown | 356 | 5.7 | ||
| UKIP | Ralph Morse | 353 | 5.6 | ||
| Liberal Democrat | Katie Hood | 181 | 2.9 | ||
| Liberal Democrat | George Penny | 155 | 2.5 | ||
| Liberal Democrat | Jakub Makowski | 144 | 2.3 | ||
| Green | Sam Borley | 142 | 2.3 | ||
| Turnout | 2,361 | 32.4 | |||
| Labour hold | |||||
| Labour hold | |||||
| Labour hold | |||||
| Top-candidate result | % | +/- | |
|---|---|---|---|
| Labour | 62.1 | +11.9 | |
| Conservative | 13.3 | -8.7 | |
| UKIP | 12.8 | -0.5 | |
| Liberal Democrat | 6.6 | -3.8 | |
| Green | 5.2 | +1.3 | |
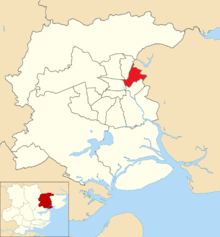
Castle
| Party | Candidate | Votes | % | ||
|---|---|---|---|---|---|
| Liberal Democrat | Nick Barlow | 881 | 11.1 | ||
| Conservative | Darius Laws* | 854 | 10.7 | ||
| Conservative | Daniel Ellis | 801 | 10.1 | ||
| Liberal Democrat | Bill Frame* | 792 | 9.9 | ||
| Green | Mark Goacher | 781 | 9.8 | ||
| Liberal Democrat | Jo Hayes* | 769 | 9.7 | ||
| Conservative | Kate Martin | 759 | 9.5 | ||
| Green | Amanda Kirke | 511 | 6.4 | ||
| Labour | Isobel Merry | 484 | 6.1 | ||
| Labour | Barry Gilheany | 452 | 5.7 | ||
| Green | Charles Ham | 451 | 5.7 | ||
| Labour | Jordan Newell | 427 | 5.4 | ||
| Turnout | 2,781 | 37.4 | |||
| Liberal Democrat hold | |||||
| Conservative hold | |||||
| Conservative gain from Liberal Democrat | |||||
| Top-candidate result | % | +/- | |
|---|---|---|---|
| Liberal Democrat | 29.4 | +4.1 | |
| Conservative | 28.5 | -7.4 | |
| Green | 26.0 | +5.0 | |
| Labour | 16.1 | -1.6 | |
Greenstead
Greenstead was created from the following wards:
- St. Andrew's
- St. Anne's
| Party | Candidate | Votes | % | |
|---|---|---|---|---|
| Labour | Julie Young* | 1,144 | 18.7 | |
| Labour | Tim Young* | 1,134 | 18.5 | |
| Labour | Tina Bourne* | 999 | 16.3 | |
| Conservative | Chris Hill | 517 | 8.4 | |
| UKIP | Jamie Middleditch | 421 | 6.7 | |
| Liberal Democrat | Owen Bartholomew | 388 | 6.3 | |
| Conservative | Paul Hanslow | 341 | 5.6 | |
| Conservative | Andrew Higginson | 309 | 5.0 | |
| Liberal Democrat | Josef Schumacher | 288 | 4.7 | |
| Green | Chris Flossman | 193 | 3.1 | |
| Independent | Christopher Lee | 183 | 3.0 | |
| Green | Poppy Gerrard-Abbott | 115 | 1.9 | |
| Green | Asa Bortherton | 103 | 1.7 | |
| Turnout | 2,279 | 30.3 | ||
| Labour win (new seat) | ||||
| Labour win (new seat) | ||||
| Labour win (new seat) | ||||
Highwoods
| Party | Candidate | Votes | % | ||
|---|---|---|---|---|---|
| Independent | Gerard Oxford* | 1,126 | 17.0 | ||
| Independent | Bev Oxford* | 1,038 | 15.7 | ||
| Independent | Phil Oxford* | 954 | 14.4 | ||
| Conservative | Chris Hayter | 690 | 10.4 | ||
| Conservative | James Child | 588 | 8.9 | ||
| Conservative | Steph Hayward | 522 | 7.9 | ||
| Labour | David McCulloch | 287 | 4.3 | ||
| Labour | Gary Braddy | 285 | 4.3 | ||
| Labour | Diane Stevens | 283 | 4.3 | ||
| Liberal Democrat | John Baker | 273 | 4.1 | ||
| UKIP | Alexei Knupffer | 251 | 3.8 | ||
| Green | Robbie Spence | 139 | 2.1 | ||
| Green | Bonnie Murphy | 92 | 1.4 | ||
| Green | Leo Palmer | 91 | 1.4 | ||
| Turnout | 2,348 | 33.4 | |||
| Independent hold | |||||
| Independent hold | |||||
| Independent hold | |||||
| Top-candidate result | % | +/- | |
|---|---|---|---|
| Independent | 40.7 | +3.8 | |
| Conservative | 24.9 | -2.7 | |
| Labour | 10.4 | -0.7 | |
| Liberal Democrat | 9.9 | -0.9 | |
| UKIP | 9.1 | -0.1 | |
| Green | 5.0 | +0.7 | |
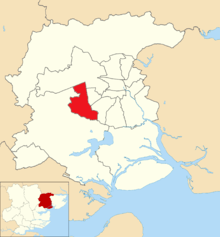
Lexden & Braiswick
Lexden & Braiswick was created from the following wards:
- Lexden
- West Bergholt & Eight Ash Green
- Mile End
- Great Tey
| Party | Candidate | Votes | % | |
|---|---|---|---|---|
| Conservative | Dennis Willits* | 1,712 | 21.1 | |
| Conservative | Lewis Barber* | 1,704 | 21.0 | |
| Conservative | Brian Jarvis* | 1,609 | 19.8 | |
| Liberal Democrat | Thomas Stevenson | 515 | 6.4 | |
| Liberal Democrat | Gemma Graham | 410 | 5.1 | |
| Green | Steve Ford | 386 | 4.8 | |
| Liberal Democrat | Susan Waite | 367 | 4.5 | |
| Labour | Alison Inman | 335 | 4.1 | |
| Labour | Sioux Blair-Jordan | 321 | 4.0 | |
| Labour | Megan Saliu | 284 | 3.5 | |
| Green | Rosa Chandler | 247 | 3.0 | |
| Green | Emmanuel Blondel | 219 | 2.7 | |
| Turnout | 2,886 | 40.4 | ||
| Conservative win (new seat) | ||||
| Conservative win (new seat) | ||||
| Conservative win (new seat) | ||||
Marks Tey & Layer
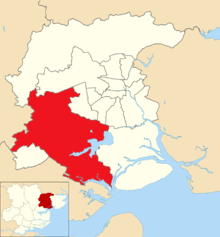
Marks Tey & Layer was created from the following wards:
- Marks Tey
- Birch & Winstree
- Copford & West Stanway
| Party | Candidate | Votes | % | |
|---|---|---|---|---|
| Conservative | Kevin Bentley* | 1,424 | 23.4 | |
| Conservative | Andrew Ellis* | 1,248 | 20.5 | |
| Conservative | Jackie Maclean* | 1,135 | 18.7 | |
| UKIP | John Pitts | 523 | 8.6 | |
| Labour | John Wood | 379 | 6.2 | |
| Liberal Democrat | Gillian Collings | 340 | 5.6 | |
| Green | Clare Palmer | 302 | 5.0 | |
| Labour | John Spademan | 296 | 4.9 | |
| Labour | Michael Wagstaff | 231 | 3.8 | |
| Green | Matt Stemp | 206 | 3.4 | |
| Turnout | 2,396 | 35.8 | ||
| Conservative win (new seat) | ||||
| Conservative win (new seat) | ||||
| Conservative win (new seat) | ||||
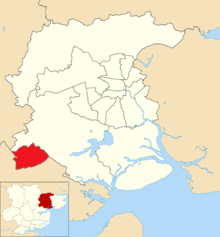
Mersea & Pyefleet
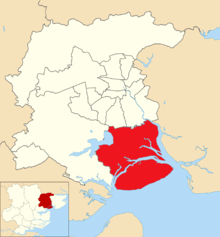
Mersea & Pyefleet was created from the following wards:
- West Mersea
- Pyefleet
| Party | Candidate | Votes | % | |
|---|---|---|---|---|
| Conservative | John Jowers* | 1,643 | 18.6 | |
| Conservative | Patricia Moore* | 1,433 | 16.2 | |
| Conservative | Robert Davidson* | 1,392 | 15.8 | |
| UKIP | David Broise | 768 | 8.7 | |
| UKIP | David Holmes | 768 | 8.7 | |
| Labour | Bry Mogridge | 515 | 5.8 | |
| UKIP | Maria Vigneau | 507 | 5.7 | |
| Green | Lisa Britton | 459 | 5.2 | |
| Green | Peter Banks | 426 | 4.8 | |
| Labour | Neil Belcher | 301 | 3.4 | |
| Labour | Ron Smith | 269 | 3.0 | |
| Liberal Democrat | Barry Woodward | 202 | 2.3 | |
| Green | Bartosz Mizgier | 143 | 1.6 | |
| Turnout | 3,175 | 39.5 | ||
| Conservative win (new seat) | ||||
| Conservative win (new seat) | ||||
| Conservative win (new seat) | ||||
| Top-candidate result | % | |
|---|---|---|
| Conservative | 45.8 | |
| UKIP | 21.4 | |
| Labour | 14.4 | |
| Green | 12.8 | |
| Liberal Democrat | 5.6 | |
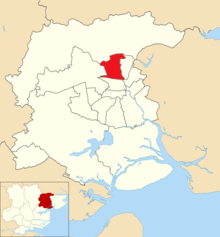
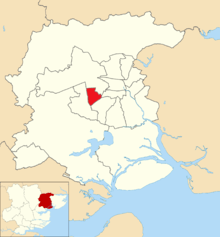
Mile End
| Party | Candidate | Votes | % | |
|---|---|---|---|---|
| Liberal Democrat | Martin Goss* | 1,666 | 22.6 | |
| Liberal Democrat | Phillip Coleman | 1,375 | 18.6 | |
| Liberal Democrat | Dominic Graham* | 1,344 | 18.2 | |
| Conservative | Ben Locker* | 731 | 9.9 | |
| Conservative | Stephen Rowe | 543 | 7.4 | |
| Conservative | Thomas Rowe | 525 | 7.1 | |
| Labour | Martin Camroux | 302 | 4.1 | |
| Labour | Beverly Pearce | 258 | 3.5 | |
| Labour | Elisa Vasquez-Walters | 221 | 3.0 | |
| Green | David Traynier | 206 | 2.8 | |
| Green | Mary Bryan | 127 | 1.7 | |
| Green | Peter Lynn | 88 | 1.2 | |
| Turnout | 2,622 | 37.7 | ||
| Liberal Democrat hold | ||||
| Liberal Democrat gain from Conservative | ||||
| Liberal Democrat hold | ||||
| Top-candidate result | % | +/- | |
|---|---|---|---|
| Liberal Democrat | 57.3 | +25.1 | |
| Conservative | 25.2 | -13.2 | |
| Labour | 10.4 | -2.5 | |
| Green | 7.1 | +0.4 | |
New Town & Christ Church
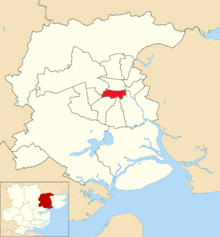
New Town & Christ Church was created from the following wards:
- New Town
- Christ Church
| Party | Candidate | Votes | % | |
|---|---|---|---|---|
| Liberal Democrat | Theresa Higgins* | 1,140 | 13.7 | |
| Liberal Democrat | Nick Cope* | 1,113 | 13.4 | |
| Liberal Democrat | Annie Feltham* | 1,032 | 12.4 | |
| Labour | Abigail Fuller | 710 | 8.5 | |
| Conservative | Annesley Hardy* | 691 | 8.3 | |
| Conservative | Simon Crow | 666 | 8.0 | |
| Conservative | Ben Payne | 616 | 7.4 | |
| Labour | Oladipo Odedengbe | 563 | 6.8 | |
| Labour | Jaki Whyte | 559 | 6.7 | |
| Green | Bob Brannan | 555 | 6.7 | |
| Green | Ruby Runnalls Palmer | 346 | 4.2 | |
| Green | Laurence Knight | 317 | 3.8 | |
| Turnout | 2,900 | 33.9 | ||
| Liberal Democrat win (new seat) | ||||
| Liberal Democrat win (new seat) | ||||
| Liberal Democrat win (new seat) | ||||
| Top-candidate result | % | |
|---|---|---|
| Liberal Democrat | 36.8 | |
| Conservative | 22.9 | |
| Labour | 22.3 | |
| Green | 17.9 | |
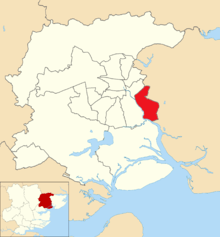
Old Heath & The Hythe
Old Heath & The Hythe was created from the following wards:
- Old Heath
- New Town
- East Donyland
| Party | Candidate | Votes | % | |
|---|---|---|---|---|
| Labour | Mike Lilley* | 1,126 | 15.4 | |
| Labour | Adam Fox | 1,025 | 13.8 | |
| Labour | Lee Scordis | 925 | 12.5 | |
| Liberal Democrat | Julia Havis* | 747 | 10.1 | |
| Liberal Democrat | Janet Knight | 711 | 9.6 | |
| Liberal Democrat | Justin Knight* | 689 | 9.3 | |
| Green | Susan Allen | 451 | 6.1 | |
| Conservative | Liam Gallagher | 435 | 5.9 | |
| Conservative | Richard Brown | 403 | 5.4 | |
| Conservative | Alan Scattergood | 344 | 4.6 | |
| Green | Jan Plummer | 302 | 4.1 | |
| Green | Andrew Canessa | 258 | 3.5 | |
| Turnout | 2,699 | 34.8 | ||
| Labour win (new seat) | ||||
| Labour win (new seat) | ||||
| Labour win (new seat) | ||||
Prettygate
| Party | Candidate | Votes | % | ||
|---|---|---|---|---|---|
| Conservative | Sue Lissimore* | 2,024 | 22.8 | ||
| Conservative | Beverly Davis* | 1,675 | 18.9 | ||
| Conservative | Roger Buston* | 1,637 | 18.4 | ||
| Liberal Democrat | Jake Beavan | 649 | 7.3 | ||
| Labour | Mike Dale | 599 | 6.7 | ||
| Liberal Democrat | Glanville Williams | 585 | 6.6 | ||
| Labour | Richard Bourne | 563 | 6.3 | ||
| Labour | Clive Needle | 379 | 4.3 | ||
| Green | Ruby Butler | 369 | 4.2 | ||
| Green | Luke O'Loughlin | 209 | 2.4 | ||
| Green | Mike Stewart | 192 | 2.2 | ||
| Turnout | 3,227 | 40.6 | |||
| Conservative hold | |||||
| Conservative hold | |||||
| Conservative hold | |||||
| Top-candidate result | % | +/- | |
|---|---|---|---|
| Conservative | 55.6 | +4.5 | |
| Liberal Democrat | 17.8 | -3.9 | |
| Labour | 16.5 | +4.7 | |
| Green | 10.1 | +5.7 | |
Rural North

Rural North was created from the following wards:
- Dedham & Langham
- Fordham & Stour
- Great Tey
- West Bergholt & Eight Ash Green
| Party | Candidate | Votes | % | |
|---|---|---|---|---|
| Conservative | Christopher Arnold* | 1,913 | 24.1 | |
| Conservative | Nigel Chapman* | 1,824 | 23.0 | |
| Conservative | Peter Chillingworth* | 1,665 | 21.0 | |
| Green | Roger Bamforth | 488 | 6.1 | |
| Liberal Democrat | Will Brown | 478 | 6.0 | |
| Green | Blake Roberts | 367 | 4.6 | |
| Labour | Kevin Finnigan | 322 | 4.1 | |
| Labour | Judith Short | 319 | 4.0 | |
| Green | Janita Le Fevre | 282 | 3.6 | |
| Labour | Paul Fryer-Kelsey | 278 | 3.5 | |
| Turnout | 3,030 | 36.2 | ||
| Conservative win (new seat) | ||||
| Conservative win (new seat) | ||||
| Conservative win (new seat) | ||||
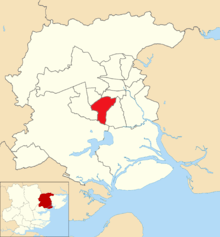
Shrub End
| Party | Candidate | Votes | % | ||
|---|---|---|---|---|---|
| Liberal Democrat | Lyn Barton* | 960 | 16.9 | ||
| Liberal Democrat | Karen Chaplin | 569 | 10.0 | ||
| Conservative | Pauline Hazell* | 526 | 9.2 | ||
| Conservative | Mike Hardy | 510 | 9.0 | ||
| Liberal Democrat | Jamie Chaplin | 508 | 8.9 | ||
| Conservative | Vic Flores | 496 | 8.7 | ||
| UKIP | Bruno Hickman | 379 | 6.7 | ||
| Independent | Sharron Lawrence | 349 | 6.1 | ||
| Labour | Bruce Tuxford | 324 | 5.7 | ||
| Labour | Steve Dunt | 322 | 5.7 | ||
| Labour | Stuart Ellis | 305 | 5.4 | ||
| Green | Wolfgang Fauser | 206 | 3.6 | ||
| Green | Stuart Welham | 143 | 2.5 | ||
| Green | Maria Harrison | 92 | 1.6 | ||
| Turnout | 2,165 | 28.2 | |||
| Liberal Democrat hold | |||||
| Liberal Democrat hold | |||||
| Conservative hold | |||||
| Top-candidate result | % | +/- | |
|---|---|---|---|
| Liberal Democrat | 35.0 | +8.8 | |
| Conservative | 19.2 | -15.2 | |
| UKIP | 13.8 | -3.3 | |
| Independent | 12.7 | N/A | |
| Labour | 11.8 | -4.9 | |
| Green | 7.5 | +1.8 | |
St. Anne's & St. John's
St. Anne's & St. John's was created from the following wards:
- St. Anne's
- St. John's
| Party | Candidate | Votes | % | |
|---|---|---|---|---|
| Liberal Democrat | Mike Hogg* | 1,426 | 17.9 | |
| Liberal Democrat | Helen Chuah* | 1,352 | 17.0 | |
| Liberal Democrat | Paul Smith* | 1,215 | 15.3 | |
| UKIP | Jason Berry | 637 | 8.0 | |
| Conservative | Charles McKay | 568 | 7.1 | |
| UKIP | Bill Faram | 529 | 6.6 | |
| Conservative | Peter Klejna-Wendt | 511 | 6.4 | |
| Conservative | Terry Sutton | 465 | 5.8 | |
| Labour | Sam Fuller | 276 | 3.5 | |
| Labour | Amanda Stannard | 274 | 3.4 | |
| Labour | Alex Yeandle | 251 | 3.2 | |
| Green | Callum Fauser | 191 | 2.4 | |
| Green | Robert Chambers | 160 | 2.0 | |
| Green | Megan Maltby | 111 | 1.4 | |
| Turnout | 2,883 | 35.7 | ||
| Liberal Democrat win (new seat) | ||||
| Liberal Democrat win (new seat) | ||||
| Liberal Democrat win (new seat) | ||||
Stanway
| Party | Candidate | Votes | % | ± | |
|---|---|---|---|---|---|
| Conservative | Fiona Maclean* | 963 | 15.0 | N/A | |
| Liberal Democrat | Lesley Scott-Boutell | 962 | 15.0 | N/A | |
| Liberal Democrat | Jessica Scott-Boutell* | 944 | 14.8 | N/A | |
| Conservative | Paul Dundas | 839 | 13.1 | N/A | |
| Conservative | Christopher Manby | 792 | 12.4 | N/A | |
| Liberal Democrat | Jon Manning* | 629 | 9.8 | N/A | |
| Labour | David Hough | 302 | 4.7 | N/A | |
| Labour | Carol Spademan | 302 | 4.7 | N/A | |
| Labour | Ian Yates | 256 | 4.0 | N/A | |
| Green | Walter Schwartz | 137 | 2.1 | N/A | |
| Green | Will Price | 137 | 2.1 | N/A | |
| Green | Nicholas Blondel | 136 | 2.1 | N/A | |
| Turnout | 2,331 | 36.2 | N/A | ||
| Conservative hold | Swing | ||||
| Liberal Democrat gain from Independent | Swing | ||||
| Liberal Democrat hold | Swing | ||||
| Party | % | +/- | |
|---|---|---|---|
| Conservative | 40.7 | -1.7 | |
| Liberal Democrat | 40.7 | +3.7 | |
| Labour | 12.8 | -1.4 | |
| Green | 5.8 | -0.2 | |
Tiptree
| Party | Candidate | Votes | % | |
|---|---|---|---|---|
| Conservative | John Elliott* | 1,459 | 24.1 | |
| Conservative | Barbara Wood | 1,403 | 23.2 | |
| Conservative | Derek Loveland | 1,370 | 22.6 | |
| Labour | Joanne Devine | 400 | 6.6 | |
| Labour | Barbara Nichols | 400 | 6.6 | |
| Labour | Robert Spademan | 371 | 6.1 | |
| Green | Kathy Bamforth | 291 | 4.8 | |
| Green | Rob Cronshaw | 196 | 3.2 | |
| Green | Adam Abo Henriksen | 165 | 2.7 | |
| Turnout | 2,247 | 31.5 | ||
| Conservative hold | ||||
| Conservative hold | ||||
| Conservative hold | ||||
| Top-candidate result | % | +/- | |
|---|---|---|---|
| Conservative | 67.9 | +25.1 | |
| Labour | 18.6 | +5.4 | |
| Green | 13.5 | +10.3 | |
Wivenhoe
Wivenhoe was created from the following wards:
- Wivenhoe Cross
- Wivenhoe Quay
| Party | Candidate | Votes | % | |
|---|---|---|---|---|
| Labour Co-op | Cyril Liddy* | 1,154 | 12.2 | |
| Liberal Democrat | Mark Cory* | 1,141 | 12.0 | |
| Labour Co-op | Rosalind Scott* | 1,137 | 12.0 | |
| Labour Co-op | Phil Finn | 998 | 10.5 | |
| Conservative | Peter Hill | 906 | 9.5 | |
| Liberal Democrat | Sanchia Nash | 892 | 9.4 | |
| Independent | Andrea Luxford Vaughan | 549 | 5.8 | |
| Liberal Democrat | Alex Hale | 499 | 5.3 | |
| Independent | Mike Newton | 464 | 4.9 | |
| Conservative | Craig Stuart | 447 | 4.7 | |
| Independent | Shaun Boughton | 416 | 4.4 | |
| Conservative | Roman Perrior | 379 | 4.0 | |
| Green | Tim Glover | 278 | 2.9 | |
| Green | Laura Pountney | 123 | 1.3 | |
| Green | Lora Aziz | 113 | 1.2 | |
| Turnout | 3,185 | 53.3 | ||
| Labour Co-op win (new seat) | ||||
| Liberal Democrat win (new seat) | ||||
| Labour Co-op win (new seat) | ||||
References
- ↑ "Local Boundary Commission for England". www.lgbce.org.uk. Retrieved 14 September 2016.