Harwich (UK Parliament constituency)
| Harwich | |
|---|---|
|
Former County constituency for the House of Commons | |
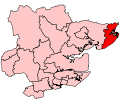 Boundary of Harwich in Essex in 2005. | |
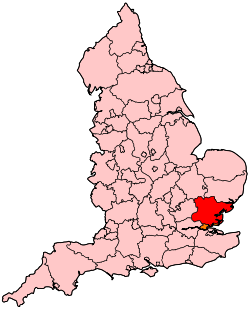 Location of Essex within England. | |
| County | Essex |
| before 1660–2010 | |
| Number of members | one (two before 1868) |
| Replaced by | Clacton, Harwich and North Essex |
| European Parliament constituency | East of England |
Harwich was a parliamentary constituency represented in the House of Commons of the Parliament of the United Kingdom. Until its abolition for the 2010 general election it elected one Member of Parliament (MP) by the first past the post system of election.
Boundaries

1885-1918: The Municipal Boroughs of Colchester and Harwich, and parts of the Sessional Divisions of Lexden and Winstree.
1918-1950: The Municipal Borough of Harwich, the Urban Districts of Brightlingsea, Clacton, Frinton-on-Sea, Walton-on-the-Naze, and Wivenhoe, and the Rural District of Tendring.
1950-1983: The Municipal Borough of Harwich, the Urban Districts of Brightlingsea, Clacton, Frinton and Walton, and Wivenhoe, and the Rural District of Tendring.
1983-1997: The District of Tendring wards of Beaumont and Thorpe, Bockings Elm, Bradfield Wrabness and Wix, Frinton, Golf Green, Great and Little Oakley, Harwich East, Harwich East Central, Harwich West, Harwich West Central, Haven, Holland and Kirby, Little Clacton, Ramsey, Rush Green, Southcliff, St Bartholomew's, St James, St John's, St Mary's, St Osyth, Tendring and Weeley, and Walton.
1997-2010: The District of Tendring wards of Beaumont and Thorpe, Bockings Elm, Frinton, Golf Green, Great and Little Oakley, Harwich East, Harwich East Central, Harwich West, Harwich West Central, Haven, Holland and Kirby, Little Clacton, Ramsey, Rush Green, St Bartholomew's, St James, St John's, St Mary's, Southcliff, and Walton.
Boundary review
Following their review of parliamentary representation in Essex, the Boundary Commission for England created a new constituency of Clacton, based on the former Harwich seat. Harwich itself was moved into a new constituency of Harwich and North Essex.
Members of Parliament
Constituency founded 1604
1604 to 1660
| Parliament | First member | Second member |
|---|---|---|
| 1604 | Richard Browne | Thomas Trevor |
| 1605 | John Panton | |
| 1614 | Sir Harbottle Grimston | Sir Robert Mansell |
| 1614 (Apr) | Sir Charles Montagu | |
| 1620 | Sir Thomas Cheek | Edward Grimston |
| 1624 | Sir Nathaniel Rich | Christopher Herrys |
| 1625 | Sir Edmund Sawyer | Christopher Herrys |
| 1626 | Sir Nathaniel Rich | Christopher Herrys |
| 1628–1629 | Sir Nathaniel Rich | Christopher Herrys |
| 1629–1640 | No Parliaments convened | |
| 1640 (Apr) | Sir Thomas Cheek | Sir John Jacob, 1st Baronet |
| 1640 (Nov) | Sir Harbottle Grimston, 1st Baronet | Sir Thomas Cheek |
| 1645 | Sir Harbottle Grimston, 1st Baronet, died replaced 1647 by Harbottle Grimston, 2nd Baronet who was secluded Dec 1648 in Pride's Purge | Sir Thomas Cheek |
| 1648 | Sir Thomas Cheek | |
| 1653 | Harwich not represented in Barebone's Parliament | |
| 1654 | Harwich not represented in First Protectorate Parliament | |
| 1656 | Harwich not represented in Second Protectorate Parliament | |
| 1659 | John Sicklemore | Thomas King |
1660–1868
1868–2010
| Election | Member[1] | Party | |
|---|---|---|---|
| 1868 | Representation reduced to one member | ||
| 1868 | Henry Jervis-White-Jervis | Conservative | |
| 1880 | Henry Tyler | Conservative | |
| 1885 | James Round | Conservative | |
| 1906 | Arthur Lever | Liberal | |
| 1910 | Harry Newton | Conservative | |
| 1922 | Albert Ernest Hillary | Liberal | |
| 1924 | Sir Frederick Rice | Conservative | |
| 1929 | Sir John Pybus | Liberal | |
| 1931 | Liberal National | ||
| 1935 | Sir Stanley Holmes | Liberal National | |
| 1954 by-election | Julian Ridsdale | National Liberal | |
| 1968 | Conservative | ||
| 1992 | Iain Sproat | Conservative | |
| 1997 | Ivan Henderson | Labour | |
| 2005 | Douglas Carswell | Conservative | |
| 2010 | Constituency abolished: see Clacton and Harwich and North Essex | ||
Elections
Elections in the 1850s
Hobhouse was elevated to the peerage, becoming 1st Baron Broughton and causing a by-election.
| Party | Candidate | Votes | % | ± | |
|---|---|---|---|---|---|
| Conservative | Henry Thoby Prinsep | 135 | 50.9 | ||
| Whig | Robert Wigram Crawford | 130 | 49.1 | ||
| Majority | 5 | 1.9 | |||
| Turnout | 265 | 91.7 | |||
| Registered electors | 289 | ||||
| Conservative gain from Radical | Swing | ||||
Prinsep's election was declared void on petition due to bribery, due to, causing a by-election.[18]
| Party | Candidate | Votes | % | ± | |
|---|---|---|---|---|---|
| Whig | Robert Wigram Crawford | 133 | 51.2 | ||
| Conservative | Henry Thoby Prinsep | 127 | 48.8 | ||
| Majority | 6 | 2.3 | |||
| Turnout | 260 | 90.0 | |||
| Registered electors | 289 | ||||
| Whig gain from Conservative | Swing | ||||
Crawford's election was declared void, due to polling being closed prematurely, and the seat's writ was suspended in July 1851.[14] A by-election was called the next year.
| Party | Candidate | Votes | % | ± | |
|---|---|---|---|---|---|
| Conservative | Fitzroy Kelly | Unopposed | |||
| Conservative gain from Whig | |||||
Kelly resigned to contest a by-election in East Suffolk, causing a by-election.
| Party | Candidate | Votes | % | ± | |
|---|---|---|---|---|---|
| Conservative | Isaac Butt | Unopposed | |||
| Conservative hold | |||||
| Party | Candidate | Votes | % | ± | |
|---|---|---|---|---|---|
| Conservative | George Peacocke | 135 | 26.8 | ||
| Conservative | David Waddington | 134 | 26.6 | ||
| Whig | John Bagshaw | 125 | 24.8 | ||
| Independent Liberal | George Drought Warburton | 110 | 21.8 | ||
| Majority | 9 | 1.8 | N/A | ||
| Turnout | 252 (est) | 92.6 (est) | |||
| Registered electors | 272 | ||||
| Conservative hold | Swing | ||||
| Conservative gain from Whig | Swing | ||||
Peacocke's election was declared void on petition, due to corrupt practices, causing a by-election.[19]
| Party | Candidate | Votes | % | ± | |
|---|---|---|---|---|---|
| Whig | John Bagshaw | 140 | 54.9 | +30.1 | |
| Conservative | William Fraser | 115 | 45.1 | −8.3 | |
| Majority | 25 | 9.8 | N/A | ||
| Turnout | 255 | 85.3 | −7.3 | ||
| Registered electors | 299 | ||||
| Whig gain from Conservative | Swing | +19.2 | |||
| Party | Candidate | Votes | % | ± | |
|---|---|---|---|---|---|
| Whig | John Bagshaw | 173 | 32.6 | +7.8 | |
| Independent Liberal | George Drought Warburton | 147 | 27.7 | +5.9 | |
| Conservative | Henry Jervis-White-Jervis | 113 | 21.3 | −5.5 | |
| Conservative | Benjamin Buck Greene[20] | 98 | 18.5 | −8.1 | |
| Turnout | 266 (est) | 84.8 (est) | −7.8 | ||
| Registered electors | 313 | ||||
| Majority | 26 | 4.9 | N/A | ||
| Whig gain from Conservative | Swing | +7.3 | |||
| Majority | 34 | 6.4 | N/A | ||
| Independent Liberal gain from Conservative | Swing | +6.4 | |||
Warburton's death caused a by-election.
| Party | Candidate | Votes | % | ± | |
|---|---|---|---|---|---|
| Whig | Robert John Bagshaw | 162 | 70.1 | +37.5 | |
| Independent Liberal | Andrew Arcedeckne[21][22] | 69 | 29.9 | N/A | |
| Majority | 93 | 40.3 | N/A | ||
| Turnout | 231 | 73.8 | −11.0 | ||
| Registered electors | 313 | ||||
| Whig gain from Independent Liberal | Swing | N/A | |||
Bagshaw's resignation caused a by-election.
| Party | Candidate | Votes | % | ± | |
|---|---|---|---|---|---|
| Conservative | Henry Jervis-White-Jervis | 145 | 52.0 | +12.2 | |
| Whig | William Campbell | 134 | 48.0 | +15.4 | |
| Majority | 11 | 3.9 | N/A | ||
| Turnout | 279 | 83.5 | −1.3 | ||
| Registered electors | 334 | ||||
| Conservative gain from Whig | Swing | −1.6 | |||
| Party | Candidate | Votes | % | ± | |
|---|---|---|---|---|---|
| Conservative | Henry Jervis-White-Jervis | 156 | 25.7 | +4.4 | |
| Liberal | William Campbell | 155 | 25.5 | −7.1 | |
| Conservative | Richard Rowley | 152 | 25.0 | +6.5 | |
| Liberal | John Clark Marshman | 144 | 23.7 | −4.0 | |
| Turnout | 304 (est) | 90.9 (est) | +6.1 | ||
| Registered electors | 334 | ||||
| Majority | 1 | 0.2 | N/A | ||
| Conservative gain from Independent Liberal | Swing | N/A | |||
| Majority | 3 | 0.5 | −4.4 | ||
| Liberal hold | Swing | −6.3 | |||
Elections in the 1860s
Campbell succeeded to the peerage, becoming Lord Stratheden and Campbell, and causing a by-election.
| Party | Candidate | Votes | % | ± | |
|---|---|---|---|---|---|
| Conservative | Richard Rowley | 146 | 55.7 | +5.0 | |
| Liberal | Stuart Donaldson[23] | 116 | 44.3 | −4.9 | |
| Majority | 30 | 11.5 | +11.3 | ||
| Turnout | 262 | 82.6 | −8.3 | ||
| Registered electors | 317 | ||||
| Conservative hold | Swing | +5.0 | |||
| Party | Candidate | Votes | % | ± | |
|---|---|---|---|---|---|
| Conservative | Henry Jervis-White-Jervis | 209 | 35.0 | +9.3 | |
| Conservative | John Kelk | 194 | 32.5 | +7.5 | |
| Liberal | Michael Wills[24] | 117 | 19.6 | −5.9 | |
| Liberal | James Fitzjames Stephen[25] | 77 | 12.9 | −10.8 | |
| Majority | 77 | 12.9 | +12.7 | ||
| Turnout | 299 (est) | 77.3 (est) | −13.6 | ||
| Registered electors | 386 | ||||
| Conservative hold | Swing | +8.8 | |||
| Conservative gain from Liberal | Swing | +7.9 | |||
Seat reduced to one member
| Party | Candidate | Votes | % | ± | |
|---|---|---|---|---|---|
| Conservative | Henry Jervis-White-Jervis | 328 | 69.9 | =2.4 | |
| Liberal | David James Jenkins | 141 | 30.1 | −2.4 | |
| Majority | 187 | 39.9 | +27.0 | ||
| Turnout | 469 | 75.4 | −1.9 | ||
| Registered electors | 622 | ||||
| Conservative hold | Swing | +2.4 | |||
Elections in the 1870s
| Party | Candidate | Votes | % | ± | |
|---|---|---|---|---|---|
| Conservative | Henry Jervis-White-Jervis | Unopposed | |||
| Registered electors | 712 | ||||
| Conservative hold | |||||
Elections in the 1880s
| Party | Candidate | Votes | % | ± | |
|---|---|---|---|---|---|
| Conservative | Henry Tyler | 368 | 54.3 | ||
| Liberal | George Tomline[26] | 310 | 45.7 | ||
| Majority | 58 | 8.6 | |||
| Turnout | 678 | 89.3 | |||
| Registered electors | 759 | ||||
| Conservative hold | Swing | ||||
| Party | Candidate | Votes | % | ± | |
|---|---|---|---|---|---|
| Conservative | James Round | 4,584 | 54.5 | +0.2 | |
| Liberal | James Jackson | 3,824 | 45.5 | −0.2 | |
| Majority | 760 | 9.0 | +0.4 | ||
| Turnout | 8,408 | 82.9 | −6.4 | ||
| Registered electors | 10,141 | ||||
| Conservative hold | Swing | +0.2 | |||
| Party | Candidate | Votes | % | ± | |
|---|---|---|---|---|---|
| Conservative | James Round | 4,623 | 66.6 | +12.1 | |
| Liberal | James Wicks | 2,322 | 33.4 | -12.1 | |
| Majority | 2,301 | 33.2 | +24.2 | ||
| Turnout | 6,945 | 68.5 | -14.4 | ||
| Registered electors | 10,141 | ||||
| Conservative hold | Swing | +12.1 | |||
Elections in the 1890s
| Party | Candidate | Votes | % | ± | |
|---|---|---|---|---|---|
| Conservative | James Round | 4,113 | 51.9 | -14.7 | |
| Liberal | Robert Varty | 3,808 | 48.1 | +14.7 | |
| Majority | 305 | 3.8 | -29.4 | ||
| Turnout | 7,921 | 72.5 | +4.0 | ||
| Registered electors | 10,924 | ||||
| Conservative hold | Swing | -14.7 | |||
| Party | Candidate | Votes | % | ± | |
|---|---|---|---|---|---|
| Conservative | James Round | 4,566 | 63.0 | +11.1 | |
| Liberal | Robert Varty | 2,685 | 37.0 | -11.1 | |
| Majority | 1,881 | 26.0 | +22.2 | ||
| Turnout | 7,251 | 64.2 | -8.3 | ||
| Registered electors | 11,296 | ||||
| Conservative hold | Swing | +11.1 | |||
Elections in the 1900s
| Party | Candidate | Votes | % | ± | |
|---|---|---|---|---|---|
| Conservative | James Round | Unopposed | |||
| Conservative hold | |||||
| Party | Candidate | Votes | % | ± | |
|---|---|---|---|---|---|
| Liberal | Arthur Lever | 5,650 | 51.6 | N/A | |
| Conservative | Harry Newton | 5,308 | 48.4 | N/A | |
| Majority | 342 | 3.2 | N/A | ||
| Turnout | 10,958 | 83.4 | N/A | ||
| Registered electors | 13,144 | ||||
| Liberal gain from Conservative | Swing | N/A | |||
Elections in the 1910s
| Party | Candidate | Votes | % | ± | |
|---|---|---|---|---|---|
| Conservative | Harry Newton | 6,757 | 54.6 | +3.0 | |
| Liberal | Arthur Lever | 5,608 | 45.4 | -3.0 | |
| Majority | 1,149 | 9.2 | +6.0 | ||
| Turnout | 86.6 | +3.2 | |||
| Conservative gain from Liberal | Swing | +3.0 | |||
| Party | Candidate | Votes | % | ± | |
|---|---|---|---|---|---|
| Conservative | Harry Newton | 6,470 | 56.4 | +1.8 | |
| Liberal | Frank Stapledon Hiley | 5,008 | 43.6 | -1.8 | |
| Majority | 1,462 | 12.8 | +3.6 | ||
| Turnout | 80.4 | -6.2 | |||
| Conservative hold | Swing | +1.8 | |||
General Election 1914/15:
Another General Election was required to take place before the end of 1915. The political parties had been making preparations for an election to take place and by the July 1914, the following candidates had been selected;
- Unionist: Harry Newton
- Liberal: Edward Aylmer Digby
| Party | Candidate | Votes | % | ± | |
|---|---|---|---|---|---|
| C | Unionist | Harry Newton | 8,261 | 53.9 | -2.5 |
| Liberal | Edward Aylmer Digby | 7,064 | 46.1 | +2.5 | |
| Majority | 1,197 | 7.8 | -5.0 | ||
| Turnout | 15,325 | 55.9 | -26.5 | ||
| Registered electors | 27,421 | ||||
| Unionist hold | Swing | -2.5 | |||
| C indicates candidate endorsed by the coalition government. | |||||
Elections in the 1920s
| Party | Candidate | Votes | % | ± | |
|---|---|---|---|---|---|
| Liberal | Albert Ernest Hillary | 10,556 | 51.9 | +5.8 | |
| Unionist | Geoffrey St John Strutt | 9,792 | 48.1 | −5.8 | |
| Majority | 764 | 3.8 | N/A | ||
| Turnout | 20,348 | 71.6 | +15.7 | ||
| Registered electors | 28,432 | ||||
| Liberal gain from Unionist | Swing | +5.8 | |||
| Party | Candidate | Votes | % | ± | |
|---|---|---|---|---|---|
| Liberal | Albert Ernest Hillary | 12,059 | 54.3 | +2.4 | |
| Unionist | Frederick Rice | 10,142 | 45.7 | −2.4 | |
| Majority | 1,917 | 8.6 | +4.8 | ||
| Turnout | 22,201 | 76.2 | +4.6 | ||
| Registered electors | 29,126 | ||||
| Liberal hold | Swing | +2.4 | |||
| Party | Candidate | Votes | % | ± | |
|---|---|---|---|---|---|
| Unionist | Frederick Rice | 12,219 | 51.5 | +5.8 | |
| Liberal | Albert Ernest Hillary | 9,904 | 41.7 | −12.6 | |
| Labour | Alfred Barton | 1,604 | 6.8 | N/A | |
| Majority | 2,315 | 9.8 | N/A | ||
| Turnout | 23,727 | 79.0 | +2.8 | ||
| Registered electors | 30,047 | ||||
| Unionist gain from Liberal | Swing | +9.2 | |||
| Party | Candidate | Votes | % | ± | |
|---|---|---|---|---|---|
| Liberal | John Pybus | 16,309 | 52.8 | +11.1 | |
| Unionist | John Mayhew | 13,609 | 44.1 | −7.4 | |
| Independent Unionist | J Elliott | 946 | 3.1 | N/A | |
| Majority | 2,700 | 8.7 | N/A | ||
| Turnout | 30,864 | 76.3 | −2.7 | ||
| Registered electors | 40,478 | ||||
| Liberal gain from Unionist | Swing | +9.3 | |||
Elections in the 1930s
| Party | Candidate | Votes | % | ± | |
|---|---|---|---|---|---|
| Liberal National | John Pybus | 26,818 | 86.4 | +33.6 | |
| Labour | E L McKeag | 4,229 | 13.6 | n/a | |
| Majority | 22,589 | 72.8 | +64.1 | ||
| Turnout | 31,047 | 72.6 | -3.7 | ||
| Liberal National hold | Swing | n/a | |||
| Party | Candidate | Votes | % | ± | |
|---|---|---|---|---|---|
| Liberal National | Stanley Holmes | 21,716 | 70.3 | -16.1 | |
| Labour | Ambrose Erie Applebe | 9,170 | 29.7 | +16.1 | |
| Majority | 12,546 | 40.6 | -32.2 | ||
| Turnout | 30,886 | 63.9 | -8.7 | ||
| Liberal National hold | Swing | -16.1 | |||
Elections in the 1940s
General Election 1939/40: Another General Election was required to take place before the end of 1940. The political parties had been making preparations for an election to take place from 1939 and by the end of this year, the following candidates had been selected;
- Liberal National: Stanley Holmes
- Labour: Ald. Joseph Hewitt[36]
| Party | Candidate | Votes | % | ± | |
|---|---|---|---|---|---|
| Liberal National | Stanley Holmes | 16,452 | 55.7 | -14.6 | |
| Labour | Joseph Hewitt | 13,067 | 44.3 | +14.6 | |
| Majority | 3,385 | 11.5 | -29.2 | ||
| Turnout | 68.8 | +4.8 | |||
| Liberal National hold | Swing | -14.6 | |||
Elections in the 1950s
| Party | Candidate | Votes | % | ± | |
|---|---|---|---|---|---|
| National Liberal | Stanley Holmes | 22,814 | 50.6 | ||
| Labour | Morris Janis | 16,756 | 37.1 | ||
| Liberal | Leonard Train | 5,536 | 12.3 | ||
| Majority | 6,058 | 13.4 | |||
| Turnout | 81.9 | ||||
| National Liberal hold | Swing | ||||
| Party | Candidate | Votes | % | ± | |
|---|---|---|---|---|---|
| National Liberal and Conservative | Stanley Holmes | 26,169 | 58.9 | ||
| Labour | Morris Janis | 18,244 | 41.1 | ||
| Majority | 7,925 | 17.8 | |||
| Turnout | 78.8 | ||||
| National Liberal and Conservative hold | Swing | ||||
| Party | Candidate | Votes | % | ± | |
|---|---|---|---|---|---|
| Conservative and National Liberal | Julian Ridsdale | 19,532 | 59.1 | +0.2 | |
| Labour | Shirley Catlin | 13,535 | 40.9 | -0.2 | |
| Majority | 5,997 | 18.1 | +0.4 | ||
| Turnout | 33,067 | ||||
| Conservative and National Liberal hold | Swing | ||||
| Party | Candidate | Votes | % | ± | |
|---|---|---|---|---|---|
| Conservative and National Liberal | Julian Ridsdale | 23,889 | 56.4 | ||
| Labour | Shirley Catlin | 14,425 | 34.1 | ||
| Liberal | Wolf Isaac Akst | 4,010 | 9.5 | ||
| Majority | 9,464 | 22.4 | |||
| Turnout | 42,234 | 75.6 | |||
| Conservative and National Liberal hold | Swing | ||||
| Party | Candidate | Votes | % | ± | |
|---|---|---|---|---|---|
| Conservative and National Liberal | Julian Ridsdale | 23,653 | 53.2 | ||
| Labour | William Robinson | 11,588 | 26.0 | ||
| Liberal | Thomas E Dale | 5,507 | 12.4 | ||
| Independent | Leonard F Rose | 3,744 | 8.4 | ||
| Majority | 12,065 | 27.1 | |||
| Turnout | 44,492 | 76.4 | |||
| Conservative and National Liberal hold | Swing | ||||
Elections in the 1960s
| Party | Candidate | Votes | % | ± | |
|---|---|---|---|---|---|
| Conservative and National Liberal | Julian Ridsdale | 25,102 | 50.4 | ||
| Labour | David Winnick | 14,877 | 29.9 | ||
| Liberal | Thomas E Dale | 9,824 | 19.7 | ||
| Majority | 10,225 | 20.5 | |||
| Turnout | 49,803 | 75.1 | |||
| Conservative and National Liberal hold | Swing | ||||
| Party | Candidate | Votes | % | ± | |
|---|---|---|---|---|---|
| Conservative and National Liberal | Julian Ridsdale | 24,975 | 47.6 | -2.8 | |
| Labour | Stephen R Hatch | 18,335 | 34.9 | +5.0 | |
| Liberal | Thomas E Dale | 9,219 | 17.6 | -2.1 | |
| Majority | 6,640 | 12.6 | -7.9 | ||
| Turnout | 52,529 | 74.4 | -0.7 | ||
| Conservative and National Liberal hold | Swing | -3.9 | |||
Elections in the 1970s
| Party | Candidate | Votes | % | ± | |
|---|---|---|---|---|---|
| Conservative | Julian Ridsdale | 32,754 | 53.5 | ||
| Labour | Andrew Phillips | 19,923 | 32.6 | -2.3 | |
| Liberal | Thomas E Dale | 8,519 | 13.9 | -3.7 | |
| Majority | 12,831 | 21.0 | +8.4 | ||
| Turnout | 61,196 | 74.5 | +0.1 | ||
| Conservative hold | Swing | +4.0 | |||
| Party | Candidate | Votes | % | ± | |
|---|---|---|---|---|---|
| Conservative | Julian Ridsdale | 32,452 | 45.6 | -7.9 | |
| Liberal | D Cadman | 19,989 | 28.1 | +14.2 | |
| Labour | JB Fryer | 18,697 | 26.3 | -6.3 | |
| Majority | 12,463 | 17.5 | -3.5 | ||
| Turnout | 71,138 | 80.7 | +6.2 | ||
| Conservative hold | Swing | -11.1 | |||
| Party | Candidate | Votes | % | ± | |
|---|---|---|---|---|---|
| Conservative | Julian Ridsdale | 29,963 | 46.7 | +1.1 | |
| Labour | JB Fryer | 19,135 | 29.8 | +3.5 | |
| Liberal | Thomas Kellock | 15,048 | 23.5 | -4.6 | |
| Majority | 10,828 | 16.9 | -0.6 | ||
| Turnout | 64,146 | 72.3 | -8.4 | ||
| Conservative hold | Swing | -1.2 | |||
| Party | Candidate | Votes | % | ± | |
|---|---|---|---|---|---|
| Conservative | Julian Ridsdale | 37,685 | 54.3 | +7.6 | |
| Labour | CW Brooks | 16,998 | 24.5 | -5.3 | |
| Liberal | R.M. Goodenough | 14,094 | 20.3 | -3.2 | |
| National Front | A Pearson | 597 | 0.9 | N/A | |
| Majority | 20,687 | 29.8 | +12.9 | ||
| Turnout | 69,374 | 74.7 | +2.4 | ||
| Conservative hold | Swing | +6.5 | |||
Elections in the 1980s
| Party | Candidate | Votes | % | ± | |
|---|---|---|---|---|---|
| Conservative | Julian Ridsdale | 27,422 | 54.1 | −0.2 | |
| Liberal | R.M. Goodenough | 14,920 | 29.5 | +9.2 | |
| Labour | Ralph Knight | 8,302 | 16.4 | −8.1 | |
| Majority | 12,502 | 24.6 | −5.2 | ||
| Turnout | 50,644 | 70.2 | −4.5 | ||
| Conservative hold | Swing | −4.7 | |||
| Party | Candidate | Votes | % | ± | |
|---|---|---|---|---|---|
| Conservative | Julian Ridsdale | 29,344 | 51.8 | −2.8 | |
| Liberal | Liz Lynne | 17,262 | 30.4 | +0.9 | |
| Labour | Ralph Knight | 9,920 | 17.5 | +1.1 | |
| Independent | Christopher Humphrey | 161 | 0.3 | N/A | |
| Majority | 12,082 | 21.4 | −3.2 | ||
| Turnout | 56,687 | 73.5 | +3.3 | ||
| Conservative hold | Swing | −1.9 | |||
Elections in the 1990s
| Party | Candidate | Votes | % | ± | |
|---|---|---|---|---|---|
| Conservative | Iain Sproat | 32,369 | 51.9 | +0.1 | |
| Liberal Democrat | Pauline A. Bevan | 15,210 | 24.4 | −6.1 | |
| Labour | Ralph Knight | 14,511 | 23.3 | +5.8 | |
| Natural Law | Eileen P. McGrath | 279 | 0.4 | N/A | |
| Majority | 17,159 | 27.5 | +6.2 | ||
| Turnout | 62,369 | 77.7 | +4.2 | ||
| Conservative hold | Swing | +3.1 | |||
| Party | Candidate | Votes | % | ± | |
|---|---|---|---|---|---|
| Labour | Ivan Henderson | 20,740 | 38.8 | +14.1 | |
| Conservative | Iain Sproat | 19,524 | 36.5 | −15.2 | |
| Liberal Democrat | Ann M. Elvin | 7,037 | 13.1 | -10.0 | |
| Referendum | Jeffrey Titford | 4,923 | 9.2 | N/A | |
| Independent | Ralph Knight | 1,290 | 2.4 | N/A | |
| Majority | 1,216 | 2.3 | |||
| Turnout | 53,514 | 70.5 | −3.3 | ||
| Labour gain from Conservative | Swing | −14.7 | |||
Elections in the 2000s
| Party | Candidate | Votes | % | ± | |
|---|---|---|---|---|---|
| Labour | Ivan Henderson | 21,951 | 45.6 | +6.9 | |
| Conservative | Iain Sproat | 19,355 | 40.2 | +3.7 | |
| Liberal Democrat | Peter Wilcock | 4,099 | 8.5 | −4.6 | |
| UKIP | Tony Finnegan-Butler | 2,463 | 5.1 | N/A | |
| Independent | Clive Lawrance | 247 | 0.5 | N/A | |
| Majority | 2,596 | 5.4 | +3.1 | ||
| Turnout | 48,115 | 62.1 | −8.4 | ||
| Labour hold | Swing | +5.3 | |||
| Party | Candidate | Votes | % | ± | |
|---|---|---|---|---|---|
| Conservative | Douglas Carswell | 21,235 | 42.1 | +1.9 | |
| Labour | Ivan Henderson | 20,315 | 40.3 | −5.3 | |
| Liberal Democrat | Keith Tully | 5,913 | 11.7 | +3.2 | |
| UKIP | Jeffrey Titford | 2,314 | 4.6 | −0.5 | |
| Respect | John Tipple | 477 | 0.9 | N/A | |
| Independent | Christopher Humphrey | 154 | 0.3 | N/A | |
| Majority | 920 | 1.8 | |||
| Turnout | 50,408 | 62.6 | +0.5 | ||
| Conservative gain from Labour | Swing | −3.6 | |||
See also
References
- 1 2 3 Leigh Rayment's Historical List of MPs – Constituencies beginning with "H" (part 1)
- 1 2 The Spectator, Volume 7. F. C. Westley. 1834. p. 702. Retrieved 13 May 2018.
- 1 2 The Spectator, Volume 10. F. C. Westley. 1837. p. 651. Retrieved 13 May 2018.
- 1 2 Sperling, Charles Frederick Denne (1896). A short history of the borough of Sudbury, in the county of Suffolk, compiled from materials collected by W.W. Hodson. Sudbury. pp. 162, 259. Retrieved 13 May 2018.
- 1 2 "General Intelligence". Coventry Standard. 24 June 1853. p. 2. Retrieved 13 May 2018 – via British Newspaper Archive. (Subscription required (help)).
- 1 2 "Harwich Election". Westmorland Gazette. 31 May 1851. p. 2. Retrieved 13 May 2018 – via British Newspaper Archive. (Subscription required (help)).
- ↑ Cousin, John William (1910). "

- ↑ Fisher, David R. (2009). "HOBHOUSE, John Cam (1786-1869)". The History of Parliament. Retrieved 13 May 2018.
- ↑
- ↑ Bloy, Marjorie (2014). "John Cam Hobhouse, Baron Broughton (1786-1869)". A Web of English History. Retrieved 13 May 2018.
- ↑ "Postscript". Exeter and Plymouth Gazette. 11 March 1848. p. 8. Retrieved 13 May 2018 – via British Newspaper Archive. (Subscription required (help)).
- ↑ "Imperial Parliament". Exeter and Plymouth Gazette. 31 May 1851. p. 8. Retrieved 13 May 2018 – via British Newspaper Archive. (Subscription required (help)).
- ↑ "Harwich Election". Morning Post. 29 May 1851. p. 4. Retrieved 13 May 2018 – via British Newspaper Archive. (Subscription required (help)).
- 1 2 "Neighbouring Counties". Cambridge Chronicle and Journal. 19 July 1851. p. 8. Retrieved 13 May 2018 – via British Newspaper Archive. (Subscription required (help)).
- ↑
- ↑ Waterston, Elizabeth. "Warburton, George Drought". Dictionnaire biographique du Canada. Retrieved 13 May 2018.
- 1 2 3 4 5 6 7 8 9 10 11 12 13 14 15 Craig, F. W. S., ed. (1977). British Parliamentary Election Results 1832-1885 (e-book)
|format=requires|url=(help) (1st ed.). London: Macmillan Press. ISBN 978-1-349-02349-3. - ↑ "Harwich Election". The Ipswich Journal. 31 May 1851. p. 4. Retrieved 13 May 2018 – via British Newspaper Archive. (Subscription required (help)).
- ↑ "Election Committees". Morning Chronicle. 2 May 1853. p. 3. Retrieved 13 May 2018 – via British Newspaper Archive. (Subscription required (help)).
- ↑ "South Essex Election". Chelmsford Chronicle. 3 April 1857. p. 4. Retrieved 13 May 2018 – via British Newspaper Archive. (Subscription required (help)).
- ↑ "Election Intelligence". Norfolk News. 12 December 1857. p. 5. Retrieved 13 May 2018 – via British Newspaper Archive. (Subscription required (help)).
- ↑ Eddowes's Journal, and General Advertiser for Shropshire, and the Principality of Wales. 23 December 1857. p. 3 https://www.britishnewspaperarchive.co.uk/viewer/bl/0001466/18571223/030/0003. Retrieved 13 May 2018 – via British Newspaper Archive. (Subscription required (help)). Missing or empty
|title=(help) - ↑ "Harwich Election". London Daily News. 24 April 1860. p. 6. Retrieved 16 February 2018 – via British Newspaper Archive. (Subscription required (help)).
- ↑ "The General Election". The Examiner. 15 July 1865. pp. 7–11. Retrieved 16 February 2018 – via British Newspaper Archive. (Subscription required (help)).
- ↑ "Harwich Election". Chelmsford Chronicle. 14 July 1865. pp. 6–7. Retrieved 16 February 2018 – via British Newspaper Archive. (Subscription required (help)).
- ↑ "Candidates for Essex and Neigh". Essex Newsman. 13 Mar 1880. p. 3. Retrieved 28 November 2017 – via British Newspaper Archive. (Subscription required (help)).
- 1 2 3 4 5 6 7 8 British Parliamentary Election Results 1885-1918, FWS Craig
- 1 2 3 4 5 6 The Liberal Year Book, 1907
- ↑ Debrett's House of Commons & Judicial Bench, 1886
- ↑ Debrett's House of Commons & Judicial Bench, 1896
- ↑ Debrett's House of Commons & Judicial Bench, 1901
- ↑ Debrett's House of Commons & Judicial Bench, 1901
- ↑ Debrett's House of Commons & Judicial Bench, 1916
- ↑ Debrett's House of Commons & Judicial Bench, 1916
- 1 2 3 4 5 6 7 8 British parliamentary election results 1918-1949, Craig, F. W. S.
- ↑ Report of the Annual Conference of the Labour Party, 1939
- ↑ Kimber, Richard. "UK General Election results 1951". Political Science Resources. Retrieved 13 December 2016.
- ↑
- ↑ "Archived copy". Archived from the original on 2012-02-04. Retrieved 2013-03-03.
- ↑ Kimber, Richard. "UK General Election results 1955". Political Science Resources. Retrieved 13 December 2016.
- ↑
- ↑ Kimber, Richard. "UK General Election results 1959". Political Science Resources. Retrieved 13 December 2016.
- ↑
- ↑ Kimber, Richard. "UK General Election results 1964". Political Science Resources. Retrieved 13 December 2016.
- ↑
- ↑ Kimber, Richard. "UK General Election results 1966". Political Science Resources. Retrieved 13 December 2016.
- ↑
- ↑ http://www.politicsresources.net/area/uk/ge70/i10.htm
- ↑ http://www.politicsresources.net/area/uk/ge74a/i10.htm
- ↑ http://www.politicsresources.net/area/uk/ge74b/i10.htm
- ↑ http://www.politicsresources.net/area/uk/ge79/i10.htm
- ↑ "Election Data 1983". Electoral Calculus. Archived from the original on 15 October 2011. Retrieved 18 October 2015.
- ↑ http://www.election.demon.co.uk/1983EC.html
- ↑ "Election Data 1987". Electoral Calculus. Archived from the original on 15 October 2011. Retrieved 18 October 2015.
- ↑ "Election Data 1992". Electoral Calculus. Archived from the original on 15 October 2011. Retrieved 18 October 2015.
- ↑ "Politics Resources". Election 1992. Politics Resources. 9 April 1992. Retrieved 2010-12-06.
- ↑ "Election Data 1997". Electoral Calculus. Archived from the original on 15 October 2011. Retrieved 18 October 2015.
- ↑ http://www.election.demon.co.uk/1997EC.html
- ↑ "Election Data 2001". Electoral Calculus. Archived from the original on 15 October 2011. Retrieved 18 October 2015.
- ↑ "Election Data 2005". Electoral Calculus. Archived from the original on 15 October 2011. Retrieved 18 October 2015.