Economy of Vietnam
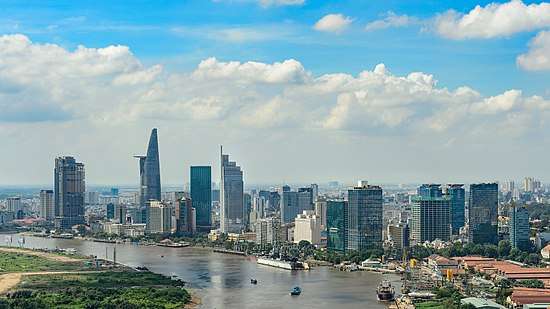 Ho Chi Minh City is the financial center of Vietnam | |
| Currency | Vietnamese đồng |
|---|---|
| Calendar year | |
Trade organisations | AFTA, WTO, APEC, ASEAN, FAO |
| Statistics | |
| GDP |
$241.434 billion (2018, nominal)[1] $707.620 billion (2018, PPP)[1] |
| GDP rank | 47th (nominal); 35th (PPP) |
GDP growth |
6.7% (2015), 6.2% (2016), 6.8% (2017e), 6.8% (2018f) [2] |
GDP per capita |
$2,553 (2018, nominal)[1] $7,482 (2018, PPP)[1] |
GDP by sector | Agriculture: 15.34%, industry: 39%, services: 44% (2017 est.)[3] |
|
| |
Population below poverty line | 8.4% (2016 est.)[3] |
|
| |
Labour force | 55.1 million (as of 1/4/2018)[3] |
Labour force by occupation | Agriculture: 38.6%, industry: 26.7%, services: 34.7% (Q1/2018 est.)[3] |
| Unemployment | 2.2% (Q1/2018)[3] |
Average gross salary | đ 6.5 million / $300 monthly (September 2017)[5] |
Main industries | Mobile phone, electronics, machinery, steel, food processing, wood industry, textile, footwear, vehicle, rice, coffee, cashews, seafood, vegetable and tourism |
| 68th (2018)[6] | |
| External | |
| Exports |
|
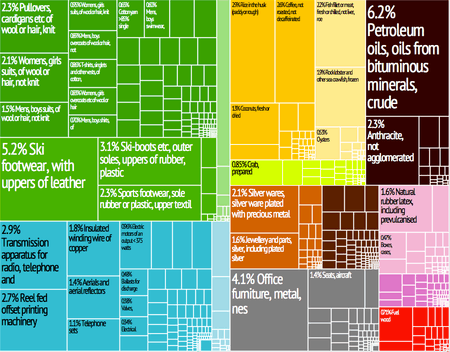
Export goods | Mobile phone, textiles products, electronics, machinery, footwear products, transportation products, wooden products, seafood products, steel, crude oil, pepper, rice and coffee |
Main export partners |
Others 39.8% (2017 est.)[7] |
| Imports |
|
Import goods | Machinery and equipment, mobile phone, petroleum products, raw materials for the clothing and shoe industries, electronics, plastics, automobiles, metal, and chemical products |
Main import partners |
Others 37.4% (2017 est.)[8] |
FDI stock |
|
Gross external debt |
|
| Public finances | |
|
$594.9 billion (PPP, 2016 est.)[10] | |
| Revenues | $48.04 billion (2016 est.)[10] |
| Expenses | $57.21 billion (2016 est.)[10] |
| Economic aid | $2.174 billion (2016) |
|
Standard & Poor's:[11] BB- (domestic) BB- (foreign) BB- (T&C assessment) Outlook: stable[12] Moody's:[12] Ba3 Outlook: Positive Fitch:[12] BB Outlook: stable | |
The socialist-oriented market economy of the Socialist Republic of Vietnam is the 47th-largest economy in the world measured by nominal gross domestic product (GDP) and 35th-largest in the world measured by purchasing power parity (PPP). The country is a member of Asia-Pacific Economic Cooperation, Association of Southeast Asian Nations and the World Trade Organization.
Since the mid-1980s, through the Doi Moi reform period Vietnam has made a shift from a highly centralized command economy to a mixed economy that uses both directive and indicative planning through five-year plans. Over that period, the economy has experienced rapid growth. In the 21st century, Vietnam is in a period of being integrated into the global economy. Almost all Vietnamese enterprises are small and medium enterprises (SMEs). Vietnam has become a leading agricultural exporter and served as an attractive destination for foreign investment in Southeast Asia. In a similar fashion to other Communist countries after the end of the Cold War, the planned economy of Vietnam lost the momentum for productivity and sustainable growth. In the current period, Vietnam's economy relies largely on foreign direct investment to attract the capital from overseas to support its continual economic rigor.[13] Foreign investment on the luxury hotel and sector and resorts will rise to support high-end tourist industry.[14]
According to a forecast by PricewaterhouseCoopers in February 2017, Vietnam may be the fastest-growing of the world's economies, with a potential annual GDP growth rate of about 5.1%, which would make its economy the 20th-largest in the world by 2050.[15] Vietnam has also been named among the Next Eleven and CIVETS countries. Despite economic achievement following Doi Moi, there exist issues that cause many analysts and researchers to remain worried about the economic slowdown in the country in recent years.[16][17]
History
Until 1858
Civilization in Vietnam had been built on agriculture. The feudal dynasties always considered agriculture as the main economic base, and their economic thoughts have been predicated on physiocracy. Land ownership was regulated, and such large-scale works as dykes were constructed in the Red River Delta to facilitate wet rice cultivation. In peaceful times, soldiers were sent home to do farm work. Furthermore, the court prohibited slaughtering water buffalo and cattle and held many agriculture-related ceremonies. Handicrafts and art were valued, but commerce was deprecated, and businessmen were called by the derogatory term con buôn. The national economy was self-sufficient.
From the 16th century, Confucianism was losing its influence on Vietnamese society and a monetary economy began to develop. Early commercial ports, such as Hội An, were constrained, and foreign countries with their different cultures and their invasion ambitions were seen as a threat. This policy of closure led to a degree of stagnation in the Vietnamese economy, and contributed to Vietnam becoming a French colony.
1858–1975
Until the French colonization in the mid-19th century, Vietnam's economy had been mostly agrarian, subsistence-based and village-oriented. French colonizers, however, deliberately developed the regions differently as the French needed raw materials and a market for French manufactured goods, designating the South for agricultural production as it was better suited for agriculture, and the North for manufacturing as it was naturally wealthy in mineral resources. Though the plan exaggerated regional divisions, the development of exports—coal from the North, rice from the South—and the importation of French manufactured goods stimulated domestic commerce.[18]
The separation distorted the basic Vietnamese economy by overly stressing regional economic differences. In the South, while irrigated rice remained the principal subsistence crop, the French introduced plantation agriculture with products such as tea, cotton, and tobacco. The colonial government also developed some extractive industries, such as the mining of coal, iron, and nonferrous metals. A shipbuilding industry was begun in Hanoi; railroads, roads, power stations, and hydraulics works were constructed. In the South, agricultural development concentrated on rice cultivation, and, nationally, rice and rubber were the main items of export. Domestic and foreign trade were centered around the Saigon-Cholon area. Industry in the South consisted mostly of food-processing plants and factories producing consumer goods.[19]
When the North and South were divided politically in 1954, they also adopted different economic ideologies: communism in the North and capitalism in the South. Destruction caused by the Second Indochina War from 1954 to 1975 seriously strained the economy. The situation was worsened by the country's 1.5 million military and civilian deaths, and the subsequent exodus of 1 million refugees, including tens of thousands of professionals, intellectuals, technicians and skilled workers.[18]
| Year | 1956 | 1958 | 1960 | 1962 | 1964 | 1966 | 1968 | 1970 | 1972 | 1974 |
|---|---|---|---|---|---|---|---|---|---|---|
| Republic of Vietnam | 62 | 88 | 105 | 100 | 118 | 100 | 85 | 81 | 90 | 65 |
| Democratic Republic of Vietnam | 40 | 50 | 51 | 68 | 59 | 60 | 55 | 60 | 60 | 65 |
1976–1997
The government's Second Five-Year Plan (1976–1981) aimed for extraordinarily high annual growth rates in industrial and agricultural sectors and national income and sought to integrate the North and the South, but the goals were not attained. The economy remained dominated by small-scale production, low labor productivity, unemployment, material and technological shortfalls, and insufficient food and consumer goods.[18] The more modest goals of the Third Five-Year Plan (1981–85) were a compromise between ideological and pragmatic factions; they emphasized the development of agriculture and industry. Efforts were also made to decentralize planning and improve the managerial skills of government officials.[18]
After reunification in 1975, the economy of Vietnam was plagued by enormous difficulties in production, imbalances in supply and demand, inefficiencies in distribution and circulation, soaring inflation rates, and rising debt problems. Vietnam is one of the few countries in modern history to experience a sharp economic deterioration in a postwar reconstruction period. Its peacetime economy was one of the poorest in the world and had shown a negative to very slow growth in total national output as well as in agricultural and industrial production. Vietnam's gross domestic product ( GDP) in 1984 was valued at US$18.1 billion with a per capita income estimated to be between US$200 and US$300 per year. Reasons for this mediocre economic performance have included severe climatic conditions that afflicted agricultural crops, bureaucratic mismanagement, elimination of private ownership, extinction of entrepreneurial classes in the South, and military occupation of Cambodia (which resulted in a cutoff of much-needed international aid for reconstruction).[20]
From the late 1970s until the early 1990s, Vietnam was a member of the Comecon, and therefore was heavily dependent on trade with the Soviet Union and its allies. Following the dissolution of the Comecon and the loss of its traditional trading partners, Vietnam was forced to liberalize trade, devalue its exchange rate to increase exports, and embark on a policy of economic development.[21]
In 1986, Vietnam launched a political and economic renewal campaign (Đổi Mới) that introduced reforms to facilitate the transition from a centralized economy to a "socialist-oriented market economy". Đổi Mới combined government planning with free-market incentives and encouraged the establishment of private businesses and foreign investment, including foreign-owned enterprises. Furthermore, the Vietnam government stressed the necessity to lower birth rates when developing the economic and social rights of the population by implementing a policy that restricted the number of children per household to two, called the two-child policy.[22] By the late 1990s, the success of the business and agricultural reforms ushered in under Đổi Mới was evident. More than 30,000 private businesses had been created, the economy was growing at an annual rate of more than 7%, and poverty was nearly halved.[21]
Throughout the 1990s, exports increased by as much as 20% to 30% in some years. In 1999, exports accounted for 40% of GDP, an impressive performance in the midst of the economic crisis that hit other countries in Asia. Vietnam became a member of the World Trade Organization (WTO) in 2007, which freed Vietnam from textile quotas enacted worldwide as part of the Multi Fibre Arrangement (MFA) in 1974.[23] The MFA placed restrictions on the import by industrialized countries of textiles from developing countries. For China and other WTO members, however, textile quotas under the MFA expired at the end of 2004 as agreed in the Uruguay Round of trade negotiations in 1994.[21]
Development since 1997

Vietnam's economic policy following the 1997 Asian Financial Crisis has been a cautious one, emphasizing macroeconomic stability rather than growth. While the country shifted toward a more market-oriented economy, the Vietnamese government still continues to hold a tight reign over major state sectors, such as the banking system, state-owned enterprises and foreign trade.[24] GDP growth fell to 6% in 1998 and 5% in 1999.
The signing of the Bilateral Trade Agreement (BTA) between the United States and Vietnam on July 13, 2000, was a significant milestone. The BTA provided for "normal trade relations" (NTR) status of Vietnamese goods in the U.S. market. It was expected that access to the U.S. market would allow Vietnam to hasten its transformation into a manufacturing-based, export-oriented economy. Furthermore, it would attract foreign investment, not only from the U.S., but also from Europe, Asia and other regions.
In 2001, the ruling Communist Party of Vietnam approved a 10-year economic plan that enhanced the role of the private sector, while reaffirming the primacy of the state.[21] Growth then rose to 6% to 7% between 2000 and 2002 even in the midst of the global recession, making it the world's second fastest-growing economy. At the same time, investment grew threefold and domestic savings quintupled.
In 2003, the private sector accounted for more than one-quarter of all industrial output.[21] However, between 2003 and 2005, Vietnam fell dramatically in the World Economic Forum's global competitiveness report rankings, largely due to negative perceptions of the effectiveness of government institutions.[21] Official corruption is endemic, and Vietnam lags in property rights, efficient regulation of markets, and labor and financial market reforms.[21]
Vietnam had an average GDP growth of 7.1% a year from 2000 to 2004. The GDP growth was 8.4% in 2005, the second-largest in Asia, trailing only China's. The government estimated that GDP grew in 2006 by 8.17%. According to the Minister of Planning and Investment, the government targeted a GDP growth of around 8.5% in 2007.[25]
On November 7, 2006, the General Council at the World Trade Organization (WTO) approved Vietnam's accession package. On January 11, 2007, Vietnam officially became the WTO's 149th member, after 11 years of preparation, including eight years of negotiation.[23] The country's access to the WTO was intended to provide an important boost to the economy, as it ensured that the liberalizing reforms continue and created options for trade expansion. However, the WTO accession also brought serious challenges, requiring the economy to open up to increasing foreign competition.
Vietnam’s economy continues to expand at an annual rate in excess of 7%, one of the fastest-growing in the world, but it grew from an extremely low base, as it suffered the crippling effect of the Vietnam War from the 1950s to the 1970s, as well as the austerity measures introduced in its aftermath.[21] In 2012, the communist party was forced to apologise about the mismanagement of the economy after large numbers of SOEs went bankrupt and inflation rose. The main danger has been over the bad debt in the banks totalling to 15% and forecast growth is 5.2% for 2012 but this is also due to the global economic crisis.[26] The government has launched schemes to reform the economy, however, such as lifting foreign ownership cap from 49% and partially privatizing the country's state-owned companies that have been responsible for the recent economic downturn. By the end of 2013, the government is expected to privatize 25–50% of SOEs, only maintaining control on public services and military. The recent reforms have created a major boom in the Vietnamese stock market as confidence in the Vietnamese economy is returning.
Over the last 2 decades, Vietnam has experienced a rapid construction booming that contributed to economic growth but also caused "bubble" to the economy. Skyscrapers ballooned in big cities. According to Skyscrapercity, in 2013, the top three tallest buildings in Vietnam were the Hanoi Landmark 72 (336m), the Hanoi Lotte Center (267m), and the Saigon Bitexco Financial Tower (263m).
Vietnam's current economic turmoil has given rise to question of a new period of changing political economy, however.[27] Poverty remains to be the main concern on the national performance index as of 2018. The Provincial Governance and Public Administration Performance Index (PAPI) found that 28% of survey respondents cited poverty as their main problem.[28] Most respondents agreed with the statement that "[P]overty reduction is imperative to ensuring that Vietnam becomes an advanced, developed country. The percentage of the poorest Vietnamese respondents who believed that their economic situation would worsen increased from 13% in 2016 to 26% in 2017.[29] The percentage of respondents with health insurance increased from 74% in 2016 to 81% in 2017, with strongest gains in the rural population groups.[29]
In 2017, Transparency International, a non-profit that tracks graft ranked Vietnam as 113th worst out of 176 countries and regions for perceptions of corruption.[28] Several graft cases found in 2016 and 2017 led to the corruption crackdown which prosecuted many bankers, businesspeople, and government officials under charges of corruption. PAPI found that bribery at public district hospital services decreased from 17% in 2016 to 9% in 2017.[29] Reports of land seizures went down from an average of about 9% before 2013, to less than 7% in 2017. The amount of respondents who believed that their land was sold at a fair market value decreased from 26% in 2014 to 21% in 2017.[29] Land-use graft and petty graft, such as police officers accepting bribes, are common. Vietnam has been privatizing many of its state-owned operations to reduce corruption and increase efficiency.[30]
As March, 2018 Vietnam's economy continued to grow, having the country best rate in a decade; which led media outlets to speculate if in the near future it could be one of the asian tigers.[31][32]
Data
The following table shows the main economic indicators in 1980–2017. Inflation below 5 % is in green.[33]
| Year | GDP (in Bil. US$ PPP) |
GDP per capita (in US$ PPP) |
GDP growth (real) |
Inflation rate (in Percent) |
Unemployment (in Percent) |
Government debt (in % of GDP) |
|---|---|---|---|---|---|---|
| 1980 | 23.6 | 435 | n/a | n/a | ||
| 1981 | n/a | n/a | ||||
| 1982 | n/a | n/a | ||||
| 1983 | n/a | n/a | ||||
| 1984 | n/a | n/a | ||||
| 1985 | n/a | n/a | ||||
| 1986 | n/a | n/a | ||||
| 1987 | n/a | n/a | ||||
| 1988 | n/a | n/a | ||||
| 1989 | n/a | n/a | ||||
| 1990 | 12.3 % | n/a | ||||
| 1991 | n/a | |||||
| 1992 | n/a | |||||
| 1993 | n/a | |||||
| 1994 | n/a | |||||
| 1995 | n/a | |||||
| 1996 | n/a | |||||
| 1997 | n/a | |||||
| 1998 | n/a | |||||
| 1999 | n/a | |||||
| 2000 | 31.4 % | |||||
| 2001 | ||||||
| 2002 | ||||||
| 2003 | ||||||
| 2004 | ||||||
| 2005 | ||||||
| 2006 | ||||||
| 2007 | ||||||
| 2008 | ||||||
| 2009 | ||||||
| 2010 | ||||||
| 2011 | ||||||
| 2012 | ||||||
| 2013 | ||||||
| 2014 | ||||||
| 2015 | ||||||
| 2016 | ||||||
| 2017 |
Economic sectors
Agriculture, fishery and forestry
In 2003, Vietnam produced an estimated 30.7 million cubic meters of wood. Production of sawn wood was a more modest 2,950 cubic meters. In 1992, in response to dwindling forests, Vietnam imposed a ban on the export of logs and raw timber. In 1997, the ban was extended to all timber products except wooden artifacts. During the 1990s, Vietnam began to reclaim land for forests with a tree-planting program.[21]
Vietnam’s fishing industry, which has abundant resources given the country’s long coastline and extensive network of rivers and lakes, has generally experienced moderate growth. In 2003, the total catch was about 2.6 million tons. However, seafood exports increased fourfold between 1990 and 2002 to more than US$2 billion, driven in part by shrimp farms in the South and "catfish", which are a different species from their American counterparts, but are marketed in the United States under the same name. By selling vast quantities of shrimp and catfish to the U.S., Vietnam triggered antidumping complaints by the U.S., which imposed tariffs in the case of catfish and was considering doing the same for shrimp. In 2005, the seafood industry began to focus on domestic demand to compensate for declining exports.[21]
Vietnam is one of the top rice exporting countries in the world, but the limited sophistication of small-scale Vietnamese farmers causes quality to suffer.[34]
Vietnam is the world's second largest exporter of coffee.[35]
Energy, mining and minerals
Petroleum is the main source of energy, followed by coal, which contributes about 25% of the country’s energy (excluding biomass). Vietnam’s oil reserves are in the range of 270–500 million tons. Oil production rose rapidly to 403,300 barrels per day (64,120 m3/d) in 2004, but output is believed to have peaked and is expected to decline gradually.
In 2003, mining and quarrying accounted for 9.4% of GDP, and the sector employed 0.7% of the workforce. Petroleum and coal are the main mineral exports. Also mined are antimony, bauxite, chromium, gold, iron, natural phosphates, tin, and zinc.[21]
Crude oil was Vietnam’s leading export until the late 2000s, when high-tech electrical manufactures emerged to become the biggest export market (by 2014, crude oil comprised only 5% of Vietnamese exports, compared to 20% of all exports in 1996). This is in part because Vietnam crude oil peaked in 2004, when crude oil represented 22% of all export earnings.[36] Petroleum exports are in the form of crude petroleum because Vietnam has a very limited refining capacity. Vietnam’s only operational refinery, a facility at Cat Hai near Ho Chi Minh City, has a capacity of only 800 barrels per day (130 m3/d). Refined petroleum accounted for 10.2% of total imports in 2002. As of 2012, Vietnam had only one refinery, the Dung Quat refinery, but a second one, the Nghi Son Refinery was planned and was scheduled for construction in May 2013.[21][37]
Vietnam’s anthracite coal reserves are estimated at 3.7 billion tons. Coal production was almost 19 million tons in 2003, compared with 9.6 million tons in 1999. Vietnam’s potential natural gas reserves are 1.3 trillion cubic meters. In 2002, Vietnam brought ashore 2.26 billion cubic meters of natural gas. Hydroelectric power is another source of energy. In 2004, Vietnam confirmed plans to build a nuclear power plant with Russian assistance,[21] and a second by a Japanese group.
Industry and manufacturing
Although the industrial sector contributed 40.1% of GDP in 2004, it employed only 12.9% of the workforce. In 2000, 22.4% of industrial production was attributable to non-state activities. From 1994 to 2004, the industrial sector grew at an average annual rate of 10.3%. Manufacturing contributed 20.3% of GDP in 2004, while employing 10.2% of the workforce. From 1994 to 2004, manufacturing GDP grew at an average annual rate of 11.2%. The top manufacturing sectors — food processing, cigarettes and tobacco, textiles, chemicals, and electrical goods — experienced rapid growth. Benefits from its proximity to China with lower labor cost, Vietnam is becoming a new manufacturing hub in Asia, especially for Japanese and Korean firms. For instance, Samsung produces about 40% of its phones in Vietnam.[38]
Services and tourism
In 2004, services accounted for 38.2% of gross domestic product (GDP). From 1994 to 2004, GDP attributable to the service sector grew at an average annual rate of 6.0%.[21]
In 2012, Vietnam welcomed 6.8 million international visitors and the number is expected to reach over 7 million in 2013. Vietnam keeps emerging as an attractive destination. In Tripadvisor's list of top 25 destinations Asia 2013 by travellers' choice, there are four cities of Vietnam, namely Hanoi, Ho Chi Minh City, Hoi An and Ha Long.
2016 was the first year ever which Vietnam welcomed over 10 million international visitors.[39]
Banking and finance
Banking
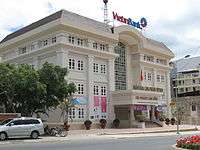
Most efficient and reliable banks are the largest (also state-owned) ones: VietinBank, BIDV, and Vietcombank. The banking sector is dominated by the three institutions. There is also a trend of foreign investment into profitable banks. For example, VietinBank is currently owned by Bank of Tokyo Mitsubishi UFJ (20%) and International Finance Corporation (10%) while Vietcombank is owned by Mizuho (15%).
| Rank | Bank | Date of update | Authorised capital | |
|---|---|---|---|---|
| In VND, billions | In US dollars, billions | |||
| 1 | VietinBank | June 8, 2015 | 37,234 | 1.63 |
| 2 | BIDV | June 30, 2015 | 34,187 | 1.50 |
| 3 | Agribank | June 30, 2015 | 29,605 | 1.30 |
| 4 | Vietcombank | June 30, 2015 | 26,650 | 1.17 |
| 5 | Sacombank | June 9, 2015 | 18,853 | 0.82 |
(NOTE: Exchange rates as of 30 December 2016. Source: tradingeconomics.com. 1 USD = 22,769 VND)
Finance
Vietnam has two stock trading centers, the Ho Chi Minh City Securities Trading Center and the Hanoi Securities Trading Center, which run the Ho Chi Minh Stock Exchange (HOSE) and the Hanoi Stock Exchange (HNX), respectively.
Currency, exchange rate and inflation
Currency
Vietnam's currency is the Vietnamese đồng.
Exchange rate
The exchange rate between the U.S. dollar and the Vietnamese đồng is important because the dong, although not freely convertible, is loosely pegged to the dollar through an arrangement known as a "crawling peg". This mechanism allows the dollar–dong exchange rate to adjust gradually to changing market conditions.[21] As of August 12, 2018, a US dollar is worth 23,277 Vietnamese đồng.
Gold still maintains its position as a physical currency to a certain extent, although it has seen its economic role declining in recent years.[40]
Inflation
Vietnam's economy experienced a hyperinflation period in its early years of the extensive reform program, especially from 1987 to 1992.[41]
In 2008, inflation was tracking at 20.3% for the first half of the year,[42] higher than the 3.4% in 2000, but down significantly from 160% in 1988.[21]
In 2010, inflation stood at 11.5%, and 18.58% in 2011.[43]
At the end of 2012, inflation stood at 7.5%, a substantial decrease from 2011.[44]
In 2013, inflation stood at 6%,[45] and 4.09% in 2014.[46] In 2016, it was only 2%
Mergers and acquisitions
With 1,120 inbound deals with a cumulated value of almost 15 bil. USD, there is a tremendous interest by foreign companies to get access to the Vietnamese market or continue the expansion using mergers and acquisitions. From 1991 to February 2018, Vietnamese companies were involved as either an acquiror or an acquired company in 4,000 mergers and acquisitions with a total value of 40.6 bil. USD. The mergers and acquisitions activities faced many obstacles, lowering the rate of success of the transaction. Common obstacles come from culture, transparency and legal aspects.[47] The Institute for Mergers, Acquisitions and Alliances that has been active in Vietnam since 2006 and its M&A expert Christopher Kummer think that after the peak in 2016 and 2017 the trend will decrease in 2018.[48][49][50] Among the largest and most prominent transactions since 2000 are:
| Date Announced | Acquiror Name | Acquiror Nation | Target Name | Target Nation | Value of Transaction ($mil) |
| 12/19/2017 | Vietnam Beverage Co Ltd | Vietnam | Sabeco | Vietnam | 4,838.49 |
| 02/16/2012 | Perenco SA | France | ConocoPhilips Co-Oil&Gas Asset | Vietnam | 1,290.00 |
| 04/29/2016 | Central Group of Cos | Thailand | Casino Guichard-Perrachon-BigC | Vietnam | 1,135.33 |
| 12/25/2015 | Singha Asia Holding Pte Ltd | Singapore | Masan Consumer Corp | Vietnam | 1,100.00 |
| 02/13/2015 | China Steel Asia Pac Hldg Pte | Singapore | Formosa Ha Tinh (Cayman) Ltd | Vietnam | 939.00 |
| 08/07/2014 | Berli Jucker PCL | Thailand | Metro Cash & Carry Vietnam Co | Vietnam | 875.20 |
| 12/27/2012 | Bk of Tokyo-Mitsubishi UFJ Ltd | Japan | VietinBank | Vietnam | 742.34 |
| 04/17/2015 | TCC Land International Pte Ltd | Singapore | Metro Cash & Carry Vietnam Co | Vietnam | 705.14 |
| 10/05/2011 | Vincom JSC | Vietnam | Vinpearl JSC | Vietnam | 649.39 |
| 01/28/2016 | Masan Grp Corp | Vietnam | Masan Consumer Corp | Vietnam | 600.00 |
All of the top 10 deals are inbound into Vietnam and none outbound.[51]
Trade
Economic relations with the United States are improving, but are not without challenges. Although the United States and Vietnam reached a landmark bilateral agreement in December 2001, which helped increase Vietnam’s exports to the United States, disagreements over textile and catfish exports are hindering full implementation of the agreement. Further disrupting the economic relations between the two countries were efforts in Congress to link non-humanitarian aid to Vietnam's human rights record. Barriers to trade and intellectual property are also within the purview of bilateral discussions.[21]
Given neighboring China's rapid economic ascendancy, Vietnam highly values its economic relationship with China. Following the resolution of most territorial disputes, trade with China is growing rapidly, and in 2004, Vietnam imported more products from China than from any other country. In November 2004, the Association of Southeast Asian Nations (ASEAN), of which Vietnam is a member, and China announced plans to establish the world’s largest free-trade area by 2010.[21]
Vietnam became a member of the World Trade Organization (WTO) on January 11, 2007.[21]
In December 2015, Vietnam joined the ASEAN Economic Community along with the 9 other ASEAN members. The community's goal is to integrate the 10 members of ASEAN and bring a freer flow of labor, investment and trade to the region.[52]
Foreign trade
Trades and balance of trade
Since Đổi Mới in 1986, Vietnam has increased trading, growing both exports and imports in double digits ever since. More recently, alarms on trade account deficits have been raised domestically, especially after joining the WTO in 2007. Throughout the next five years after 2007, Vietnam ran a trade deficit with the rest of the world in the tens of billions of dollars, with the record trade deficit in 2008 of US$18 billion.[42]
The account deficit has since decreased. In 2012, Vietnam recorded a trade surplus of US$780 million, the first trade surplus since 1993. Total trade reached US$228.13 billion, an increase of 12.1% from 2011.[53] In 2013, Vietnam recorded the second year of trade surplus of US$863 million. In 2014, Vietnam recorded the third year of trade surplus of US$2.14 billion, the largest trade surplus ever in history.[54] Three years later, in 2017, it surpassed itself with a record of $2.92 billion.
| Year | Total trade (US$ billions) | Export (US$ billions) | Export change (%) | Import (US$ billions) | Import change (%) | Account balance (US$ billions) |
|---|---|---|---|---|---|---|
| 2001 | 31.20 | 15.00 | 16.20 | -1.2 | ||
| 2002 | 36.40 | 16.70 | 11.3 | 19.70 | 21.6 | -3.0 |
| 2003 | 45.20 | 20.2 | 21.0 | 25.2 | 27.9 | -5.1 |
| 2004 | 58.50 | 26.5 | 31.2 | 32.0 | 27.0 | -5.4 |
| 2005 | 69.40 | 32.4 | 22.3 | 37.0 | 5.7 | -4.5 |
| 2006 | 84.70 | 39.8 | 22.8 | 44.9 | 21.4 | -5.1 |
| 2007 | 111.30 | 48.6 | 22.1 | 62.7 | 39.6 | -14.1 |
| 2008 | 143.40 | 62.7 | 29.0 | 80.7 | 28.7 | -18.0 |
| 2009 | 127.00 | 57.1 | -8.9 | 69.9 | -13.4 | -12.9 |
| 2010 | 157.00 | 72.2 | 26.4 | 84.8 | 21.3 | -12.6 |
| 2011 | 203.41 | 96.91 | 34.2 | 106.75 | 25.8 | -9.84[55] |
| 2012 | 228.57 | 114.57 | 18.2 | 113.79 | 6.6 | 0.780[56] |
| 2013 | 263.47 | 132.17 | 15.4 | 131.30 | 15.4 | 0.863 |
| 2014 | 298.23 | 150.19 | 13.7 | 148.04 | 12.1 | 2.14 |
| 2015 | 327.76 | 162.11 | 7.9 | 165.65 | 12 | -3.54[57] |
| 2016 | 349.20 | 175.94 | 8.6 | 173.26 | 4.6 | 2.68 |
| 2017 | 425.12 | 214.01 | 21.2 | 211.1 | 20.8 | 2.92[58] |
Exports
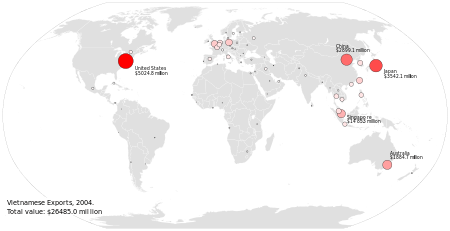
In 2004, Vietnam’s exports of merchandise were valued at US$26.5 billion, and, were growing rapidly along with imports. Vietnam’s principal exports were crude oil (22.1%), textiles and garments (17.1%), footwear (10.5%), fisheries products (9.4%) and electronics (4.1%). The main destinations of Vietnam's exports were the United States (18.8%), Japan (13.2%), China (10.3%), Australia (6.9%), Singapore (5.2%), Germany (4.0%), and the United Kingdom (3.8%).[21]
In 2012, export rose 18.2%, valued at US$114.57 billion.[53] Vietnam's main export market included the EU with US$20 billion, United States with US$19 billion, ASEAN with $US 17.8 billion, Japan with US$13.9 billion, China with US$14.2 billion, and South Korea with US$7 billion.[59]
In 2013, exports rose 15.4%, valued at US$132.17 billion, of which export of electronics now comprised 24.5% of total export, compared with a 4.4% in 2008. Textiles and garments are still an important part in Vietnam's export, valued about US$17.9 billion in 2013.
In 2014, exports rose 13.6%, reaching US$150.1 billion. Electronics and electronics parts, textiles and garments, computers and computer parts are the three main export groups of Vietnam. The United States continued to be Vietnam's largest export market, with US$28.5 billion. The EU is second with US$27.9 billion, ASEAN is third, China is fourth and Japan is the fifth largest export market of Vietnam.
Imports
In 2004 Vietnam’s merchandise imports were valued at US$31.5 billion, and growing rapidly. Vietnam’s principal imports were machinery (17.5%), refined petroleum (11.5%), steel (8.3%), material for the textile industry (7.2%), and cloth (6.0%). The main origins of Vietnam’s imports were China (13.9%), Taiwan (11.6%), Singapore (11.3%), Japan (11.1%), South Korea (10.4%), Thailand (5.8%), and Malaysia (3.8%).[21]
Vietnam import rose 6.6% in 2012, valued at US$113.79 billion.[53] Major import countries were China US$29.2 billion, ASEAN with US$22.3 billion, South Korea with US$16.2 billion, Japan with US$13.7 billion, EU with US$10 billion, and United States with US$6.3 billion.[59]
In 2014, imports rose 12.1%, reaching US$148 billion, most of which are materials and machinery needed for export. China continued to be Vietnam's largest import partner, with US$43.7 billion. The ASEAN is second with US$23.1 billion, South Korea is third, Japan is fourth and the EU is the fifth largest import partner of Vietnam.
External debt, foreign aid and foreign investment
In 2004, external debt amounted to US$16.6 billion, or 37% of GDP.[60][21]
From 1988 to December 2004, cumulative foreign direct investment (FDI) commitments totaled US$46 billion. By December 2004, about 58% had been dispersed. About half of FDI has been directed at the two major cities (and environs) of Ho Chi Minh City and Hanoi. In 2003 new foreign direct investment commitments were US$1.5 billion. The largest sector by far for licensed FDI is industry and construction. Other sectors attracting FDI are oil and gas, fisheries, construction, agriculture and forestry, transportation and communications, and hotels and tourism. From 2006 to 2010, Vietnam hoped to receive US$18 billion of FDI to support a targeted growth rate in excess of 7%. Despite rising investments, foreign investors still regard Vietnam as a risky destination, as confirmed by recent survey by the Japan External Trade Organization of Japanese companies operating in Vietnam. Many of the respondents complained about high costs of utilities, office rentals and skilled labor. Corruption, bureaucracy, lack of transparent regulations and the failure to enforce investor rights are additional obstacles to investment, according to the U.S. State Department. Vietnam tied with several nations for the 102nd place in Transparencies International's Corruption Perceptions Index in 2004.[21]
The World Bank's assistance program for Vietnam has three objectives: to support Vietnam’s transition to a market economy, to enhance equitable and sustainable development and to promote good governance. From 1993 through 2004, Vietnam received pledges of US$29 billion of official development assistance (ODA), of which about US$14 billion, or 49%, has been disbursed. In 2004, international donors pledged ODA of US$2.25 billion, of which US$1.65 billion actually was disbursed. Three donors accounted for 80% of disbursements in 2004: Japan, the World Bank, and the Asian Development Bank. From 2006 to 2010, Vietnam hopes to receive US$14 billion to US$15 billion of ODA.[21]
Pledged foreign direct investment US$21.3 billion for 2007 and a record US$31.6 billion for the first half of 2008.[42] Mergers and acquisitions have gradually become an important channel of investments in the economy, especially after 2005.
Free trade agreements
- ASEAN Free Trade Area (AFTA)
- ASEAN–Australia–New Zealand Free Trade Area (AANZFTA) is a free trade area between ASEAN and ANZCERTA, signed on 27 February 2009[61] and coming into effect on 1 January 2010.[62] Details of the AANZFTA agreement are available online.[63]
- ASEAN–China Free Trade Area (ACFTA), in effect as of 1 January 2010[64]
- ASEAN–India Free Trade Area (AIFTA), in effect as of 1 January 2010[64]
- ASEAN–Japan Comprehensive Economic Partnership (AJCEP)
- ASEAN–Korea Free Trade Area (AKFTA), in effect as of 1 January 2010[64]
- Comprehensive Economic Partnership for East Asia
- Vietnam is negotiating to join the Trans-Pacific Strategic Economic Partnership Agreement.
- On 29 May 2015, Vietnam signed a Free Trade Agreement (FTA) with Eurasian Economic Union.[65]
- On 2 December 2015, the EU and Vietnam announced the conclusion of the negotiations for an EU-Vietnam Free Trade Agreement (FTA).[66]
- Vietnam-Chile Free Trade Agreement (VCFTA) came into effect on 1 January 2014.[67]
- Vietnam-Korea Free Trade Agreement (VKFTA) came into effect on 20 December 2015.[68]
- Japan-Vietnam Economic Partnership Agreement came into effect on 1 October 2009.[69]
Economic indicators and international rankings
| Organization | Title | Year | Ranking |
|---|---|---|---|
| BSA (The Software Alliance) | The IT Industry Competitiveness Index | 2011 | 53 out of 66[70] |
| International Monetary Fund | Gross Domestic Product (PPP) | 2017 | 34 out of 190 |
| World Economic Forum | Global Competitiveness | 2017 | 55 out of 137[71] |
| World Bank | Ease of Doing Business | 2018 | 68 out of 190 |
| The Heritage Foundation/The Wall Street Journal | Index of Economic Freedom | 2018 | 141 out of 180 – mostly unfree (2013)[72] |
| Transparency International | Corruption Perceptions Index | 2016 | 113 out of 177 |
Literature
- Jandl, Thomas (2013). Vietnam in the Global Economy. Lexington Books.
References
- 1 2 3 4 "World Economic Outlook: Vietnam". International Monetary Fund. October 2018. Retrieved 9 October 2018.
- ↑ "World Bank forecasts for Vietnam, June 2018 (p. 151)" (PDF). World Bank. Retrieved 6 September 2018.
- 1 2 3 4 5 6 "Tổng cục Thống kê".
- ↑ "Health, Culture, Sport and Living Standards, Social Order, Safety and Environment". Statistical Yearbook of Viet Nam 2016. General Statistics Office of Vietnam. Archived from the original on 10 September 2018. Retrieved 9 September 2018.
- ↑ (in Vietnamese) http://thoibaotaichinhvietnam.vn/pages/xa-hoi/2017-08-22/luong-binh-quan-nguoi-lao-dong-nam-2017-uoc-dat-65-trieu-dong-46955.aspx. Retrieved 22 January 2018. Missing or empty
|title=(help) - ↑ "Ease of Doing Business in Vietnam". Doingbusiness.org. Retrieved 23 January 2017.
- ↑ "Import Partners of Vietnam". CIA World Factbook. 2012. Retrieved 23 July 2013.
- ↑ "Export Partners of Vietnam". CIA World Factbook. 2012. Retrieved 23 July 2013.
- ↑ "Country Comparision :: Stock Of Direct Foreign Investment - At Home". The World Factbook. Retrieved 12 November 2015.
- 1 2 3 4 "Vietnam". Retrieved 12 June 2018.
- ↑ "Sovereigns rating list". Standard & Poor's. Archived from the original on 3 January 2013. Retrieved 18 February 2013.
- 1 2 3 Rogers, Simon; Sedghi, Ami (15 April 2011). "How Fitch, Moody's and S&P rate each country's credit rating". Reuters. Retrieved 28 September 2012.
- ↑ http://www.imf.org/external/pubs/ft/seminar/2002/fdi/eng/pdf/doanh.pdf
- ↑ http://www.vir.com.vn/room-remains-for-growth-in-luxury-hotel-segment.html
- ↑ "The World in 2050" (PDF). PricewaterhouseCoopers. Retrieved 24 April 2017.
- ↑ http://www.unescap.org/sites/default/files/AWP%20No.%20102.pdf
- ↑ "VDR.pdf" (PDF). WorldBank.org. Retrieved 5 May 2017.
- 1 2 3 4 Vietnam country study. Library of Congress Federal Research Division (December 1987). This article incorporates text from this source, which is in the public domain.
- ↑ "Vietnam - The Economy - Historical Background". Retrieved 3 March 2015.
- ↑ "Vietnam - The Economy". Retrieved 3 March 2015.
- 1 2 3 4 5 6 7 8 9 10 11 12 13 14 15 16 17 18 19 20 21 22 23 24 Vietnam country profile. Library of Congress Federal Research Division (December 2005). This article incorporates text from this source, which is in the public domain.
- ↑ "Vietnam's New Fertility Policy". Population and Development Review. 15 (1): 169–172. March 1989. doi:10.2307/1973424.
- 1 2 World Trade Organization: Accession status: Vietnam
- ↑ Vuong, Quan-Hoang, Financial Markets in Vietnam's Transition Economy: Facts, Insights, Implications. ISBN 978-3-639-23383-4, VDM Verlag, Feb. 2010 Saarbrücken, Germany.
- ↑ SSRN.com Vuong Quan Hoang and Tran Tri Dung, 2009
- ↑ vietnam will struggle to meet 2012 growth target southeast asia, Bloomberg. Retrieved November 4, 2012
- ↑ Vuong Quan Hoang (2014). Vietnam’s Political Economy: A Discussion on the 1986-2014 Period. ULB Centre Emile Bernheim WP N°14-010. Brussels, Belgium Université libre de Bruxelles, May 2014.
- 1 2 VnExpress. "Report paints brighter picture of corruption control in Vietnam - VnExpress International". VnExpress International – Latest news, business, travel and analysis from Vietnam. Retrieved 2018-04-25.
- 1 2 3 4 VnExpress. "Report paints brighter picture of corruption control in Vietnam - VnExpress International". VnExpress International – Latest news, business, travel and analysis from Vietnam. Retrieved 2018-04-08.
- ↑ Jennings, Ralph. "Vietnam's Corruption Crackdown Is All About Protecting Its Economic Miracle From Its SOEs". Forbes. Retrieved 2018-04-08.
- ↑ "Vietnam's economy expands 7.38%, best rate in a decade, Government & …". archive.is. 2018-09-23. Retrieved 2018-09-23.
- ↑ "Vietnam, Asia's newest 'tiger' economy, roars in 2018: QNB". archive.is. 2018-09-23. Retrieved 2018-09-23.
- ↑ "Report for Selected Countries and Subjects". www.imf.org. Retrieved 2018-09-11.
- ↑ Rosen, Elisabeth (24 April 2014). "Why Can't Vietnam Grow Better Rice?". thediplomat.com. The Diplomat. Retrieved 26 April 2014.
- ↑ "BBC News - How Vietnam became a coffee giant". BBC News. Retrieved 3 March 2015.
- ↑ "What did Viet Nam export in 1996? - The Atlas Of Economic Complexity". Retrieved 23 July 2016.
- ↑ "Sẽ khởi công xây dựng nhà máy lọc dầu Nghi Sơn vào tháng 5/2013". 17 November 2012. Retrieved 23 July 2016.
- ↑ "Why Samsung of South Korea is the biggest firm in Vietnam".
- ↑ TITC. "Hơn 10 triệu lượt khách quốc tế đến Việt Nam trong năm 2016". Tổng cục Du lịch Việt Nam. Retrieved 2017-01-02.
- ↑ Vuong Quan Hoang (2003). "Essays on Vietnam's Financial Reforms: Foreign Exchange Statistics and Evidence of Long-Run Equilibrium" (PDF). Economic Studies Review. 43 (6–8). doi:10.2139/ssrn.445080.
- ↑ Napier, Nancy K.; and Vuong, Quan-Hoang. What we see, why we worry, why we hope: Vietnam going forward. Boise, ID, USA: Boise State University CCI Press, October 2013. ISBN 978-0985530587.
- 1 2 3 "Vietnam's economy expands 6.5 percent in first half".
- ↑ "BBC Vietnamese - Kinh tế - Việt Nam: lạm phát 2011 ở mức 18,6%". Retrieved 3 March 2015.
- ↑ "'Lạm phát cả năm 2012 khoảng 7,5%'". VnExpress. Retrieved 3 March 2015.
- ↑ "Vietnam's top 10 economic events of 2013". Retrieved 19 December 2015.
- ↑ "Vietnam's inflation rate to hit over 4 percent in 2014". Archived from the original on 22 December 2015. Retrieved 19 December 2015.
- ↑ "Barriers to mergers and acquisitions business in Vietnam". 108x. Retrieved 2011-08-12.
- ↑ "M&A Experte Vietnam". Retrieved 2016-11-10.
- ↑ "VTV4 Business TV about M&A in Vietnam and Interview with Christopher Kummmer". Retrieved 2016-11-10.
- ↑ "M&A Statistics Vietnam". Retrieved 7 November 2016.
- ↑ "M&A Statistics by Countries - IMAA-Institute". IMAA-Institute. Retrieved 2018-02-23.
- ↑ "The ASEAN Economic Community's Progress". - InvestAsian. Retrieved 3 March 2015.
- 1 2 3 "The page you are looking for is not available at this URL". Daily Times. Retrieved 3 March 2015.
- ↑ "SƠ BỘ TÌNH HÌNH XUẤT KHẨU, NHẬP KHẨU HÀNG HOÁ CỦA VIỆT NAM THÁNG 12 VÀ 12 THÁNG NĂM 2014 - ThongKeHaiQuan: Hải Quan Việt Nam". Retrieved 23 July 2016.
- ↑ "TÌNH HÌNH XUẤT KHẨU, NHẬP KHẨU HÀNG HÓA CỦA VIỆT NAM THÁNG 12 VÀ 12 THÁNG NĂM 2011 - TinHoatDong : Hải Quan Việt Nam". Retrieved 3 March 2015.
- ↑ http://vneconomy.vn/20130117054115934P0C9920/chot-con-so-xuat-sieu-780-trieu-usd-nam-2012.htm Archived 2013-02-22 at the Wayback Machine. author=vneconomy |year=2013
- ↑ "Tình hình xuất khẩu, nhập khẩu hàng hóa của Việt Nam tháng 12 và năm 2015 - ThongKeHaiQuan: Hải Quan Việt Nam". Retrieved 23 July 2016.
- ↑ http://baodautu.vn/so-lieu-chinh-thuc-nam-2017-xuat-khau-214-ty-usd-xuat-sieu-292-ty-usd-d75805.html. Missing or empty
|title=(help) - 1 2 "Tạp chí Cộng Sản - Xuất, nhập khẩu của Việt Nam năm 2012 - kết quả và những vấn đề đặt ra". Archived from the original on 6 November 2014. Retrieved 3 March 2015.
- ↑ "Vietnam- Gross domestic product (GDP) per capita 2020 - Statistic". Statista. Retrieved 5 May 2017.
- ↑ atinder. "Welcome To The World Of Smokeless Cigarettes!". Archived from the original on 27 May 2013. Retrieved 23 July 2016.
- ↑ "ASEAN, Australia and New Zealand Leaders' Statement: Entry into Force of the Agreement Establishing the ASEAN-Australia-New Zealand Free Trade Area 25 October 2009, Cha am Hua Hin, Thailand" (PDF). Archived from the original (PDF) on 29 September 2015. Retrieved 3 March 2015.
- ↑ "ASEAN - Australia - New Zealand Free Trade Agreement (AANZFTA) - ASEAN - Australia - New Zealand Free Trade Agreement". Retrieved 3 March 2015.
- 1 2 3 Pushpanathan, Sundram (22 December 2009). "ASEAN Charter: One year and going strong". The Jakarta Post. Retrieved 1 January 2010.
- ↑ "Vietnam: New Trade Agreement with Eurasia Economic Union - Global Legal Monitor". www.LOC.gov. 16 June 2015. Retrieved 5 May 2017.
- ↑ "Vietnam". Retrieved 19 December 2015.
- ↑ "Vietnam - Chile - WTO and International trade Policies". WTOCenter.vn. Retrieved 5 May 2017.
- ↑ "Vietnam - Korea - WTO and International trade Policies". WTOCenter.vn. Retrieved 5 May 2017.
- ↑ "Vietnam - Japan - WTO and International trade Policies". WTOCenter.vn. Retrieved 5 May 2017.
- ↑ The IT Industry Competitiveness Index
- ↑ "The Global Competitiveness Report 2017 - 2018" (PDF). Africa Competitiveness 2013. Retrieved 3 March 2015.
- ↑ "Country Rankings". Retrieved 3 March 2015.
External links
| Wikimedia Commons has media related to Economy of Vietnam. |
- Vietnam economy
- National Securities Center
- Securities
- FPTS.com.vn, live price of stock
- World Bank Trade Summary Statistics Vietnam 2012
- Vietnam : “Doi moi” and the World Crisis (article)
- Mergers and Acquisitions in Vietnam's Emerging Market Economy: 1990-2009
- Tariffs applied by Vietnam as provided by ITC's Market Access Map, an online database of customs tariffs and market requirements
Next Eleven Economies | |
|---|---|
| History | |||||||||||||
|---|---|---|---|---|---|---|---|---|---|---|---|---|---|
| Geography | |||||||||||||
| Politics |
| ||||||||||||
| Economy |
| ||||||||||||
| Society |
| ||||||||||||
| Nations | |
|---|---|
| Summits | |
| Other | |
| |