Asotin County, Washington
| Asotin County, Washington | |
|---|---|
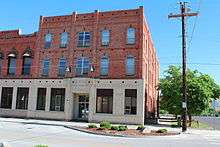 Asotin County Courthouse | |
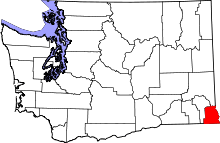 Location in the U.S. state of Washington | |
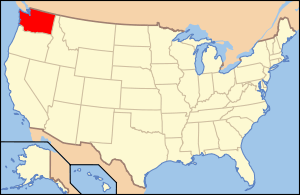 Washington's location in the U.S. | |
| Founded | 27 October, 1883 |
| Seat | Asotin |
| Largest city | Clarkston |
| Area | |
| • Total | 641 sq mi (1,660 km2) |
| • Land | 636 sq mi (1,647 km2) |
| • Water | 4.4 sq mi (11 km2), 0.7% |
| Population (est.) | |
| • (2017) | 22,535 |
| • Density | 35/sq mi (14/km2) |
| Congressional district | 5th |
| Time zone | Pacific: UTC−8/−7 |
| Website |
www |
Asotin County /əˈsoʊtən/ is a county in the U.S. state of Washington. As of the 2010 census, the population was 21,623.[1] The county seat is at Asotin,[2] and its largest city is Clarkston. The county was created out of Garfield County in 1883[3] and derives its name from a Nez Perce word meaning "Eel Creek".
Asotin County is part of the Lewiston, ID-WA metropolitan statistical area, which includes Nez Perce County, Idaho, and Asotin County.
History
The area delineated by the future Washington state boundary began to be colonized at the start of the nineteenth century, both by Americans and Canadians. However, the majority of Canadian exploration and interest in the land was due to the fur trade, whereas American settlers were principally seeking land for agriculture and cattle raising. The Treaty of 1818 provided for dual control of this area by US and Canadian government officials. During this period, the future Washington Territory was divided into two administrative zones: Clark County and Lewis County (made official in 1845).
The dual-control concept was unwieldy and led to continual argument, and occasional conflict. The status of the Washington area was settled in 1846, when the Oregon Treaty ceded the land south of North latitude 49 degrees to American control.
In 1854, Skamania County was split from the original Clark County. Also in 1854, Walla Walla County was split from the new Skamania County. In 1875, Columbia County was split from Walla Walla County, and in 1881, a portion of Columbia County was set off to form Garfield County. The southeastern portion of Garfield County was partitioned in 1883 to form Asotin County. The 1883 boundary of Asotin has remained unchanged until the present time.
Geography
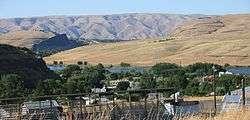
According to the U.S. Census Bureau, the county has an area of 641 square miles (1,660 km2), of which 636 square miles (1,650 km2) is land and 4.4 square miles (11 km2) (0.7%) is water.[4] It is the fifth-smallest county in Washington by area. It is part of the Palouse, a wide and rolling prairie-like region of the middle Columbia basin.
Geographic features
Major highways
Adjacent counties
- Whitman County - north
- Nez Perce County, Idaho - east
- Wallowa County, Oregon - south
- Garfield County - west
National protected area
- Umatilla National Forest (part)
Demographics
| Historical population | |||
|---|---|---|---|
| Census | Pop. | %± | |
| 1890 | 1,580 | — | |
| 1900 | 3,366 | 113.0% | |
| 1910 | 5,831 | 73.2% | |
| 1920 | 6,539 | 12.1% | |
| 1930 | 8,136 | 24.4% | |
| 1940 | 8,365 | 2.8% | |
| 1950 | 10,878 | 30.0% | |
| 1960 | 12,909 | 18.7% | |
| 1970 | 13,799 | 6.9% | |
| 1980 | 16,823 | 21.9% | |
| 1990 | 17,605 | 4.6% | |
| 2000 | 20,551 | 16.7% | |
| 2010 | 21,623 | 5.2% | |
| Est. 2017 | 22,535 | [5] | 4.2% |
| U.S. Decennial Census[6] 1790–1960[7] 1900–1990[8] 1990–2000[9] 2010–2016[1] | |||
2000 census
As of the census[10] of 2000, there were 20,551 people, 8,364 households, and 5,654 families residing in the county. The population density was 32 people per square mile (12/km²). There were 9,111 housing units at an average density of 14 per square mile (6/km²). The racial makeup of the county was 95.62% White, 0.19% Black or African American, 1.27% Native American, 0.51% Asian, 0.02% Pacific Islander, 0.63% from other races, and 1.77% from two or more races. 1.95% of the population were Hispanic or Latino of any race. 25.9% were of German, 12.4% English, 11.9% Irish and 11.0% United States or American ancestry. 97.9% spoke English and 1.6% Spanish as their first language.
There were 8,364 households out of which 31.00% had children under the age of 18 living with them, 51.40% were married couples living together, 11.90% had a female householder with no husband present, and 32.40% were non-families. 27.00% of all households were made up of individuals and 11.70% had someone living alone who was 65 years of age or older. The average household size was 2.42 and the average family size was 2.91.
In the county, the population was spread out with 25.50% under the age of 18, 8.10% from 18 to 24, 26.10% from 25 to 44, 24.00% from 45 to 64, and 16.30% who were 65 years of age or older. The median age was 39 years. For every 100 females, there were 91.10 males. For every 100 females age 18 and over, there were 86.30 males.
The median income for a household in the county was $33,524, and the median income for a family was $40,592. Males had a median income of $35,810 versus $22,218 for females. The per capita income for the county was $17,748. About 11.60% of families and 15.40% of the population were below the poverty line, including 22.70% of those under age 18 and 6.70% of those age 65 or over.
2010 census
As of the 2010 United States Census, there were 21,623 people, 9,236 households, and 5,914 families residing in the county.[11] The population density was 34.0 inhabitants per square mile (13.1/km2). There were 9,872 housing units at an average density of 15.5 per square mile (6.0/km2).[12] The racial makeup of the county was 94.3% white, 1.4% American Indian, 0.5% Asian, 0.4% black or African American, 0.2% Pacific islander, 0.8% from other races, and 2.4% from two or more races. Those of Hispanic or Latino origin made up 3.0% of the population.[11] In terms of ancestry, 32.4% were German, 14.8% were Irish, 13.7% were English, 7.5% were American, and 6.2% were Norwegian.[13]
Of the 9,236 households, 27.7% had children under the age of 18 living with them, 47.5% were married couples living together, 12.1% had a female householder with no husband present, 36.0% were non-families, and 29.4% of all households were made up of individuals. The average household size was 2.32 and the average family size was 2.83. The median age was 43.5 years.[11]
The median income for a household in the county was $41,665 and the median income for a family was $52,250. Males had a median income of $39,633 versus $28,475 for females. The per capita income for the county was $23,731. About 9.9% of families and 13.5% of the population were below the poverty line, including 21.1% of those under age 18 and 6.7% of those age 65 or over.[14]
Politics
Generally, Asotin County is considered a staunchly Republican area, although it has been known to vote for Democrats, especially on the state level. Currently the county is represented at the county commission level by two Republicans and one Independent.
In the 2004 Presidential election gave slightly over 60 percent of the vote to Republican George W. Bush. It was one of 11 of Washington's 39 counties where Bush received a lower percentage of the vote in 2004 than in 2000. Conversely, even though nearly 60 percent of voters selected the Democratic Governor Gary Locke in 2000, in 2004 the Democratic gubernatorial nominee Christine Gregoire received only 41 percent of the vote.
In 2004, 27% of presidential votes were cast from incorporated Clarkston, while 61% was from unincorporated suburbs of Clarkston (34% from Clarkston Heights, 12% from West Clarkston, 9% from South Clarkston, and 6% from Swallows Nest). An additional 6% was cast from the incorporated city of Asotin, with rural areas around Asotin accounting for 4% of the vote and areas around the unincorporated community of Anatone making up 2% of the vote.
By and large, the most competitive areas are Clarkston and its suburbs. Democratic presidential nominee John Kerry won two precincts in 2004, one each in Clarkston and West Clarkston. Bush received 54 percent of the vote in West Clarkston, 55 in Clarkston, and 57 percent in South Clarkston. However, he received larger victories of 64 percent in Clarkston Heights and 67 percent in Swallows Nest. Areas around both Asotin and Anatone delivered 2-to-1 victories, with the lone exception of one of the two incorporated Asotin precincts.
| Year | Republican | Democratic | Third parties |
|---|---|---|---|
| 2016 | 57.6% 5,741 | 31.4% 3,134 | 11.0% 1,099 |
| 2012 | 56.7% 5,654 | 40.1% 4,003 | 3.2% 315 |
| 2008 | 55.7% 5,451 | 42.3% 4,139 | 1.9% 190 |
| 2004 | 60.6% 5,320 | 37.8% 3,319 | 1.7% 147 |
| 2000 | 61.5% 4,909 | 34.3% 2,736 | 4.3% 340 |
| 1996 | 39.1% 2,860 | 45.8% 3,349 | 15.1% 1,102 |
| 1992 | 31.9% 2,425 | 42.6% 3,239 | 25.4% 1,932 |
| 1988 | 45.0% 2,874 | 53.6% 3,422 | 1.4% 88 |
| 1984 | 55.2% 3,876 | 43.3% 3,042 | 1.5% 103 |
| 1980 | 49.2% 3,275 | 40.9% 2,724 | 9.9% 660 |
| 1976 | 47.2% 2,752 | 49.7% 2,898 | 3.1% 178 |
| 1972 | 50.4% 2,911 | 44.3% 2,559 | 5.4% 310 |
| 1968 | 42.5% 2,307 | 49.6% 2,693 | 8.0% 434 |
| 1964 | 32.7% 1,777 | 67.3% 3,657 | 0.0% 2 |
| 1960 | 46.0% 2,640 | 53.9% 3,093 | 0.1% 6 |
| 1956 | 50.2% 2,608 | 49.7% 2,586 | 0.1% 6 |
| 1952 | 55.6% 2,722 | 44.1% 2,160 | 0.3% 12 |
| 1948 | 38.6% 1,384 | 57.3% 2,054 | 4.1% 145 |
| 1944 | 41.8% 1,367 | 57.7% 1,888 | 0.5% 15 |
| 1940 | 41.1% 1,483 | 58.4% 2,107 | 0.6% 21 |
| 1936 | 26.6% 916 | 65.7% 2,261 | 7.7% 266 |
| 1932 | 31.5% 960 | 65.3% 1,994 | 3.2% 98 |
| 1928 | 69.4% 1,812 | 29.7% 776 | 0.9% 24 |
| 1924 | 46.5% 1,094 | 21.6% 508 | 31.9% 750 |
| 1920 | 64.8% 1,210 | 26.6% 497 | 8.5% 159 |
| 1916 | 42.9% 1,004 | 48.6% 1,136 | 8.5% 198 |
| 1912 | 31.4% 579 | 29.9% 551 | 38.8% 715[16] |
| 1908 | 59.6% 648 | 33.6% 365 | 6.8% 74 |
| 1904 | 72.6% 747 | 22.1% 227 | 5.3% 55 |
| 1900 | 52.4% 398 | 43.2% 328 | 4.5% 34 |
| 1896 | 43.9% 214 | 55.2% 269 | 0.8% 4 |
| 1892 | 52.6% 194 | 38.8% 143 | 8.7% 32 |
Communities
Cities
Census-designated places
Unincorporated communities
See also
Footnotes
- 1 2 "State & County QuickFacts". United States Census Bureau. Retrieved 7 January 2014.
- ↑ "Find a County". National Association of Counties. Archived from the original on 31 May 2011. Retrieved 7 June 2011.
- ↑ "Milestones for Washington State History — Part 2: 1851 to 1900". HistoryLink.org. 6 March 2003.
- ↑ "2010 Census Gazetteer Files". United States Census Bureau. 22 August 2012. Retrieved 4 July 2015.
- ↑ "Population and Housing Unit Estimates". Retrieved 4 April 2018.
- ↑ "U.S. Decennial Census". United States Census Bureau. Archived from the original on 12 May 2015. Retrieved 7 January 2014.
- ↑ "Historical Census Browser". University of Virginia Library. Retrieved 7 January 2014.
- ↑ "Population of Counties by Decennial Census: 1900 to 1990". United States Census Bureau. Retrieved 7 January 2014.
- ↑ "Census 2000 PHC-T-4. Ranking Tables for Counties: 1990 and 2000" (PDF). United States Census Bureau. Retrieved 7 January 2014.
- ↑ "American FactFinder". United States Census Bureau. Archived from the original on 11 September 2013. Retrieved 14 May 2011.
- 1 2 3 "Profile of General Population and Housing Characteristics: 2010 Demographic Profile Data". United States Census Bureau. Retrieved 1 March 2016.
- ↑ "Population, Housing Units, Area, and Density: 2010 - County". United States Census Bureau. Retrieved 1 March 2016.
- ↑ "Selected Social Characteristics in the United States – 2006-2010 American Community Survey 5-Year Estimates". United States Census Bureau. Retrieved 1 March 2016.
- ↑ "Selected Economic Characteristics – 2006-2010 American Community Survey 5-Year Estimates". United States Census Bureau. Retrieved 1 March 2016.
- ↑ Leip, David. "Dave Leip's Atlas of U.S. Presidential Elections". uselectionatlas.org. Retrieved 5 April 2018.
- ↑ The leading "other" candidate, Progressive Theodore Roosevelt, received 513 votes, while Socialist candidate Eugene Debs received 133 votes, Prohibition candidate Eugene Chafin received 66 votes, and Socialist Labor candidate Arthur Reimer received 3 votes.
Further reading
- Frank T. Gilbert, Historic Sketches: Walla Walla, Columbia and Garfield Counties, Washington Territory. Portland, OR: A.G. Walling Printing House, 1882.
- Elgin V. Kuykendall, Historic Glimpses of Asotin County, Washington. Clarkston, WA: Clarkston Herald, 1954.
- W.D. Lyman, Lyman's History of Old Walla Walla County, Embracing Walla Walla, Columbia, Garfield and Asotin Counties. In Two Volumes. Chicago: S.J. Clarke Publishing Co., 1918. Volume 1 | Volume 2
- Frederic Ambrose Shaver, An Illustrated History of Southeastern Washington, Including Walla Walla, Columbia, Garfield and Asotin Counties, Washington. Spokane, WA: Western Historical Publishing Co., 1906.
Images


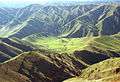 Joseph Canyon as seen from Fields Spring State Park
External links
Places adjacent to Asotin County, Washington | ||||||||||
|---|---|---|---|---|---|---|---|---|---|---|
| ||||||||||
Municipalities and communities of Asotin County, Washington, United States | ||
|---|---|---|
| Cities | | |
| CDPs | ||
| Unincorporated communities | ||
| Ghost towns | ||