2017 Hertfordshire County Council election
The 2017 Hertfordshire County Council election took place on 4 May 2017 as part of the 2017 local elections in the United Kingdom.[1] All 78 councillors were elected from electoral divisions which returned one county councillor each by first-past-the-post voting for a four-year term of office.
| |||||||||||||||||||||||||||||||||
All 78 seats to Hertfordshire County Council 40 seats needed for a majority | |||||||||||||||||||||||||||||||||
|---|---|---|---|---|---|---|---|---|---|---|---|---|---|---|---|---|---|---|---|---|---|---|---|---|---|---|---|---|---|---|---|---|---|
| Turnout | 34.1% | ||||||||||||||||||||||||||||||||
| |||||||||||||||||||||||||||||||||
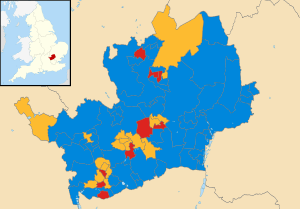 Map showing the results of the 2017 Hertfordshire County Council elections. | |||||||||||||||||||||||||||||||||
| |||||||||||||||||||||||||||||||||
Boundary changes to the electoral divisions took effect at this election after a review of the county by the Local Government Boundary Commission for England increasing the number of seats on the council from 77 to 78.[2][3]
Election results
| Party | Seats | Gains | Losses | Net gain/loss | Seats % | Votes % | Votes | +/− | |
|---|---|---|---|---|---|---|---|---|---|
| Conservative | 51 | 5 | 45.9% | 133,577 | +8.1% | ||||
| Liberal Democrats | 18 | 2 | 25.1% | 73,054 | +8.1% | ||||
| Labour | 9 | −6 | 20.5% | 59,774 | −0.8% | ||||
| Green | 0 | ||||||||
| Independent | 0 | 0.4 | 1,271 | ||||||
| TUSC | 0 | ||||||||
| UKIP | 0 | ||||||||
Results by electoral division
Broxbourne (6 Seats)
| Party | Candidate | Votes | % | ± | |
|---|---|---|---|---|---|
| Conservative | Dave Hewitt* | 1,893 | 61.4 | +11.5 | |
| Labour | Ian Dust | 746 | 24.2 | +7.0 | |
| UKIP | Sidney Pratt | 297 | 9.6 | −16.2 | |
| Liberal Democrats | Lloyd Harris | 145 | 4.7 | −2.2 | |
| Majority | 1,147 | ||||
| Turnout | 3,082 | 25.4 | +2.7 | ||
| Conservative hold | Swing | ||||
| Party | Candidate | Votes | % | ± | |
|---|---|---|---|---|---|
| Conservative | Mark Mills-Bishop | 1,991 | 64.8 | +15.8 | |
| Labour | Tony Renwick | 545 | 17.7 | +1.3 | |
| UKIP | Anthony Faulkner | 390 | 12.7 | −18.9 | |
| Liberal Democrats | David Parry | 143 | 4.7 | +1.9 | |
| Majority | 1,446 | ||||
| Turnout | 3,073 | 25.3 | +5.6 | ||
| Conservative hold | Swing | ||||
| Party | Candidate | Votes | % | ± | |
|---|---|---|---|---|---|
| Conservative | Robert Gordon* | 2,108 | 64.9 | +7.7 | |
| Labour | Selina Elizabeth Norgrove | 572 | 17.6 | +2.3 | |
| UKIP | Stephen James Coster | 369 | 11.4 | −14.0 | |
| Liberal Democrats | Adam Edwards | 190 | 5.8 | +5.8 | |
| Majority | 1,536 | ||||
| Turnout | 3,248 | 26.8 | +4.1 | ||
| Conservative hold | Swing | ||||
| Party | Candidate | Votes | % | ± | |
|---|---|---|---|---|---|
| Conservative | Tim Hutchings* | 2,053 | 59.7 | +18.3 | |
| Labour | Mario Angeli | 544 | 15.8 | ±0.0 | |
| UKIP | David Steven Platt | 448 | 13.0 | −25.3 | |
| Liberal Democrats | Brendan Paul Wyer | 224 | 6.5 | +2.5 | |
| Green | Nicholas John Cox | 163 | 4.7 | +4.7 | |
| Majority | 1,509 | ||||
| Turnout | 3,440 | 28.0 | +2.8 | ||
| Conservative hold | Swing | ||||
| Party | Candidate | Votes | % | ± | |
|---|---|---|---|---|---|
| Conservative | Paul Vincent Mason | 2,469 | 65.5 | +17.1 | |
| Labour Co-op | Janet Ann Wareham | 434 | 11.5 | −2.5 | |
| UKIP | Evelyn Jane Faulkner | 348 | 9.2 | −29.6 | |
| Liberal Democrats | Sara Elizabeth Mihajlovic | 298 | 7.9 | +1.6 | |
| Green | Sally Ann Kemp | 214 | 5.7 | +5.7 | |
| Majority | 2,035 | ||||
| Turnout | 3,772 | 32.3 | +7.8 | ||
| Conservative hold | Swing | ||||
| Party | Candidate | Votes | % | ± | |
|---|---|---|---|---|---|
| Conservative | Dee Hart* | 1,712 | 53.9 | +7.0 | |
| Labour | Bektas Yavuz | 1,184 | 37.3 | +7.1 | |
| Liberal Democrats | Michael Wood | 266 | 8.4 | +8.4 | |
| Majority | 528 | ||||
| Turnout | 3,177 | 26.5 | +2.8 | ||
| Conservative hold | Swing | ||||
Dacorum (10 Seats)
| Party | Candidate | Votes | % | ± | |
|---|---|---|---|---|---|
| Conservative | Ian Reay* | 2018 | 41.4 | −3.7 | |
| Liberal Democrats | Nigel Taylor | 1922 | 39.4 | +34.2 | |
| Labour | Sian Patricia Cusack | 422 | 8.7 | −2.1 | |
| Green | Paul Gregory De Hoest | 410 | 8.4 | −2.8 | |
| UKIP | Amy Anderson | 100 | 2.1 | −8.7 | |
| Majority | 96 | ||||
| Turnout | 4876 | 41.2 | +12.5 | ||
| Conservative hold | Swing | ||||
| Party | Candidate | Votes | % | ± | |
|---|---|---|---|---|---|
| Conservative | Terry Douris | 2226 | 57.7 | +2.8 | |
| Liberal Democrats | Sally Symington | 1018 | 26.4 | +18.6 | |
| Labour | Luke Jordan | 432 | 11.2 | +0.1 | |
| UKIP | John Statham | 170 | 4.4 | −17.7 | |
| Majority | 1208 | ||||
| Turnout | 36.7 | ||||
| Conservative hold | Swing | ||||
| Party | Candidate | Votes | % | ± | |
|---|---|---|---|---|---|
| Conservative | Andrew Derek Williams* | 1946 | 62.0 | ||
| Labour | Barbara Brucelia | 720 | 22.9 | ||
| Liberal Democrats | Anna Wellings Purvis | 291 | 9.3 | ||
| Green | Mark Rutherford | 178 | 5.7 | ||
| Majority | 1226 | ||||
| Turnout | 30.1 | ||||
| Conservative hold | Swing | ||||
| Party | Candidate | Votes | % | ± | |
|---|---|---|---|---|---|
| Conservative | Colette Wyatt-Lowe* | 1550 | 55.6 | ||
| Labour | Stefan Fisher | 664 | 23.8 | ||
| Liberal Democrats | Sammy Barry | 243 | 8.7 | ||
| UKIP | Silvi Sutherland | 232 | 8.3 | ||
| Green | Paul Sandford | 95 | 3.4 | ||
| Majority | 886 | ||||
| Turnout | 29.6 | ||||
| Conservative hold | Swing | ||||
| Party | Candidate | Votes | % | ± | |
|---|---|---|---|---|---|
| Conservative | Fiona Guest | 1966 | 56.0 | ||
| Labour | Mandi Tattershall | 845 | 24.1 | ||
| Liberal Democrats | Steve Wilson | 322 | 9.2 | ||
| UKIP | James Mostyn Froggatt | 191 | 5.4 | ||
| Green | Jane Cousins | 185 | 5.3 | ||
| Majority | 1121 | ||||
| Turnout | 30.9 | ||||
| Conservative hold | Swing | ||||
| Party | Candidate | Votes | % | ± | |
|---|---|---|---|---|---|
| Conservative | Tina Howard | 1397 | 38.3 | ||
| Labour | Ijlal Malik | 1019 | 28.0 | ||
| Independent | Jan Maddern | 818 | 22.5 | ||
| Liberal Democrats | Jack McActeer | 219 | 6.0 | ||
| UKIP | Bruce John Clark | 176 | 4.8 | ||
| Majority | 378 | ||||
| Turnout | 31.1 | ||||
| Conservative hold | Swing | ||||
| Party | Candidate | Votes | % | ± | |
|---|---|---|---|---|---|
| Liberal Democrats | Ron Tindall* | 1413 | 45.6 | ||
| Conservative | Maxine Susan Crawley | 811 | 26.2 | ||
| Labour | Gary Michael Cook | 653 | 21.1 | ||
| UKIP | Ellie Naidoo | 210 | 6.8 | ||
| Majority | 602 | ||||
| Turnout | 29.2 | ||||
| Liberal Democrats hold | Swing | ||||
| Party | Candidate | Votes | % | ± | |
|---|---|---|---|---|---|
| Conservative | William James Wyatt-Lowe* | 1733 | 51.5 | ||
| Labour | Ian Patrick | 711 | 21.1 | ||
| Liberal Democrats | Iain Smith | 684 | 20.3 | ||
| Green | Sherief Mamoun Hassan | 226 | 6.7 | ||
| Majority | 1022 | ||||
| Turnout | 31.9 | ||||
| Conservative hold | Swing | ||||
| Party | Candidate | Votes | % | ± | |
|---|---|---|---|---|---|
| Conservative | Richard Roberts* | 2381 | 66.5 | ||
| Labour | Michael Barton | 444 | 12.4 | ||
| Liberal Democrats | Christopher Townsend | 413 | 11.5 | ||
| Green | Wiebke Carr | 201 | 5.6 | ||
| UKIP | Shirley Ann Pratt | 136 | 3.8 | ||
| Majority | 1937 | ||||
| Turnout | 33.9 | ||||
| Conservative hold | Swing | ||||
| Party | Candidate | Votes | % | ± | |
|---|---|---|---|---|---|
| Liberal Democrats | Nick Hollinghurst* | 2617 | 49.7 | ||
| Conservative | Olive Conway | 1820 | 34.5 | ||
| Labour | Colin Barry Phillips | 360 | 6.8 | ||
| Green | Charlotte Susan Pardy | 256 | 4.9 | ||
| UKIP | Mark Anderson | 207 | 3.9 | ||
| Majority | 797 | ||||
| Turnout | 43.3 | ||||
| Liberal Democrats hold | Swing | ||||
East Herts (10 Seats)
| Party | Candidate | Votes | % | ± | |
|---|---|---|---|---|---|
| Conservative | John Fraser Wyllie | 1517 | 42.1 | ||
| Liberal Democrats | Mione Goldspink | 1437 | 39.9 | ||
| Labour | Val Cooke | 458 | 12.7 | ||
| Green | Madela Baddock | 179 | 5.0 | ||
| Majority | 82 | ||||
| Turnout | 33.5 | ||||
| Conservative hold | Swing | ||||
| Party | Candidate | Votes | % | ± | |
|---|---|---|---|---|---|
| Conservative | Graham McAndrew* | 2090 | 60.5 | ||
| Liberal Democrats | Calvin Laurie Horner | 516 | 14.9 | ||
| Labour | Alex Young | 388 | 11.2 | ||
| UKIP | William Matthew Compton | 301 | 8.7 | ||
| Green | David Rupert Woollcombe | 151 | 4.4 | ||
| Majority | 1574 | ||||
| Turnout | 33.9 | ||||
| Conservative hold | Swing | ||||
| Party | Candidate | Votes | % | ± | |
|---|---|---|---|---|---|
| Conservative | Colin Bernard Woodward* | 1894 | 52.2 | ||
| Labour | Riccardo La Torre | 747 | 20.6 | ||
| Liberal Democrats | Bob Taylor | 604 | 16.6 | ||
| UKIP | Robert Joseph Patterson | 227 | 6.3 | ||
| Green | Alexandra Ancilla Daar | 153 | 4.2 | ||
| Majority | 1147 | ||||
| Turnout | 31.5 | ||||
| Conservative hold | Swing | ||||
| Party | Candidate | Votes | % | ± | |
|---|---|---|---|---|---|
| Conservative | Jeff Jones | 2281 | 68.6 | ||
| Labour | Steven Charles Stone | 391 | 11.8 | ||
| Liberal Democrats | Carole Vivienne Luck | 289 | 8.7 | ||
| UKIP | Darren Cowell | 204 | 6.1 | ||
| Green | Tabitha Jane Evans | 156 | 4.7 | ||
| Majority | 1890 | ||||
| Turnout | 32.3 | ||||
| Conservative hold | Swing | ||||
| Party | Candidate | Votes | % | ± | |
|---|---|---|---|---|---|
| Conservative | Andrew Stevenson* | 1908 | 54.9 | ||
| Labour | Veronica Elizabeth Fraser | 797 | 22.9 | ||
| Liberal Democrats | John William Wiggett | 492 | 14.1 | ||
| Green | Ray Bomber | 272 | 7.8 | ||
| Majority | 1111 | ||||
| Turnout | 33.7 | ||||
| Conservative hold | Swing | ||||
| Party | Candidate | Votes | % | ± | |
|---|---|---|---|---|---|
| Conservative | Ken Crofton* | 2947 | 72.6 | ||
| Labour | Catherine Anne Henderson | 430 | 10.6 | ||
| Liberal Democrats | Katie Beaujeux | 387 | 9.5 | ||
| Green | Lydia Helen Somerville | 291 | 7.2 | ||
| Majority | 2517 | ||||
| Turnout | 37.7 | ||||
| Conservative hold | Swing | ||||
| Party | Candidate | Votes | % | ± | |
|---|---|---|---|---|---|
| Conservative | Bob Deering | 1650 | 50.8 | ||
| Labour | Rachel Louise Houghton | 855 | 26.3 | ||
| Liberal Democrats | Andrew James Robert Porrer | 477 | 14.7 | ||
| Green | Tony Tarrega | 263 | 8.1 | ||
| Majority | 795 | ||||
| Turnout | 29.2 | ||||
| Conservative hold | Swing | ||||
| Party | Candidate | Votes | % | ± | |
|---|---|---|---|---|---|
| Conservative | Eric Henry Buckmaster | 2375 | 61.8 | ||
| Liberal Democrats | Julia Mary Davies | 532 | 13.8 | ||
| Labour | Sotirios Adamopoulos | 454 | 11.8 | ||
| UKIP | Michael John Shaw | 291 | 7.6 | ||
| Green | Isabelle Mary Robinson | 188 | 4.9 | ||
| Majority | 1843 | ||||
| Turnout | 31.5 | ||||
| Conservative hold | Swing | ||||
| Party | Candidate | Votes | % | ± | |
|---|---|---|---|---|---|
| Conservative | David Andrews* | 1771 | 55.2 | ||
| Liberal Democrats | John Francis William Wing | 598 | 18.6 | ||
| Labour | Murray Michael Andrew Sackwild | 439 | 13.7 | ||
| UKIP | Blaise Hugo Archdale Morris | 197 | 6.1 | ||
| Green | Carolyn Westlake | 197 | 6.1 | ||
| Majority | 1173 | ||||
| Turnout | 30.4 | ||||
| Conservative hold | Swing | ||||
| Party | Candidate | Votes | % | ± | |
|---|---|---|---|---|---|
| Conservative | Jonathan Stephen Kaye | 1590 | 64.0 | ||
| Liberal Democrats | Sean Michael Shaw | 458 | 14.3 | ||
| Labour | Hani Latif | 444 | 13.9 | ||
| Green | Glen Leslie Baker | 242 | 7.6 | ||
| Majority | 1590 | ||||
| Turnout | 28.9 | ||||
| Conservative hold | Swing | ||||
Hertsmere (7 seats)
North Herts (9 seats)
St Albans (10 seats)
| Party | Candidate | Votes | % | ± | |
|---|---|---|---|---|---|
| Conservative | David Williams | 2,157 | 53.0 | −0.8 | |
| Liberal Democrats | Paul De Kort | 1,098 | 26.9 | +9.3 | |
| Labour | Linda Spiri | 537 | 13.2 | −1.9 | |
| Green | Lydia El-Khouri | 172 | 4.2 | −8.6 | |
| UKIP | Lester MacKenzie | 103 | 2.5 | N/A | |
| Majority | |||||
| Turnout | |||||
| Conservative hold | Swing | ||||
| Party | Candidate | Votes | % | ± | |
|---|---|---|---|---|---|
| Conservative | Teresa Heritage | 2,882 | 62.4 | −8.0 | |
| Liberal Democrats | Jeffrey Kyndon | 1,032 | 22.3 | +9.8 | |
| Labour | George Fraser | 448 | 9.7 | −2.2 | |
| Green | Tim Robinson | 168 | 3.6 | −2.9 | |
| UKIP | Colin Donald | 84 | 1.8 | N/A | |
| Majority | |||||
| Turnout | 41.5 | ||||
| Conservative hold | Swing | ||||
| Party | Candidate | Votes | % | ± | |
|---|---|---|---|---|---|
| Conservative | Annie Brewster | 2,796 | 62.2 | N/A | |
| Liberal Democrats | Sharon Hollingsworth | 868 | 19.3 | N/A | |
| Labour | Anthony Neville | 479 | 3.3 | N/A | |
| Green | Ian Troughton | 190 | 4.2 | N/A | |
| UKIP | John Midgley | 148 | 3.3 | N/A | |
| Majority | |||||
| Turnout | 40.4 | ||||
| Conservative win (new seat) | |||||
| Party | Candidate | Votes | % | ± | |
|---|---|---|---|---|---|
| Liberal Democrats | Christopher White | 2,644 | 55.0 | +18.1 | |
| Conservative | Alec Campbell | 1,040 | 21.6 | +0.1 | |
| Labour | Glenys Vaughan | 567 | 11.8 | −6.8 | |
| Green | Keith Cotton | 526 | 10.9 | −11.7 | |
| TUSC | Keith Hussey | 22 | 0.5 | N/A | |
| Majority | |||||
| Turnout | |||||
| Liberal Democrats hold | Swing | ||||
| Party | Candidate | Votes | % | ± | |
|---|---|---|---|---|---|
| Liberal Democrats | Anthony Rowlands | 2,339 | 55.0 | +22.5 | |
| Conservative | John Whale | 849 | 20.0 | +3.3 | |
| Labour | John Paton | 753 | 17.7 | −9.5 | |
| Green | Tom Langton | 169 | 4.0 | −2.3 | |
| UKIP | Mick Hawkes | 125 | 2.9 | −13.9 | |
| Majority | |||||
| Turnout | |||||
| Liberal Democrats hold | Swing | ||||
| Party | Candidate | Votes | % | ± | |
|---|---|---|---|---|---|
| Liberal Democrats | Charlotte Hogg | 1,675 | 35.3 | +10.6 | |
| Labour | Roma Mills | 1,604 | 33.8 | −0.8 | |
| Conservative | Brian Ellis | 1,239 | 26.1 | +2.2 | |
| Green | Gillian Mills | 147 | 3.1 | −2.1 | |
| UKIP | Matthew Dovey | 76 | 1.6 | −9.8 | |
| Majority | |||||
| Turnout | |||||
| Liberal Democrats gain from Labour | Swing | ||||
| Party | Candidate | Votes | % | ± | |
|---|---|---|---|---|---|
| Liberal Democrats | Sandy Walkington | 2,899 | 54.9 | +19.2 | |
| Conservative | Richard Curthoys | 1,299 | 24.6 | +1.8 | |
| Labour | Jagat Chatrath | 764 | 14.5 | −7.6 | |
| Green | Jack Easton | 191 | 3.6 | −2.3 | |
| UKIP | Peter Whitehead | 121 | 2.3 | −10.9 | |
| Majority | |||||
| Turnout | |||||
| Liberal Democrats hold | Swing | ||||
| Party | Candidate | Votes | % | ± | |
|---|---|---|---|---|---|
| Labour | Dreda Gordon | 1,326 | 42.5 | N/A | |
| Conservative | Mike Wakely | 1,028 | 33.0 | N/A | |
| Liberal Democrats | Tony Lillico | 476 | 15.3 | N/A | |
| UKIP | Alan Malin | 172 | 5.5 | N/A | |
| Green | Matt Maddock | 112 | 3.6 | N/A | |
| Majority | |||||
| Turnout | |||||
| Labour win (new seat) | |||||
| Party | Candidate | Votes | % | ± | |
|---|---|---|---|---|---|
| Liberal Democrats | John Hale | 2,075 | 45.9 | N/A | |
| Conservative | Claudio Duran | 1,774 | 39.3 | N/A | |
| Labour | Jahida Begum | 389 | 8.6 | N/A | |
| Green | James Lomas | 153 | 3.4 | N/A | |
| UKIP | Tina Lomax | 122 | 2.7 | N/A | |
| Majority | |||||
| Turnout | |||||
| Liberal Democrats win (new seat) | |||||
| Party | Candidate | Votes | % | ± | |
|---|---|---|---|---|---|
| Conservative | Sue Featherstone | 2,200 | 48.5 | +19.0 | |
| Liberal Democrats | David Yates | 1,748 | 38.5 | +1.8 | |
| Labour | Martin McGrath | 344 | 7.6 | +0.1 | |
| UKIP | David Dickson | 152 | 3.3 | −20.1 | |
| Green | Lesley Baker | 90 | 2.0 | −0.8 | |
| Majority | |||||
| Turnout | |||||
| Conservative gain from Liberal Democrats | Swing | ||||
Stevenage (6 seats)
| Party | Candidate | Votes | % | ± | |
|---|---|---|---|---|---|
| Labour Co-op | Sharon Taylor | 1,735 | 51.1 | +2.1 | |
| Conservative | Michelle Frith | 1,277 | 37.6 | +19.6 | |
| Liberal Democrats | Andy McGuiness | 179 | 5.3 | +1.4 | |
| Green | Victoria Snelling | 145 | 4.3 | +0.9 | |
| TUSC | Mark Gentleman | 53 | 1.6 | ±0.0 | |
| Majority | |||||
| Turnout | |||||
| Labour Co-op hold | Swing | ||||
| Party | Candidate | Votes | % | ± | |
|---|---|---|---|---|---|
| Conservative | Adam Mitchell | 1,834 | 49.0 | +13.5 | |
| Labour | Michelle Gardner | 1,445 | 38.6 | −10.6 | |
| Liberal Democrats | Thomas Wren | 270 | 7.2 | +0.8 | |
| Green | Richard Warr | 132 | 3.5 | −5.3 | |
| TUSC | Helen Kerr | 61 | 1.6 | −2.3 | |
| Majority | 389 | 10.4 | |||
| Turnout | 3742 | 34.5 | |||
| Conservative gain from Labour | Swing | ||||
| Party | Candidate | Votes | % | ± | |
|---|---|---|---|---|---|
| Liberal Democrats | Robin Parker | 1,920 | 49.7 | +11.7 | |
| Conservative | Matthew Hurst | 939 | 24.3 | +10.9 | |
| Labour | Simon Speller | 755 | 19.6 | −5.2 | |
| UKIP | Marion Mason | 207 | 5.4 | −15.9 | |
| TUSC | Roger Charles | 34 | 0.9 | +0.5 | |
| Majority | |||||
| Turnout | |||||
| Liberal Democrats hold | Swing | ||||
| Party | Candidate | Votes | % | ± | |
|---|---|---|---|---|---|
| Labour | Joshua Bennett Lovell | 1,552 | 41.6 | +4.2 | |
| Conservative | Graham Lawrence | 1,537 | 41.2 | +9.5 | |
| UKIP | Marilyn Yarnold-Forrester | 253 | 6.8 | −15.0 | |
| Liberal Democrats | Clive Hearmon | 232 | 6.2 | +2.4 | |
| Green | Elizabeth Sturgess | 155 | 4.2 | +0.4 | |
| Majority | |||||
| Turnout | |||||
| Labour hold | Swing | ||||
| Party | Candidate | Votes | % | ± | |
|---|---|---|---|---|---|
| Conservative | Michael Hearn | 1,423 | 44.2 | +15.5 | |
| Labour | Jim Brown | 1,298 | 40.3 | −12.7 | |
| Liberal Democrats | Stephen Booth | 299 | 9.3 | +3.0 | |
| Green | Martin Malocco | 128 | 4.0 | −2.4 | |
| TUSC | Trevor Palmer | 66 | 2.1 | −3.0 | |
| Majority | |||||
| Turnout | |||||
| Conservative gain from Labour | Swing | ||||
| Party | Candidate | Votes | % | ± | |
|---|---|---|---|---|---|
| Conservative | Phil Bibby | 1,601 | 44.7 | +20.0 | |
| Labour | Richard Henry | 1,395 | 39.0 | −1.7 | |
| Liberal Democrats | Graham Snell | 232 | 6.5 | −0.8 | |
| UKIP | Amo Amato | 189 | 5.3 | −19.6 | |
| Green | Vicky Lovelace | 123 | 3.4 | +0.1 | |
| TUSC | Amber Gentleman | 37 | 1.0 | −0.5 | |
| Majority | |||||
| Turnout | |||||
| Conservative gain from Labour | Swing | ||||
Three Rivers (6 seats)
| Party | Candidate | Votes | % | ± | |
|---|---|---|---|---|---|
| Liberal Democrats | Sara Bedford | 2,136 | 56.4 | +4.8 | |
| Conservative | Andrew O'Brien | 950 | 25.1 | +8.7 | |
| Labour | Joanne Cox | 456 | 12.0 | −0.6 | |
| UKIP | David Bennett | 150 | 4.0 | −16.3 | |
| Green | Ian Sturrock | 86 | 2.3 | N/A | |
| Majority | |||||
| Turnout | |||||
| Liberal Democrats hold | Swing | ||||
| Party | Candidate | Votes | % | ± | |
|---|---|---|---|---|---|
| Liberal Democrats | Steve Drury | 2,251 | 58.0 | +7.5 | |
| Conservative | Jussie Kaur | 992 | 25.5 | +8.5 | |
| Labour | Sarah Linhart | 338 | 8.7 | +1.2 | |
| UKIP | Hazel Day | 177 | 4.6 | −18.8 | |
| Green | Simon Fourmy | 119 | 3.1 | +0.3 | |
| Majority | |||||
| Turnout | |||||
| Liberal Democrats hold | Swing | ||||
| Party | Candidate | Votes | % | ± | |
|---|---|---|---|---|---|
| Conservative | Frances Button | 2,419 | 61.3 | ||
| Liberal Democrats | Jo Lucey | 844 | |||
| Labour | Graham Dale | 377 | 9.6 | ||
| UKIP | Michael Matthewson | 157 | 4.0 | ||
| Green | Deesha Chandra | 134 | 3.4 | ||
| Majority | |||||
| Turnout | |||||
| [[|N/A]] hold | Swing | ||||
| Party | Candidate | Votes | % | ± | |
|---|---|---|---|---|---|
| Majority | |||||
| Turnout | |||||
| [[|N/A]] hold | Swing | ||||
| Party | Candidate | Votes | % | ± | |
|---|---|---|---|---|---|
| Majority | |||||
| Turnout | |||||
| [[|N/A]] hold | Swing | ||||
| Party | Candidate | Votes | % | ± | |
|---|---|---|---|---|---|
| Majority | |||||
| Turnout | |||||
| [[|N/A]] hold | Swing | ||||
Watford (6 seats)
| Party | Candidate | Votes | % | ± | |
|---|---|---|---|---|---|
| Liberal Democrats | Stephen Giles-Medhurst | 1,866 | 51.5 | +3.9 | |
| Labour | Sarah Flynn | 782 | 21.6 | −0.3 | |
| Conservative | David Ealey | 710 | 19.6 | +8.9 | |
| Green | James Grant | 130 | 3.6 | −1.4 | |
| UKIP | Gavin Smith | 109 | 3.0 | −10.6 | |
| TUSC | Richard Shattock | 20 | 0.6 | −1.1 | |
| Majority | |||||
| Turnout | |||||
| Liberal Democrats hold | Swing | ||||
| Party | Candidate | Votes | % | ± | |
|---|---|---|---|---|---|
| Liberal Democrats | Kareen Hastrick | 1,575 | 49.3 | +11.1 | |
| Conservative | Linda Topping | 940 | 29.4 | +14.9 | |
| Labour | Diana Ivory | 557 | 17.4 | −2.0 | |
| Green | Maureen Challis | 111 | 3.5 | +0.2 | |
| Majority | |||||
| Turnout | |||||
| Liberal Democrats hold | Swing | ||||
| Party | Candidate | Votes | % | ± | |
|---|---|---|---|---|---|
| Liberal Democrats | Mark Watkin | 2,564 | 52.5 | +11.2 | |
| Conservative | David Fallon | 1,619 | 33.1 | +3.2 | |
| Labour | Edward Tunnah | 452 | 9.3 | +2.9 | |
| Green | Stephanie Grant | 148 | 3.0 | −0.1 | |
| UKIP | Ian Green | 91 | 1.9 | −7.7 | |
| Majority | |||||
| Turnout | |||||
| Liberal Democrats hold | Swing | ||||
| Party | Candidate | Votes | % | ± | |
|---|---|---|---|---|---|
| Labour | Asif Khan | 1,690 | 41.1 | N/A | |
| Liberal Democrats | Ian Stotesbury | 1,545 | 37.6 | N/A | |
| Conservative | Camilla Khawaja | 573 | 13.9 | N/A | |
| Green | Holly Fleming | 285 | 6.9 | N/A | |
| Majority | |||||
| Turnout | |||||
| Labour win (new seat) | |||||
| Party | Candidate | Votes | % | ± | |
|---|---|---|---|---|---|
| Labour | Nigel Bell | 2,063 | 62.3 | N/A | |
| Liberal Democrats | Paul Arnett | 747 | 22.6 | N/A | |
| Conservative | Laveen Ladharam | 414 | 12.5 | N/A | |
| TUSC | Derek Foster | 69 | 2.1 | N/A | |
| Majority | |||||
| Turnout | |||||
| Labour win (new seat) | |||||
| Party | Candidate | Votes | % | ± | |
|---|---|---|---|---|---|
| Liberal Democrats | Tim Williams | 1,662 | 51.4 | +4.5 | |
| Conservative | Dennis Wharton | 789 | 24.4 | +7.5 | |
| Labour | Andy O'Brien | 487 | 15.1 | +1.2 | |
| UKIP | David Penn | 166 | 5.1 | −13.5 | |
| Green | Alison Wiesner | 92 | 2.8 | −0.4 | |
| TUSC | John McShane | 33 | 1.0 | N/A | |
| Majority | |||||
| Turnout | |||||
| Liberal Democrats hold | Swing | ||||
Welwyn Hatfield (8 seats)
Changes before 2021
References
- "Upcoming elections & referendums". Electoral Commission. Retrieved 16 September 2016.
- "The Hertfordshire (Electoral Changes) Order 2015". legislation.gov.uk. Retrieved 16 September 2016.
- "Hertfordshire County Council". Local Government Boundary Commission for England. Retrieved 16 September 2016.
- "County Council Elections 2017 - Election summary". Hertfordshire County Council. Retrieved 5 May 2017.
- https://www.hertfordshire.gov.uk/actweb/election17/div1.htm
- https://www.hertfordshire.gov.uk/actweb/election17/div2.htm
- https://www.hertfordshire.gov.uk/actweb/election17/div3.htm
- https://www.hertfordshire.gov.uk/actweb/election17/div4.htm
- https://www.hertfordshire.gov.uk/actweb/election17/div5.htm
- https://www.hertfordshire.gov.uk/actweb/election17/div6.htm
This article is issued from Wikipedia. The text is licensed under Creative Commons - Attribution - Sharealike. Additional terms may apply for the media files.