2017 Oxfordshire County Council election
The 2017 Oxfordshire County Council election took place on 4 May 2017 as part of the 2017 local elections in the United Kingdom.[1] All 63 councillors were elected from 61 electoral divisions which returned either one or two county councillors each by first-past-the-post voting for a four-year term of office.
| |||||||||||||||||||||||||||||||||||||||||||||||||||||||||||||
All 63 seats to Oxfordshire County Council 32 seats needed for a majority | |||||||||||||||||||||||||||||||||||||||||||||||||||||||||||||
|---|---|---|---|---|---|---|---|---|---|---|---|---|---|---|---|---|---|---|---|---|---|---|---|---|---|---|---|---|---|---|---|---|---|---|---|---|---|---|---|---|---|---|---|---|---|---|---|---|---|---|---|---|---|---|---|---|---|---|---|---|---|
| |||||||||||||||||||||||||||||||||||||||||||||||||||||||||||||
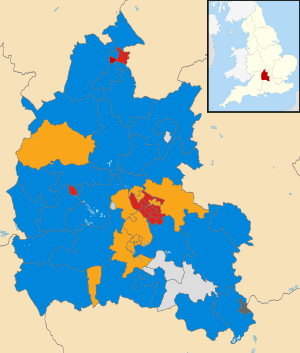 Map showing the results of the 2017 Oxfordshire County Council elections. | |||||||||||||||||||||||||||||||||||||||||||||||||||||||||||||
| |||||||||||||||||||||||||||||||||||||||||||||||||||||||||||||
Results - Summary
| Party | Seats | Gains | Losses | Net gain/loss | Seats % | Votes % | Votes | +/− | |
|---|---|---|---|---|---|---|---|---|---|
| Conservative | 31 | 3 | 3 | 0 | 49.2 | 41.3 | 80,438 | +6.8 | |
| Liberal Democrats | 13 | 2 | 0 | +2 | 20.6 | 24.5 | 47,799 | +8.6 | |
| Labour | 14 | 2 | 3 | -1 | 22.2 | 22.2 | 43,172 | +0.9 | |
| Green | 0 | 0 | 2 | -2 | 0 | 7.2 | 13.978 | -1.8 | |
| Independent | 4 | 0 | 0 | 0 | 6.4 | 3.4 | 6,689 | +0.4 | |
| Henley Residents Group | 1 | 1 | 0 | +1 | 1.6 | 0.9 | 1,747 | +0.4 | |
| UKIP | 0 | 0 | 0 | 0 | 0 | 0.5 | 1,056 | -15.4 | |
Division Results
Abingdon East
| Party | Candidate | Votes | % | ± | |
|---|---|---|---|---|---|
| Liberal Democrats | Alison Rosemary Rooke | 1,699 | 53 | +6 | |
| Conservative | David James Pope | 1,102 | 34 | +8 | |
| Labour | Louis Francis McEvoy | 224 | 7 | -2 | |
| Green | Paul Timothy Norton | 178 | 6 | 0 | |
| Turnout | 3,203 | 42.4 | +7.4 | ||
| Liberal Democrats hold | Swing | +6 | |||
Abingdon North
| Party | Candidate | Votes | % | ± | |
|---|---|---|---|---|---|
| Liberal Democrats | Emily Jane Smith | 2,029 | 51 | +20 | |
| Conservative | Sandy Lovatt | 1,494 | 37 | -2 | |
| Labour | Jon Bounds | 291 | 7 | -1 | |
| Green | Cheryl Karen Briggs | 198 | 5 | -2 | |
| Turnout | 4,012 | 35 | -6 | ||
| Liberal Democrats gain from Conservative | Swing | +11 | |||
Abingdon South
| Party | Candidate | Votes | % | ± | |
|---|---|---|---|---|---|
| Liberal Democrats | Neil Fawcett | 1,559 | 46 | +9 | |
| Conservative | Mike Badcock | 1,308 | 39 | +11 | |
| Labour | George Douglas Ryall | 319 | 9 | -8 | |
| Green | Jim Broadbent | 184 | 5 | 0 | |
| Turnout | 3,370 | 30 | -13 | ||
| Liberal Democrats hold | Swing | +9 | |||
Banbury Calthorpe
| Party | Candidate | Votes | % | ± | |
|---|---|---|---|---|---|
| Conservative | Eddie Reeves | 1294 | 52 | +21 | |
| Labour Co-op | Joe Walsh | 825 | 33 | +1 | |
| Liberal Democrats | Brent Jackson | 213 | 9 | +5 | |
| Green | Bernard Geoffrey Dod | 134 | 5 | 0 | |
| Turnout | 2466 | 29 | +10 | ||
| Conservative gain from Labour | Swing | +10 | |||
Banbury Grimsbury & Castle
| Party | Candidate | Votes | % | ± | |
|---|---|---|---|---|---|
| Labour | Hannah Louise Banfield | 1098 | 48 | +5 | |
| Conservative | Paul Austin Sargent | 819 | 36 | +4 | |
| Liberal Democrats | Dave Wiles | 148 | 6 | +3 | |
| UKIP | Jason Williams | 113 | 5 | -12 | |
| Green | Jack Arthur Barton | 101 | 4 | 0 | |
| Turnout | 2279 | 26 | +2 | ||
| Labour hold | Swing | +5 | |||
Banbury Hardwick
| Party | Candidate | Votes | % | ± | |
|---|---|---|---|---|---|
| Conservative | Tony Ilott | 1131 | 43 | +14 | |
| Labour Co-op | Surinder Dhesi | 1076 | 41 | +6 | |
| Liberal Democrats | Alistair Charles Craig | 165 | 6 | +2 | |
| UKIP | Sara Louise Corr | 148 | 6 | -22 | |
| Green | Andy Aris | 97 | 4 | 0 | |
| Turnout | 2617 | 26 | +3 | ||
| Conservative gain from Labour Co-op | Swing | +4 | |||
Banbury Ruscote
| Party | Candidate | Votes | % | ± | |
|---|---|---|---|---|---|
| Labour Co-op | Mark David Cherry | 1194 | 58 | +14 | |
| Conservative | David Frederick Beverly | 574 | 28 | +1 | |
| UKIP | Linda Michelle Wren | 125 | 6 | -18 | |
| Liberal Democrats | Bette Melling | 86 | 4 | - | |
| Green | Christopher John Manley | 68 | 3 | -2 | |
| Turnout | 2047 | 22 | -1 | ||
| Labour Co-op hold | Swing | +14 | |||
Barton, Sandhills & Risinghurst
| Party | Candidate | Votes | % | ± | |
|---|---|---|---|---|---|
| Labour | Glynis Mary Phillips | 1,087 | 48.5 | -2.3 | |
| Conservative | Cath Convery | 432 | 19.3 | +7.9 | |
| Liberal Democrats | Steve Wheeler | 287 | 12.8 | +1.2 | |
| Independent | Chaka Artwell | 254 | 11.3 | - | |
| Green | Symon James Hill | 175 | 7.8 | +0.3 | |
| Turnout | 2,235 | 33.0 | +9.1 | ||
| Labour hold | Swing | -2.3 | |||
Benson & Cholsey
| Party | Candidate | Votes | % | ± | |
|---|---|---|---|---|---|
| Independent | Mark Stuart Gray | 1645 | 50 | +4 | |
| Conservative | Caroline Anne Newton | 1077 | 33 | +12 | |
| Labour | Jim Merritt | 313 | 9 | +3 | |
| Liberal Democrats | Adrian Lee Cull | 277 | 8 | - | |
| Turnout | 3312 | 31 | -6 | ||
| Independent hold | Swing | +4 | |||
Berinsfield & Garsington
| Party | Candidate | Votes | % | ± | |
|---|---|---|---|---|---|
| Conservative | Elizabeth Lorraine Lindsay-Gale | 1579 | 55 | +8 | |
| Green | Robin Francis Bennett | 543 | 19 | +8 | |
| Liberal Democrats | Simon Geoffrey Davenport Thompson | 418 | 14 | +8 | |
| Labour Co-op | Evelyne Godfrey | 348 | 12 | -3 | |
| Turnout | 2888 | 28 | -8 | ||
| Conservative hold | Swing | +8 | |||
Bicester North
| Party | Candidate | Votes | % | ± | |
|---|---|---|---|---|---|
| Conservative | Lawrie Stratford | 1302 | 55 | +16 | |
| Labour | Margaret Elizabeth Lyon | 535 | 23 | +6 | |
| Liberal Democrats | Daniel Morgan Murphy | 358 | 15 | +9 | |
| UKIP | Bob Massingham | 161 | 7 | -19 | |
| Turnout | 2356 | 25 | +3 | ||
| Conservative hold | Swing | +16 | |||
Bicester Town
| Party | Candidate | Votes | % | ± | |
|---|---|---|---|---|---|
| Conservative | Michael Frederick Waine | 1454 | 61 | +12 | |
| Labour | Sarah Elizabeth Haydon | 585 | 25 | +1 | |
| Green | Robert Joseph Nixon | 176 | 7 | +3 | |
| Liberal Democrats | Conor McKenzie | 166 | 7 | +4 | |
| Turnout | 2381 | 28 | 0 | ||
| Conservative hold | Swing | +12 | |||
Bicester West
| Party | Candidate | Votes | % | ± | |
|---|---|---|---|---|---|
| Independent | Les Sibley | 1559 | 63 | +11 | |
| Conservative | Debbie Pickford | 452 | 18 | -2 | |
| Labour | Chris Howells | 270 | 11 | -2 | |
| Liberal Democrats | Chris Tatton | 74 | 3 | +2 | |
| UKIP | Toni Renee Harris | 68 | 3 | -10 | |
| Green | Liz Taylor | 58 | 2 | 0 | |
| Turnout | 2481 | 29 | -2 | ||
| Independent hold | Swing | +11 | |||
Bloxham & Easington
| Party | Candidate | Votes | % | ± | |
|---|---|---|---|---|---|
| Conservative | Kieron Paul Mallon | 1744 | 61 | +7 | |
| Labour | Susan Christie | 587 | 20 | +5 | |
| Liberal Democrats | Peter Davis | 239 | 8 | +3 | |
| Green | Non Wyn Kinchin-Smith | 174 | 6 | +1 | |
| UKIP | Brian Crockett | 126 | 4 | -17 | |
| Turnout | 2870 | 28 | -5 | ||
| Conservative hold | Swing | +7 | |||
Burford & Carterton North
| Party | Candidate | Votes | % | ± | |
|---|---|---|---|---|---|
| Conservative | Nicholas Anthony Field-Johnson | 1375 | 67 | +18 | |
| Liberal Democrats | Edward Mortimer | 335 | 16 | +5 | |
| Labour Co-op | Dave Wesson | 219 | 11 | +2 | |
| Green | Rosanna Pearson | 128 | 6 | -1 | |
| Turnout | 2057 | 29 | +5 | ||
| Conservative hold | Swing | +18 | |||
Carterton South & West
| Party | Candidate | Votes | % | ± | |
|---|---|---|---|---|---|
| Conservative | Pete Handley | 1691 | 70 | +18 | |
| Labour | Moira Christine Swann | 290 | 12 | +1 | |
| Liberal Democrats | Ivan Aguado Melet | 218 | 9 | +5 | |
| Green | Anthony Edward Barrett | 139 | 6 | 0 | |
| UKIP | David Jack Holms McLeod | 95 | 4 | -23 | |
| Turnout | 2433 | 28 | -9 | ||
| Conservative hold | Swing | +18 | |||
Chalgrove & Watlington
| Party | Candidate | Votes | % | ± | |
|---|---|---|---|---|---|
| Conservative | Steve Harrod | 1884 | 54 | -4 | |
| Liberal Democrats | Sue Cooper | 1224 | 35 | +17 | |
| Labour | P'nina Lesley Drye | 225 | 6 | -7 | |
| Green | Robert James Henry Paynter | 153 | 4 | -8 | |
| Turnout | 3486 | 31 | -4 | ||
| Conservative hold | Swing | -4 | |||
Charlbury & Wychwood
| Party | Candidate | Votes | % | ± | |
|---|---|---|---|---|---|
| Liberal Democrats | Liz Leffman | 2105 | 52 | +22 | |
| Conservative | Rodney Scott Rose | 1579 | 39 | 0 | |
| Labour | Sian Priscilla Florence O'Neill | 210 | 5 | -4 | |
| Green | Celia Jocelyn Kerslake | 132 | 3 | -4 | |
| Turnout | 4026 | 50 | +19 | ||
| Liberal Democrats gain from Conservative | Swing | +6 | |||
Chipping Norton
| Party | Candidate | Votes | % | ± | |
|---|---|---|---|---|---|
| Conservative | Hilary Rose Biles | 1635 | 45 | -4 | |
| Labour Co-op | Geoff Saul | 1231 | 34 | +3 | |
| Liberal Democrats | Andy Graham | 584 | 16 | +13 | |
| Green | Claire Elliane Lasko | 98 | 3 | -1 | |
| UKIP | Jim Stanley | 66 | 2 | -11 | |
| Turnout | 3614 | 44 | +15 | ||
| Conservative hold | Swing | -4 | |||
Churchill & Lye Valley
| Party | Candidate | Votes | % | ± | |
|---|---|---|---|---|---|
| Labour Co-op | Liz Brighouse | 1,339 | 61.6 | -2.3 | |
| Conservative | Johnson Mackline Kyeswa | 373 | 17.1 | +3.1 | |
| Green | Steven Mark Dawe | 264 | 12.1 | -2.7 | |
| Liberal Democrats | Peter Charles Coggins | 199 | 9.1 | +2.5 | |
| Turnout | 2,175 | 26.7 | +8.0 | ||
| Labour Co-op hold | Swing | -2.3 | |||
Cowley
| Party | Candidate | Votes | % | ± | |
|---|---|---|---|---|---|
| Labour | John Leo Sanders | 1,363 | 45.5 | -9.1 | |
| Green | Hazel Frances Dawe | 717 | 23.9 | +10.9 | |
| Independent | Judith Anne Harley | 340 | 11.4 | - | |
| Conservative | Derron Jarell | 335 | 11.2 | -9.1 | |
| Liberal Democrats | Harry Samuels | 234 | 7.8 | +1.8 | |
| Turnout | 2,989 | 35.6 | +13.9 | ||
| Labour hold | Swing | -9.1 | |||
Deddington
| Party | Candidate | Votes | % | ± | |
|---|---|---|---|---|---|
| Conservative | Arash Ali Fatemian | 2154 | 58 | +12 | |
| Labour | Annette Murphy | 509 | 14 | 0 | |
| Liberal Democrats | Ian Richard Thomas | 451 | 12 | +5 | |
| Green | Aaron James Bliss | 434 | 12 | -3 | |
| UKIP | Alan Paul Harris | 146 | 4 | -14 | |
| Turnout | 3694 | 32 | -3 | ||
| Conservative hold | Swing | +12 | |||
Didcot East & Hagbourne
| Party | Candidate | Votes | % | ± | |
|---|---|---|---|---|---|
| Conservative | Simon Richard Clarke | 1164 | 48 | +11 | |
| Labour | Denise MacDonald | 685 | 28 | +3 | |
| Liberal Democrats | Les Hopper | 588 | 24 | +14 | |
| Turnout | 2437 | 25 | -5 | ||
| Conservative hold | Swing | +11 | |||
Didcot Ladygrove
| Party | Candidate | Votes | % | ± | |
|---|---|---|---|---|---|
| Independent | Neville Frank Harris | 965 | 46 | +8 | |
| Conservative | Bill Service | 495 | 24 | -8 | |
| Liberal Democrats | Hayleigh Marie Gascoigne | 441 | 21 | +17 | |
| Labour | Pam Siggers | 191 | 9 | -4 | |
| Turnout | 2092 | 30 | 0 | ||
| Independent hold | Swing | +8 | |||
Didcot West
| Party | Candidate | Votes | % | ± | |
|---|---|---|---|---|---|
| Conservative | Alan Roy Thompson | 1215 | 42 | +18 | |
| Labour | Nick Hards | 1048 | 37 | +5 | |
| Liberal Democrats | Veronika Maria Williams | 465 | 16 | +10 | |
| Green | Tim Eden | 137 | 5 | +3 | |
| Turnout | 2865 | 24 | -9 | ||
| Conservative gain from Labour | Swing | +6.5 | |||
Eynsham
| Party | Candidate | Votes | % | ± | |
|---|---|---|---|---|---|
| Conservative | Charles Christopher Bruce Mathew | 1716 | 44 | +1 | |
| Liberal Democrats | Timothy Martin Bearder | 1621 | 42 | +31 | |
| Labour | Elsa Louise Dawson | 347 | 9 | -6 | |
| Green | Nicholas Goodwin | 188 | 5 | +6 | |
| Turnout | 3872 | 47 | +18 | ||
| Conservative hold | Swing | +1 | |||
Faringdon
| Party | Candidate | Votes | % | ± | |
|---|---|---|---|---|---|
| Conservative | Judy Heathcoat | 1374 | 52 | -2 | |
| Liberal Democrats | David Andrew Grant | 1033 | 39 | +34 | |
| Labour | Stephen Smith | 247 | 9 | -11 | |
| Turnout | 2654 | 38 | +12 | ||
| Conservative hold | Swing | -2 | |||
Goring
| Party | Candidate | Votes | % | ± | |
|---|---|---|---|---|---|
| Conservative | Kevin Bulmer | 1918 | 58 | +11 | |
| Liberal Democrats | Laura Rose Coyle | 601 | 18 | +8 | |
| Labour | Dave Bowen | 393 | 12 | +4 | |
| Green | Jim Dowling | 389 | 12 | -1 | |
| Turnout | 3301 | 28 | +1 | ||
| Conservative hold | Swing | +11 | |||
Grove & Wantage
| Party | Candidate | Votes | % | ± | |
|---|---|---|---|---|---|
| Liberal Democrats | Jenny Hannaby | 2403 | 25 | +4 | |
| Liberal Democrats | Zoé Anne Patrick | 2153 | 23 | +4 | |
| Conservative | Steve Trinder | 1958 | 20 | +4.5 | |
| Conservative | Ben Mabbett | 1738 | 18 | +4.5 | |
| Labour | Jean Elizabeth Nunn-Price | 745 | 8 | -2 | |
| Green | Kevin Alan Harris | 436 | 5 | +1 | |
| Labour | George Etherington | 127 | 1 | -2 | |
| Turnout | 9560 | 27 | -9 | ||
| Liberal Democrats hold | Swing | +4 | |||
| Liberal Democrats hold | Swing | +4 | |||
Hanborough & Minster Lovell
| Party | Candidate | Votes | % | ± | |
|---|---|---|---|---|---|
| Conservative | Liam Martin Simon Walker | 1814 | 52 | +8 | |
| Labour | Merilyn Elizabeth Davies | 812 | 23 | +8 | |
| Liberal Democrats | Andy Crick | 727 | 21 | +10 | |
| Green | Andy Wright | 159 | 5 | -3 | |
| Turnout | 3512 | 43 | +16 | ||
| Conservative hold | Swing | +8 | |||
Headington & Quarry
| Party | Candidate | Votes | % | ± | |
|---|---|---|---|---|---|
| Liberal Democrats | Roz Smith | 2,014 | 54.6 | +15.7 | |
| Labour | Bill Asquith | 1,122 | 30.4 | -7.4 | |
| Conservative | Duncan Valentine Hatfield | 392 | 10.6 | +1.5 | |
| Green | Miranda Shaw | 157 | 4.3 | -1.5 | |
| Turnout | 3,685 | 45.5 | +10.1 | ||
| Liberal Democrats hold | Swing | +15.7 | |||
Hendreds & Harwell
| Party | Candidate | Votes | % | ± | |
|---|---|---|---|---|---|
| Conservative | Mike Fox-Davies | 1683 | 55 | +7 | |
| Liberal Democrats | Jim Loder | 568 | 18 | +6 | |
| Labour | Stephen Edwin Dominic Webb | 537 | 17 | -3 | |
| Green | Nicholas Simon Freestone | 296 | 10 | +10 | |
| Turnout | 3084 | 31 | -8 | ||
| Conservative hold | Swing | +7 | |||
Henley-on-Thames
| Party | Candidate | Votes | % | ± | |
|---|---|---|---|---|---|
| Henley Residents Group | Stefan John Gawrysiak | 1747 | 48 | +19 | |
| Conservative | David Roger Nimmo Smith | 1362 | 37 | +4 | |
| Liberal Democrats | David John Thomas | 250 | 7 | +4 | |
| Labour | Jackie Walker | 166 | 5 | +1 | |
| Green | Elisabeth Marjorie Geake | 133 | 4 | +2 | |
| Turnout | 3658 | 29 | -11 | ||
| Henley Residents Group gain from Conservative | Swing | +7.5 | |||
Iffley Fields & St Mary's
| Party | Candidate | Votes | % | ± | |
|---|---|---|---|---|---|
| Labour | Helen Theresa Evans | 1,525 | 46.5 | +4.0 | |
| Green | Arthur David Williams | 1,326 | 40.5 | -5.2 | |
| Liberal Democrats | Andy McKay | 222 | 6.8 | +3.1 | |
| Conservative | Simon James Bazley | 181 | 5.5 | +0.0 | |
| Turnout | 3,254 | 48.0 | +16.2 | ||
| Labour gain from Green | Swing | +4.6 | |||
Isis
| Party | Candidate | Votes | % | ± | |
|---|---|---|---|---|---|
| Labour | Sobia Afridi | 1,559 | 55.3 | +3.2 | |
| Liberal Democrats | Nicholas John Harding | 501 | 17.8 | +10.7 | |
| Conservative | Alex Curtis | 409 | 14.5 | -2.4 | |
| Green | Doug Kohler | 336 | 11.9 | -11.4 | |
| Turnout | 2,805 | 40.7 | +12.7 | ||
| Labour hold | Swing | +3.2 | |||
Jericho & Osney
| Party | Candidate | Votes | % | ± | |
|---|---|---|---|---|---|
| Labour | Susanna Pressel | 1,667 | 58.6 | -1.3 | |
| Liberal Democrats | Jonathan David Adcock | 455 | 16.0 | +10.1 | |
| Green | Lois Knight Muddiman | 418 | 14.7 | -7.3 | |
| Conservative | Jason John Richard Fiddaman | 269 | 9.5 | -2.3 | |
| UKIP | David Hearn | 32 | 1.1 | ||
| Turnout | 2,841 | 40.5 | +13.3 | ||
| Labour hold | Swing | -1.3 | |||
Kennington & Radley
| Party | Candidate | Votes | % | ± | |
|---|---|---|---|---|---|
| Liberal Democrats | Bob Johnston | 1818 | 52 | +2 | |
| Conservative | Eric Batts | 1270 | 36 | +1 | |
| Labour Co-op | Martin Abraham Stott | 220 | 6 | -2 | |
| Green | Christopher Roy Henderson | 196 | 6 | -1 | |
| Turnout | 3504 | 34 | -5 | ||
| Liberal Democrats hold | Swing | +2 | |||
Kidlington South
| Party | Candidate | Votes | % | ± | |
|---|---|---|---|---|---|
| Conservative | Maurice Billington | 1672 | 57 | +9 | |
| Liberal Democrats | Samuel John Hubbard | 560 | 19 | +8 | |
| Labour | Cath Arakelian | 544 | 18 | +4 | |
| Green | Fiona Valerie Mawson | 182 | 6 | -3 | |
| Turnout | 2958 | 32 | +1 | ||
| Conservative hold | Swing | +9 | |||
Kingston & Cumnor
| Party | Candidate | Votes | % | ± | |
|---|---|---|---|---|---|
| Conservative | Anda Maruta Fitzgerald-O'Connor | 2064 | 57 | +12 | |
| Liberal Democrats | Jerry Avery | 864 | 24 | +15 | |
| Labour | Bella Bond | 397 | 11 | 0 | |
| Green | Gerard Matthew Cullum Lewis | 272 | 8 | +1 | |
| Turnout | 3597 | 33 | -6 | ||
| Conservative hold | Swing | +12 | |||
Kirtlington & Kidlington North
| Party | Candidate | Votes | % | ± | |
|---|---|---|---|---|---|
| Conservative | Carmen Griffiths | 1,817 | 48 | +14 | |
| Liberal Democrats | Dawn Susan Glatz | 1,440 | 38 | 18 | |
| Labour | Nick Walker | 410 | 11 | -8 | |
| Green | Ian Michael Middleton | 152 | 4 | -3 | |
| Turnout | 3,819 | 45 | +6 | ||
| Conservative hold | Swing | +14 | |||
Leys
| Party | Candidate | Votes | % | ± | |
|---|---|---|---|---|---|
| Labour | Deborah McIlveen | 1,227 | 71.8 | -8.7 | |
| Conservative | Linkson Andrae Sherman Jack | 275 | 16.1 | +8.6 | |
| Liberal Democrats | Rosemary Anne Beatrice Morlin | 98 | 5.7 | +2.3 | |
| Green | Elizabeth Ellen McHale | 95 | 5.6 | -1.8 | |
| Turnout | 1,695 | 19.9 | +1.9 | ||
| Labour hold | Swing | -8.7 | |||
Marston & Northway
| Party | Candidate | Votes | % | ± | |
|---|---|---|---|---|---|
| Labour | Mark Robert Lygo | 1,374 | 48.1 | +2.7 | |
| Conservative | Mark Bhagwandin | 695 | 24.3 | +11.3 | |
| Liberal Democrats | Maria Bourbon | 473 | 16.6 | +11.6 | |
| Green | Alistair David Pryce Morris | 293 | 10.3 | +1.1 | |
| Turnout | 2,835 | 38.5 | +10.9 | ||
| Labour hold | Swing | +2.7 | |||
North Hinksey
| Party | Candidate | Votes | % | ± | |
|---|---|---|---|---|---|
| Liberal Democrats | Judy Roberts | 1767 | 52.8 | +7.8 | |
| Conservative | Dina Black | 1058 | 31.6 | +4.6 | |
| Labour | Richard George Llewellyn Kendall | 321 | 9.6 | +1.6 | |
| Green | Anne-Marie Heslop | 198 | 5.9 | -0.1 | |
| Turnout | 3344 | 44.3 | +2.3 | ||
| Liberal Democrats hold | Swing | +7.8 | |||
Otmoor
| Party | Candidate | Votes | % | ± | |
|---|---|---|---|---|---|
| Conservative | Dan Sames | 1693 | 61.1 | +20.1 | |
| Labour | Michael Nixon | 473 | 17.1 | +3.1 | |
| Liberal Democrats | Liz Barker | 369 | 13.3 | 0.3 | |
| Green | Roger David Nixon | 235 | 8.5 | 0.5 | |
| Turnout | 2770 | 37.0 | +14.0 | ||
| Conservative hold | Swing | +20.1 | |||
Ploughley
| Party | Candidate | Votes | % | ± | |
|---|---|---|---|---|---|
| Conservative | Ian Corkin | 1395 | 50.5 | -0.5 | |
| Independent | Catherine Ann Fulljames | 637 | 23.1 | - | |
| Labour | Steven John Uttley | 245 | 8.9 | -0.1 | |
| Liberal Democrats | Dillie Keane | 228 | 8.3 | +2.3 | |
| Green | Jenny Tamblyn | 135 | 4.9 | -4.1 | |
| UKIP | Dickie Bird | 122 | 4.4 | -20.6 | |
| Turnout | 2762 | 42 | +11 | ||
| Conservative hold | Swing | -0.5 | |||
Rose Hill and Littlemore
| Party | Candidate | Votes | % | ± | |
|---|---|---|---|---|---|
| Labour | Gill Sanders | 1,410 | 59.9 | -2.9 | |
| Conservative | Daniel Stafford | 462 | 19.6 | +3.2 | |
| Liberal Democrats | David William Bowkett | 259 | 11.0 | +6.5 | |
| Green | Abdul Hakeem Rafiq | 196 | 8.3 | -6.9 | |
| Turnout | 2,327 | 30.1 | +8.5 | ||
| Labour hold | Swing | -2.9 | |||
Shrivenham
| Party | Candidate | Votes | % | ± | |
|---|---|---|---|---|---|
| Conservative | Yvonne Jean Constance | 1874 | 64.6 | +12.6 | |
| Labour Co-op | Sarah Caroline Church | 441 | 15.2 | +7.2 | |
| Liberal Democrats | Andrew Crawford | 390 | 13.4 | -3.6 | |
| Green | Joanna Louise Shipley | 196 | 6.8 | +1.8 | |
| Turnout | 2901 | 37.8 | -0.2 | ||
| Conservative hold | Swing | +12.6 | |||
Sonning Common
| Party | Candidate | Votes | % | ± | |
|---|---|---|---|---|---|
| Conservative | David Christopher Bartholomew | 1930 | 70.6 | +12.6 | |
| Liberal Democrats | Lucio Fumi | 442 | 16.2 | - | |
| Labour Co-op | Veronica Treacher | 363 | 13.3 | -1.7 | |
| Turnout | 2735 | 35.5 | -1.5 | ||
| Conservative hold | Swing | +12.6 | |||
St Clement's and Cowley Marsh
| Party | Candidate | Votes | % | ± | |
|---|---|---|---|---|---|
| Labour | Jamila Begum Azad | 1,170 | 50.1 | +9.6 | |
| Green | Nuala Ann Young | 726 | 31.1 | -8.0 | |
| Liberal Democrats | Graham Roderick Jones | 247 | 10.6 | +1.8 | |
| Conservative | Timothy Douglas Patmore | 177 | 7.6 | +1.9 | |
| Turnout | 2,320 | 37.9 | +13.1 | ||
| Labour hold | Swing | +9.6 | |||
St Margaret's
| Party | Candidate | Votes | % | ± | |
|---|---|---|---|---|---|
| Liberal Democrats | John Orrell Howson | 1,460 | 41.2 | +11.8 | |
| Labour | James Fry | 1,355 | 38.3 | +11.3 | |
| Conservative | Penelope Anne Lenon | 541 | 15.3 | -2.5 | |
| Green | Al Wilson | 176 | 5.0 | -15.6 | |
| Turnout | 3,532 | 49.8 | +14.5 | ||
| Liberal Democrats hold | Swing | +11.8 | |||
Sutton Courtenay & Marcham
| Party | Candidate | Votes | % | ± | |
|---|---|---|---|---|---|
| Liberal Democrats | Richard John Webber | 1,345 | 45 | +13 | |
| Conservative | Stuart Philip Davenport | 1,311 | 43.8 | +12.8 | |
| Labour | Coral Ann Avril Plumb | 239 | 8 | -2 | |
| Green | Craig Simmons | 96 | 3.2 | -0.8 | |
| Turnout | 2,991 | 38.4 | +7.4 | ||
| Liberal Democrats hold | Swing | +13 | |||
Thame & Chinnor
| Party | Candidate | Votes | % | ± | |
|---|---|---|---|---|---|
| Conservative | Nick Carter | 2,959 | 27.2 | +6.7 | |
| Conservative | Jeannette Ann Matelot Green | 2,781 | 25.6 | +6.7 | |
| Liberal Democrats | Kate Michelle Gregory | 1,609 | 14.8 | +5.1 | |
| Liberal Democrats | Gaby Oatway | 1,461 | 13.4 | +5.1 | |
| Labour | David Matthew Bailey | 750 | 6.9 | +6.3 | |
| Labour | Simon Stone | 597 | 5.5 | +6.3 | |
| Green | Louisa Mary Wilkinson | 391 | 3.6 | +4.9 | |
| Green | Ali Gordon-Creed | 328 | 3 | +4.9 | |
| Turnout | 10,876 | 26% | |||
| Conservative hold | Swing | +6.7 | |||
| Conservative hold | Swing | +6.7 | |||
University Parks
| Party | Candidate | Votes | % | ± | |
|---|---|---|---|---|---|
| Labour | Emma Christina Turnbull | 691 | 41.8 | +14.5 | |
| Liberal Democrats | Lucinda Greta Olivia Chamberlain | 400 | 24.2 | +16.7 | |
| Green | Benjamin Raphael Carter | 352 | 21.3 | -21.2 | |
| Conservative | Gary William Dixon | 199 | 12.0 | -7.0 | |
| Turnout | 1,642 | 32.7 | +16.5 | ||
| Labour gain from Green | Swing | +17.9 | |||
Wallingford
| Party | Candidate | Votes | % | ± | |
|---|---|---|---|---|---|
| Independent | Lynda Susan Atkins | 1,143 | 39.4 | -4.6 | |
| Conservative | Leo Docherty | 699 | 24.1 | +7.1 | |
| Liberal Democrats | David Rouane | 379 | 13.1 | +10.1 | |
| Labour | George William Kneeshaw | 363 | 12.5 | +2.5 | |
| Green | Sue Ap-Roberts | 318 | 11 | +5 | |
| Turnout | 2,902 | 36.9 | -1.1 | ||
| Independent hold | Swing | -4.6 | |||
Wheatley
| Party | Candidate | Votes | % | ± | |
|---|---|---|---|---|---|
| Liberal Democrats | Kirsten Renee Johnson | 1,372 | 45.2 | +5.2 | |
| Conservative | John Patrick Walsh | 1,304 | 42.9 | +15.9 | |
| Labour | John Gerard Mercer | 361 | 11.9 | +2.9 | |
| Turnout | 3,037 | 41.4 | +11.4 | ||
| Liberal Democrats hold | Swing | +5.2 | |||
Witney North & East
| Party | Candidate | Votes | % | ± | |
|---|---|---|---|---|---|
| Conservative | Suzanne Elizabeth Bartington | 1,756 | 53 | +14 | |
| Labour | Trevor Ian License | 854 | 25.8 | -0.2 | |
| Liberal Democrats | Gillian Elizabeth Workman | 451 | 13.6 | +8.6 | |
| Green | Stuart Sutherland MacDonald | 254 | 7.7 | -5.3 | |
| Turnout | 3,315 | 36.4 | +12.4 | ||
| Conservative hold | Swing | +14 | |||
Witney South & Central
| Party | Candidate | Votes | % | ± | |
|---|---|---|---|---|---|
| Labour Co-op | Laura Margaret Price | 1,361 | 45.6 | +14.6 | |
| Conservative | Alan Keith Beames | 1,235 | 41.4 | +12.4 | |
| Liberal Democrats | Jake Ryan Acock | 257 | 8.6 | +4.6 | |
| Green | Andy King | 133 | 4.5 | -0.5 | |
| Turnout | 2,986 | 35.4 | +13.4 | ||
| Labour Co-op hold | Swing | +14.6 | |||
Witney West & Bampton
| Party | Candidate | Votes | % | ± | |
|---|---|---|---|---|---|
| Conservative | Ted Fenton | 1,820 | 62.7 | +13.7 | |
| Liberal Democrats | Christopher John Blount | 517 | 17.8 | +12.8 | |
| Labour | Calvert Charles Stuart McGibbon | 390 | 13.4 | -0.6 | |
| Green | Alma Ann Tumilowicz | 174 | 6 | -1 | |
| Turnout | 2,901 | 34.9 | +9.9 | ||
| Conservative hold | Swing | +13.7 | |||
Wolvercote and Summertown
| Party | Candidate | Votes | % | ± | |
|---|---|---|---|---|---|
| Liberal Democrats | Christopher Paul Buckley | 1909 | 53.2 | +3.3 | |
| Conservative | Kenneth Gerald Bickers | 804 | 22.4 | +1.8 | |
| Labour | Lucas Bertholdi-Sadd | 550 | 15.3 | +2.5 | |
| Green | Sarah Janet Edwards | 323 | 9.0 | -6.9 | |
| Turnout | 3,586 | 47.8 | +12.6 | ||
| Liberal Democrats hold | Swing | +3.3 | |||
Woodstock
| Party | Candidate | Votes | % | ± | |
|---|---|---|---|---|---|
| Conservative | Ian Donald Hudspeth | 1,694 | 48 | +7 | |
| Liberal Democrats | Julian Craig Cooper | 1,348 | 38 | +14 | |
| Labour | Dave Baldwin | 324 | 9 | -1 | |
| Green | David James Chanter | 182 | 5 | -3 | |
| Turnout | 3,548 | 44 | +14 | ||
| Conservative hold | Swing | +7 | |||
Wroxton and Hook Norton
| Party | Candidate | Votes | % | ± | |
|---|---|---|---|---|---|
| Conservative | George Anthony Reynolds | 2,477 | 65 | +10 | |
| Labour | Anne Felicia Cullen | 569 | 15 | 0 | |
| Liberal Democrats | Julian Greenwood | 500 | 13 | +7 | |
| Green | Shaun Edward Greenslade-Hibbert | 249 | 7 | 0 | |
| Turnout | 3,795 | 37 | +1 | ||
| Conservative hold | Swing | +10 | |||
References
- "Upcoming elections & referendums". Electoral Commission. Retrieved 15 September 2016.
- "Election 2017 live results". Oxfordshire County Council. Archived from the original on 3 May 2013. Retrieved 6 May 2017.
- "Election results for Abingdon East". OCC Elections 2017 - Thursday, 4 May 2017. Oxfordshire County Council. Retrieved 5 May 2017.
- "Election results for Abingdon North". OCC Elections 2017 - Thursday, 4 May 2017. Oxfordshire County Council. Retrieved 5 May 2017.
- "Election results for Abingdon South". OCC Elections 2017 - Thursday, 4 May 2017. Oxfordshire County Council. Retrieved 5 May 2017.
- "Election results for Banbury Calthorpe". OCC Elections 2017 - Thursday, 4 May 2017. Oxfordshire County Council. Retrieved 5 May 2017.
- "Election results for Banbury Grimsbury & Castle". OCC Elections 2017 - Thursday, 4 May 2017. Oxfordshire County Council. Retrieved 5 May 2017.
- "Election results for Banbury Hardwick". OCC Elections 2017 - Thursday, 4 May 2017. Oxfordshire County Council. Retrieved 5 May 2017.
- "Election results for Banbury Ruscote". OCC Elections 2017 - Thursday, 4 May 2017. Oxfordshire County Council. Retrieved 5 May 2017.
- "Election results for Barton, Sandhills & Risinghurst". OCC Elections 2017 - Thursday, 4 May 2017. Oxfordshire County Council. Retrieved 5 May 2017.
- "Election results for Benson & Cholsey". OCC Elections 2017 - Thursday, 4 May 2017. Oxfordshire County Council. Retrieved 5 May 2017.
- "Election results for Berinsfield & Garsington". OCC Elections 2017 - Thursday, 4 May 2017. Oxfordshire County Council. Retrieved 5 May 2017.
- "Election results for Bicester North". OCC Elections 2017 - Thursday, 4 May 2017. Oxfordshire County Council. Retrieved 5 May 2017.
- "Election results for Bicester Town". OCC Elections 2017 - Thursday, 4 May 2017. Oxfordshire County Council. Retrieved 5 May 2017.
- "Election results for Bicester West". OCC Elections 2017 - Thursday, 4 May 2017. Oxfordshire County Council. Retrieved 5 May 2017.
- "Election results for Bloxham & Easington". OCC Elections 2017 - Thursday, 4 May 2017. Oxfordshire County Council. Retrieved 5 May 2017.
- "Election results for Burford & Carterton North". OCC Elections 2017 - Thursday, 4 May 2017. Oxfordshire County Council. Retrieved 5 May 2017.
- "Election results for Carterton South & West". OCC Elections 2017 - Thursday, 4 May 2017. Oxfordshire County Council. Retrieved 5 May 2017.
- "Election results for Chalgrove & Watlington". OCC Elections 2017 - Thursday, 4 May 2017. Oxfordshire County Council. Retrieved 5 May 2017.
- "Election results for Charlbury & Wychwood". OCC Elections 2017 - Thursday, 4 May 2017. Oxfordshire County Council. Retrieved 5 May 2017.
- "Election results for Chipping Norton". OCC Elections 2017 - Thursday, 4 May 2017. Oxfordshire County Council. Retrieved 5 May 2017.
- "Election results for Churchill & Lye Valley". OCC Elections 2017 - Thursday, 4 May 2017. Oxfordshire County Council. Retrieved 5 May 2017.
- "Election results for Cowley". OCC Elections 2017 - Thursday, 4 May 2017. Oxfordshire County Council. Retrieved 5 May 2017.
- "Election results for Deddington". OCC Elections 2017 - Thursday, 4 May 2017. Oxfordshire County Council. Retrieved 5 May 2017.
- "Election results for Didcot East & Hagbourne". OCC Elections 2017 - Thursday, 4 May 2017. Oxfordshire County Council. Retrieved 5 May 2017.
- "Election results for Didcot Ladygrove". OCC Elections 2017 - Thursday, 4 May 2017. Oxfordshire County Council. Retrieved 5 May 2017.
- "Election results for Didcot West". OCC Elections 2017 - Thursday, 4 May 2017. Oxfordshire County Council. Retrieved 5 May 2017.
- "Election results for Eynsham". OCC Elections 2017 - Thursday, 4 May 2017. Oxfordshire County Council. Retrieved 5 May 2017.
- "Election results for Faringdon". OCC Elections 2017 - Thursday, 4 May 2017. Oxfordshire County Council. Retrieved 5 May 2017.
- "Election results for Goring". OCC Elections 2017 - Thursday, 4 May 2017. Oxfordshire County Council. Retrieved 5 May 2017.
- "Election results for Grove & Wantage". OCC Elections 2017 - Thursday, 4 May 2017. Oxfordshire County Council. Retrieved 5 May 2017.
- "Election results for Hanborough & Minster Lovell". OCC Elections 2017 - Thursday, 4 May 2017. Oxfordshire County Council. Retrieved 5 May 2017.
- "Election results for Headington & Quarry". OCC Elections 2017 - Thursday, 4 May 2017. Oxfordshire County Council. Retrieved 5 May 2017.
- "Election results for Hendreds & Harwell". OCC Elections 2017 - Thursday, 4 May 2017. Oxfordshire County Council. Retrieved 5 May 2017.
- "Election results for Henley-on-Thames". OCC Elections 2017 - Thursday, 4 May 2017. Oxfordshire County Council. Retrieved 5 May 2017.
- "Election results for Iffley Fields & St Mary's". OCC Elections 2017 - Thursday, 4 May 2017. Oxfordshire County Council. Retrieved 5 May 2017.
- "Election results for Isis". OCC Elections 2017 - Thursday, 4 May 2017. Oxfordshire County Council. Retrieved 5 May 2017.
- "Election results for Jericho & Osney". OCC Elections 2017 - Thursday, 4 May 2017. Oxfordshire County Council. Retrieved 5 May 2017.
- "Election results for Kennington & Radley". OCC Elections 2017 - Thursday, 4 May 2017. Oxfordshire County Council. Retrieved 5 May 2017.
- "Election results for Kidlington South". OCC Elections 2017 - Thursday, 4 May 2017. Oxfordshire County Council. Retrieved 5 May 2017.
- "Election results for Kingston & Cumnor". OCC Elections 2017 - Thursday, 4 May 2017. Oxfordshire County Council. Retrieved 5 May 2017.
- "Election results for Kirtlington & Kidlington North". OCC Elections 2017 - Thursday, 4 May 2017. Oxfordshire County Council. Retrieved 9 May 2017.
- "Election results for Leys". OCC Elections 2017 - Thursday, 4 May 2017. Oxfordshire County Council. Retrieved 5 May 2017.
- "Election results for Marston & Northway". OCC Elections 2017 - Thursday, 4 May 2017. Oxfordshire County Council. Retrieved 5 May 2017.
- "Election results for North Hinksey". OCC Elections 2017 - Thursday, 4 May 2017. Oxfordshire County Council. Retrieved 5 May 2017.
- "Election results for Otmoor". OCC Elections 2017 - Thursday, 4 May 2017. Oxfordshire County Council. Retrieved 5 May 2017.
- "Election results for Ploughley". OCC Elections 2017 - Thursday, 4 May 2017. Oxfordshire County Council. Retrieved 5 May 2017.
- "Election results for Rose Hill & Littlemore". OCC Elections 2017 - Thursday, 4 May 2017. Oxfordshire County Council. Retrieved 5 May 2017.
- "Election results for Shrivenham". OCC Elections 2017 - Thursday, 4 May 2017. Oxfordshire County Council. Retrieved 5 May 2017.
- "Election results for Sonning Common". OCC Elections 2017 - Thursday, 4 May 2017. Oxfordshire County Council. Retrieved 5 May 2017.
- "Election results for St Clement's & Cowley Marsh". OCC Elections 2017 - Thursday, 4 May 2017. Oxfordshire County Council. Retrieved 5 May 2017.
- "Election results for St Margaret's". OCC Elections 2017 - Thursday, 4 May 2017. Oxfordshire County Council. Retrieved 5 May 2017.
- "Election results for Sutton Courtenay & Marcham". OCC Elections 2017 - Thursday, 4 May 2017. Oxfordshire County Council. Retrieved 5 May 2017.
- "Election results for Thame & Chinnor". OCC Elections 2017 - Thursday, 4 May 2017. Oxfordshire County Council. Retrieved 5 May 2017.
- "Election results for University Parks". OCC Elections 2017 - Thursday, 4 May 2017. Oxfordshire County Council. Retrieved 5 May 2017.
- "Election results for Wallingford". OCC Elections 2017 - Thursday, 4 May 2017. Oxfordshire County Council. Retrieved 5 May 2017.
- "Election results for Wheatley". OCC Elections 2017 - Thursday, 4 May 2017. Oxfordshire County Council. Retrieved 5 May 2017.
- "Election results for Witney North & East". OCC Elections 2017 - Thursday, 4 May 2017. Oxfordshire County Council. Retrieved 5 May 2017.
- "Election results for Witney South & Central". OCC Elections 2017 - Thursday, 4 May 2017. Oxfordshire County Council. Retrieved 5 May 2017.
- "Election results for Witney West & Bampton". OCC Elections 2017 - Thursday, 4 May 2017. Oxfordshire County Council. Retrieved 5 May 2017.
- "Election results for Wolvercote & Summertown". OCC Elections 2017 - Thursday, 4 May 2017. Oxfordshire County Council. Retrieved 5 May 2017.
- "Election results for Woodstock". OCC Elections 2017 - Thursday, 4 May 2017. Oxfordshire County Council. Retrieved 5 May 2017.
- "Election results for Wroxton and Hook Norton". OCC Elections 2017 - Thursday, 4 May 2017. Oxfordshire County Council. Retrieved 5 May 2017.
This article is issued from Wikipedia. The text is licensed under Creative Commons - Attribution - Sharealike. Additional terms may apply for the media files.