2017 Kent County Council election
The 2017 Kent County Council election was held on 4 May 2017 as part of the 2017 local elections in the United Kingdom.[1] All 81 councillors were elected, from 72 electoral divisions, each of which returned either one or two county councillors by first-past-the-post voting for a four-year term of office.
| |||||||||||||||||||||||||||||||||||||||||||||
All 81 seats to Kent County Council 41 seats needed for a majority | |||||||||||||||||||||||||||||||||||||||||||||
|---|---|---|---|---|---|---|---|---|---|---|---|---|---|---|---|---|---|---|---|---|---|---|---|---|---|---|---|---|---|---|---|---|---|---|---|---|---|---|---|---|---|---|---|---|---|
| |||||||||||||||||||||||||||||||||||||||||||||
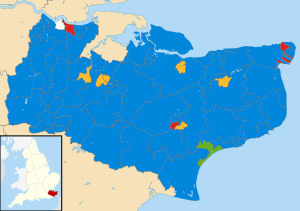 Map showing the results of the 2017 Kent County Council elections. | |||||||||||||||||||||||||||||||||||||||||||||
| |||||||||||||||||||||||||||||||||||||||||||||
Ward boundary changes took effect at this election, after a review of the county by the Local Government Boundary Commission for England.[2][3]
Kent saw a large turnover of councillors. Of the 81 councillors elected in 2017, 39 had not served in the previous council.
The Conservative Party retained control.
UKIP, previously the second largest party on the council lost all of their seats.
Liberal Democrats regained status as the second largest party, which they had been 2009-2013. A notable triumph for Liberal Democrats was Antony Hook winning the Faversham division, which had been considered a "safe" Conservative seat. Antony Hook's campaign increased the Liberal Democrat vote share from 4% in 2013 to a winning 43%. Faversham also saw the largest turnout of any seat.
Labour lost seats, including those of their Leader Roger Truelove and previous leaders Gordon Cowan and Dr. Mike Eddy. Labour vote share also fell but they retained status as 3rd party.
Results
| Party | Seats | Gains | Losses | Net gain/loss | Seats % | Votes % | Votes | +/− | |
|---|---|---|---|---|---|---|---|---|---|
| Conservative | 67 | 24 | 1 | +23 | 82.71 | 50 | |||
| Liberal Democrats | 7 | 1 | 1 | 0 | 8.64 | 14 | |||
| Labour | 5 | 0 | 8 | -8 | 6.17 | 19 | |||
| Green | 1 | 0 | 0 | 0 | 1.23 | 5 | |||
| Swanscombe and Greenhithe Residents Association | 1 | 0 | 0 | 0 | 1.23 | <1 | - | ||
| UKIP | 0 | 0 | 17 | -17 | 0 | 10 | |||
Results by district
Swale
There are five single-member constituencies and one multi-member constituency within the District of Swale, which elect a total of seven councillors to Kent County Council. The electoral map of Swale was redrawn as a result of boundary changes which saw the old Swale Central multi-member ward split to create Sittingbourne North and Sittingbourne South, both single member divisions. Sheerness and Sheppey Divisions were merged to create the new Multi-member Sheppey Division. Swale District includes the Division of Faversham which saw Liberal Democrat Antony Hook winning the Faversham division, which had been considered a "safe" Conservative seat. Antony Hook's campaign increased the Liberal Democrat vote share from 4% in 2013 to a winning 43%. Faversham also saw the largest turnout of any seat. Boundary changes meant that Below are the results:[4]
| Party | Candidate | Votes | % | ± | |
|---|---|---|---|---|---|
| Liberal Democrats | Antony Hook | 2,714 | 43% | ||
| Conservative | David Henry Simmons | 2218 | 35% | ||
| Labour | Trevor Raymond Payne | 863 | 14% | ||
| Green | Peter Hutchinson | 261 | 4% | ||
| UKIP | Christine Margaret Palmer | 243 | 4% | ||
| Majority | 496 | 8% | — | ||
| Turnout | 6299 | 43% | |||
| Liberal Democrats gain from Conservative | Swing | 24.5% | |||
| Party | Candidate | Votes | % | ± | |
|---|---|---|---|---|---|
| Conservative | Andy Booth | 3,093 | 23% | ||
| Conservative | Ken Pugh | 3,009 | 22% | ||
| Labour | Angela Harrison | 1,774 | 13% | ||
| UKIP | Richard William Darby | 1,485 | 11% | ||
| Labour | Gill Smith | 1,291 | 10% | ||
| UKIP | Mini Nissanga | 998 | 7% | ||
| Independent | Elliott Jayes | 593 | 4% | ||
| Monster Raving Loony | Mad Mike Young | 339 | 3% | ||
| Green | Richard John Bishop | 337 | 3% | ||
| Green | Dru Hopkins | 201 | 1% | ||
| Liberal Democrats | David John Spurling | 175 | 1% | ||
| Independent | Mike Walters | 144 | 1% | ||
| Majority | |||||
| Turnout | 13,439 | 24% | |||
| Conservative gain from UKIP | Swing | % | |||
| Conservative gain from Labour | Swing | % | |||
| Party | Candidate | Votes | % | ± | |
|---|---|---|---|---|---|
| Conservative | Sue Gent | 1,526 | 41% | - | |
| Labour | Ghlin Whelan | 1,195 | 32% | - | |
| UKIP | Jim Hall | 639 | 17% | - | |
| Liberal Democrats | Tony Clark | 330 | 9% | - | |
| Green | Huw Jones | 72 | 2% | - | |
| Majority | 331 | 9% | — | ||
| Turnout | 3762 | 24% | |||
| Conservative gain from Labour | Swing | 10% | |||
| Party | Candidate | Votes | % | ± | |
|---|---|---|---|---|---|
| Conservative | John Wright | 1,972 | 42% | ||
| Labour | Roger Truelove | 1,955 | 41% | - | |
| UKIP | Lee Burgess | 527 | 11% | - | |
| Liberal Democrats | Gareth Dominic Edmund Arnold | 188 | 4% | - | |
| Green | Jonathan Grace | 76 | 2% | - | |
| Majority | 17 | 0.4% | — | ||
| Turnout | 4718 | 33% | - | ||
| Conservative gain from UKIP | Swing | ||||
| Party | Candidate | Votes | % | ± | |
|---|---|---|---|---|---|
| Conservative | Andrew Bowles | 2,597 | 54% | ||
| UKIP | Richard Frank Palmer | 717 | 15% | ||
| Labour | Frances Rehal | 624 | 13% | ||
| Liberal Democrats | Eddie Thomas | 500 | 10% | ||
| Green | Alistair Gould | 367 | 8% | ||
| Majority | 1,880 | 39% | — | ||
| Turnout | 4,805 | 37% | |||
| Conservative hold | Swing | 10% | |||
| Party | Candidate | Votes | % | ± | |
|---|---|---|---|---|---|
| Conservative | Mike Whiting | 2,159 | 43% | ||
| UKIP | Mike Baldock | 2040 | 40% | ||
| Labour | Tony Winkless | 495 | 10% | ||
| Liberal Democrats | Marc Wilson | 228 | 5% | ||
| Green | Tim Valentine | 120 | 2% | ||
| Majority | 119 | 3% | — | ||
| Turnout | 5042 | 32% | |||
| Conservative gain from UKIP | Swing | 10% | |||
Tonbridge and Malling
There are five single-member constituencies and one multi-member constituency within the District of Tonbridge and Malling, which elect a total of seven councillors to Kent County Council. Below are the results:[5]
| Party | Candidate | Votes | % | ± | |
|---|---|---|---|---|---|
| Conservative | Harry Rayner | 3,208 | 69% | ||
| Liberal Democrats | Nicholas George Stapleton | 460 | 10% | ||
| Labour | Kathleen Maria Garlick | 336 | 7% | ||
| Green | Richard Paul Mountford | 312 | 7% | ||
| UKIP | Mike Jerrom | 311 | 7% | ||
| Majority | 2,748 | 59% | — | ||
| Turnout | 4,627 | 36% | |||
| Conservative hold | Swing | ||||
References
- "Upcoming elections & referendums". Electoral Commission. Retrieved 16 September 2016.
- "The Kent (Electoral Changes) Order 2016". legislation.gov.uk. Retrieved 16 September 2016.
- "Kent County Council". Local Government Boundary Commission for England. Retrieved 16 September 2016.
- https://www.kent.gov.uk/about-the-council/how-the-council-works/kent-county-council-elections/find-election-information-for-your-area/elections-notices-for-swale-2017#tab-4
- https://shareweb.kent.gov.uk/Documents/council-and-democracy/elections/persons%20nominated/nominations-ton-mallling.pdf%5B%5D
| Kent County Council | |
|---|---|
| Ashford Borough Council | |
| Canterbury City Council | |
| Dartford Borough Council | |
| Dover District Council | |
| Folkestone & Hythe District Council | |
| Gravesham Borough Council | |
| Maidstone Borough Council | |
| Medway Council | |
| Sevenoaks District Council |
|
| Swale Borough Council | |
| Thanet District Council | |
| Tonbridge & Malling Borough Council | |
| Tunbridge Wells Borough Council | |
| Rochester-upon-Medway City Council |
|
| Gillingham Borough Council |
|
| |