2017 Nottinghamshire County Council election
The 2017 Nottinghamshire County Council election took place on 4 May 2017 as part of the 2017 local elections in the United Kingdom.[1] The whole council of 66 councillors was elected for a four-year term spanning 56 electoral divisions, a minority of which return two councillors. The voting system used is first-past-the-post.
| |||||||||||||||||||||||||||||||||||||
All 66 seats to Nottinghamshire County Council 34 seats needed for a majority | |||||||||||||||||||||||||||||||||||||
|---|---|---|---|---|---|---|---|---|---|---|---|---|---|---|---|---|---|---|---|---|---|---|---|---|---|---|---|---|---|---|---|---|---|---|---|---|---|
| |||||||||||||||||||||||||||||||||||||
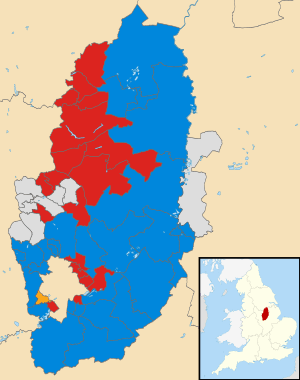 Map showing the results of the 2017 Nottinghamshire County Council elections. | |||||||||||||||||||||||||||||||||||||
| |||||||||||||||||||||||||||||||||||||
The result was no overall party group of candidates formed a majority. Before the election the council, had a one-councillor Labour Party majority — after the election the Labour Party formed the second-largest party group, behind Conservative councillors who will require the support of three other councillors during the administration to pass major changes.
A review by the Local Government Boundary Commission for England led to altered boundaries for this election.[2][3]
Overall election results
| Within Nottinghamshire County 2017 | |||||||||||||||
|---|---|---|---|---|---|---|---|---|---|---|---|---|---|---|---|
| Party | Candidates | Votes | |||||||||||||
| Stood | Elected | Gained | Unseated | Net | % of total | % | No. | Net % | |||||||
| Conservative | 57 | 31 | 10 | 38.1% | 105,636 | ||||||||||
| Labour | 64 | 23 | 11 | 34.5% | 95,737 | ||||||||||
| Ashfield Independents | 5 | 5 | 5 | 3.8% | 10,554 | ||||||||||
| Mansfield Independent | 4 | 4 | 2 | 3.9% | 10,759 | ||||||||||
| Liberal Democrats | 52 | 1 | 4 | 7.8% | 21,659 | ||||||||||
| Selston Parish Independents | 1 | 1 | 1.1% | 2,908 | |||||||||||
| UKIP | 42 | 0 | 5.2% | 14,314 | |||||||||||
| Green | 21 | 0 | 2.1% | 5,848 | |||||||||||
| Independent | 11 | 1 | |||||||||||||
| Hucknall First Community Forum | 3 | 0 | |||||||||||||
| TUSC | 3 | 0 | |||||||||||||
Results by electoral division
Ashfield District
(10 seats, 10 electoral divisions)[4]
| Ashfield District | |||||||||||||||
|---|---|---|---|---|---|---|---|---|---|---|---|---|---|---|---|
| Party | Candidates | Votes | |||||||||||||
| Stood | Elected | Gained | Unseated | Net | % of total | % | No. | Net % | |||||||
| Ashfield Independents | 5 | 5 | 5 | 31.5 | 10,554 | ||||||||||
| Conservative | 7 | 3 | 3 | 18.5 | 6,221 | ||||||||||
| Labour | 10 | 1 | 5 | 28.5 | 9,562 | ||||||||||
| Selston Parish Independents | 1 | 1 | 5.5 | 1,848 | |||||||||||
| UKIP | 10 | 0 | 7.5 | 2,514 | |||||||||||
| Independent | 2 | 0 | 5.5 | 1,833 | |||||||||||
| Hucknall First Community Forum | 3 | 0 | 1.9 | 638 | |||||||||||
| Liberal Democrats | 5 | 0 | 3 | 1.1 | 383 | ||||||||||
Ashfields
| Party | Candidate | Votes | % | |
|---|---|---|---|---|
| Ashfield Independents | Jason Zadrozny | 1,524 | 50.1 | |
| Labour | Linford Martyn Gibbons | 800 | 26.3 | |
| Conservative | Jade Melissa Ancliff | 505 | 16.6 | |
| UKIP | Ian William Wright | 211 | 6.9 | |
| Turnout | 3,040 | 35.8 | ||
Hucknall North
| Party | Candidate | Votes | % | |
|---|---|---|---|---|
| Conservative | Ben Bradley | 1,539 | 47.9 | |
| Labour | Alice Elisabeth Grice | 1,141 | 35.5 | |
| Hucknall First Community Forum | John Morton Anthony Wilmott | 282 | 8.8 | |
| UKIP | Ray Young | 161 | 5.0 | |
| Liberal Democrats | James Alan Harvey | 89 | 2.8 | |
| Turnout | 3,212 | 39.1 | ||
Hucknall South
| Party | Candidate | Votes | % | |
|---|---|---|---|---|
| Conservative | Phil Rostance | 1,136 | 40.5 | |
| Labour | John Hartley Wilkinson | 1,062 | 37.9 | |
| UKIP | Jack Holland | 313 | 11.2 | |
| Hucknall First Community Forum | Trevor Charles Locke | 196 | 7.0 | |
| Liberal Democrats | Alex Sjoberg-Weekes | 97 | 3.5 | |
| Turnout | 2,804 | 30.8 | ||
Hucknall West
| Party | Candidate | Votes | % | |
|---|---|---|---|---|
| Conservative | Kevin Thomas Rostance | 1,535 | 51.6 | |
| Labour | Joe Wakinson | 988 | 33.2 | |
| UKIP | Stuart James Bestwick | 239 | 8.0 | |
| Hucknall First Community Forum | Geoff Ware | 160 | 5.4 | |
| Liberal Democrats | Robert Andrew Charlesworth | 54 | 1.8 | |
| Turnout | 2,976 | 35.5 | ||
Kirkby North
| Party | Candidate | Votes | % | |
|---|---|---|---|---|
| Labour | John Knight | 1,211 | 45.3 | |
| Conservative | Sam Ancliff | 951 | 35.6 | |
| UKIP | Janet Jeanes | 400 | 15.0 | |
| Liberal Democrats | John Timothy Ingram | 111 | 4.2 | |
| Turnout | 2,673 | 29.0 | ||
Kirkby South
| Party | Candidate | Votes | % | |
|---|---|---|---|---|
| Ashfield Independents | Rachel Elisabeth Madden | 2,364 | 61.8 | |
| Labour | Donna Samantha Jane Gilbert | 981 | 25.7 | |
| UKIP | Gabriella Wright | 365 | 9.5 | |
| Independent | Mark John Harrison | 114 | 3.0 | |
| Turnout | 3,824 | 39.7 | ||
Selston
| Party | Candidate | Votes | % | |
|---|---|---|---|---|
| Selston Parish Independents | David Bernard Matin | 1,848 | 40.8 | |
| Independent | Sam Wilson | 1,719 | 38.0 | |
| Labour | Ruth Stevens | 567 | 12.5 | |
| Conservative | Shanade Nikita Bradley | 260 | 5.7 | |
| UKIP | Carole Irene Terzza | 100 | 2.2 | |
| Liberal Democrats | Josie Marsters | 32 | 0.7 | |
| Turnout | 4,526 | 44.2 | ||
Sutton Central & East
| Party | Candidate | Votes | % | |
|---|---|---|---|---|
| Ashfield Independents | Samantha Kay Deakin | 1,758 | 60.1 | |
| Labour | Steve Carroll | 925 | 31.6 | |
| UKIP | Sally Cook | 241 | 8.2 | |
| Turnout | 2,924 | 31.0 | ||
Sutton North
| Party | Candidate | Votes | % | |
|---|---|---|---|---|
| Ashfield Independents | Helen-Ann Smith | 2,370 | 65.2 | |
| Labour | Helen Joy Hollis | 951 | 26.1 | |
| UKIP | Geoff Thorpe | 316 | 8.7 | |
| Turnout | 3,637 | 35.9 | ||
Sutton West
| Party | Candidate | Votes | % | |
|---|---|---|---|---|
| Ashfield Independents | Tom Hollis | 2,538 | 64.5 | |
| Labour | Glenys Christina Maxwell | 936 | 23.8 | |
| Conservative | John Matson Baker | 295 | 7.5 | |
| UKIP | Moira Jean Sansom | 168 | 4.3 | |
| Turnout | 3,937 | 39.2 | ||
Bassetlaw District
(9 seats, 9 electoral divisions)
| Bassetlaw District | |||||||||||||||
|---|---|---|---|---|---|---|---|---|---|---|---|---|---|---|---|
| Party | Candidates | Votes | |||||||||||||
| Stood | Elected | Gained | Unseated | Net | % of total | % | No. | Net % | |||||||
| Labour | 8 | 5 | 2 | 44.4 | 12,077 | ||||||||||
| Conservative | 8 | 4 | 2 | 36.1 | 9,827 | ||||||||||
| UKIP | 8 | 0 | 9.0 | 2,436 | |||||||||||
| Liberal Democrats | 9 | 0 | 6.5 | 1,758 | |||||||||||
| Independent | 1 | 0 | 4.1 | 1,125 | |||||||||||
Blyth & Harworth
| Party | Candidate | Votes | % | |
|---|---|---|---|---|
| Labour | Sheila Janice Place | 1,529 | 61.5 | |
| Conservative | Adam Michael Gray | 444 | 17.9 | |
| UKIP | John Andrew Hudson | 289 | 11.6 | |
| Liberal Democrats | Alex Jordan Cowan | 224 | 9.0 | |
| Turnout | 2,486 | 26.6 | ||
Misterton
| Party | Candidate | Votes | % | |
|---|---|---|---|---|
| Conservative | Tracey Lee Taylor | 1,994 | 54.4 | |
| Independent | Hazel Brand | 1,125 | 30.7 | |
| Liberal Democrats | Mark Peter Hunter | 293 | 8.0 | |
| UKIP | Dave Taylor | 251 | 6.9 | |
| Turnout | 3,663 | 35.3 | ||
Retford East
| Party | Candidate | Votes | % | |
|---|---|---|---|---|
| Conservative | Steve Vickers | 1,328 | 44.8 | |
| Labour | Pam Skelding | 1,291 | 43.6 | |
| UKIP | Jon Wade | 190 | 6.4 | |
| Liberal Democrats | Stephen John Ware | 152 | 5.1 | |
| Turnout | 2,961 | 33.0 | ||
Retford West
| Party | Candidate | Votes | % | |
|---|---|---|---|---|
| Conservative | Mike Quigley | 1,411 | 46.4 | |
| Labour | Darrell Eduard Pulk | 1,357 | 44.6 | |
| Liberal Democrats | Jennifer Anne Coggles | 272 | 8.9 | |
| Turnout | 3,040 | 32.3 | ||
Tuxford
| Party | Candidate | Votes | % | |
|---|---|---|---|---|
| Conservative | John Ogle | 2,245 | 71.9 | |
| Labour | Frederick Gallucci | 544 | 17.4 | |
| UKIP | Tony Clayton | 176 | 5.6 | |
| Liberal Democrats | Mat Duveen | 159 | 5.1 | |
| Turnout | 3,124 | 35.3 | ||
Worksop East
| Party | Candidate | Votes | % | |
|---|---|---|---|---|
| Labour | Glynn Gilfoyle | 1,855 | 71.1 | |
| Conservative | Michael Tom Gray | 372 | 14.3 | |
| UKIP | Andrew Airey | 277 | 10.6 | |
| Liberal Democrats | Connor Lewis Savage | 105 | 4.0 | |
| Turnout | 2,609 | 26.4 | ||
Worksop North
| Party | Candidate | Votes | % | |
|---|---|---|---|---|
| Labour | Alan Rhodes | 2,000 | 60.5 | |
| Conservative | Richard Barnes | 933 | 28.2 | |
| UKIP | Roger Martin Vernon | 263 | 8.0 | |
| Liberal Democrats | Adam Davies | 110 | 3.3 | |
| Turnout | 3,306 | 33.3 | ||
Worksop South
| Party | Candidate | Votes | % | |
|---|---|---|---|---|
| Labour | Kevin Maurizio Greaves | 1,801 | 54.7 | |
| Conservative | Emma Jane Auckland | 1,100 | 33.4 | |
| UKIP | Christopher Paul Barker | 242 | 7.4 | |
| Liberal Democrats | Leon Maurice Duveen | 147 | 4.5 | |
| Turnout | 3,290 | 33.8 | ||
Worksop West
| Party | Candidate | Votes | % | |
|---|---|---|---|---|
| Labour | Sybil Jacqueline Fielding | 1,700 | 62.0 | |
| UKIP | Rachel Elizabeth Briggs | 748 | 27.3 | |
| Liberal Democrats | Simon Andrew Russell | 296 | 10.8 | |
| Turnout | 2,744 | 28.0 | ||
Broxtowe Borough
(9 seats, 7 electoral divisions)
| Broxtowe Borough | |||||||||||||||
|---|---|---|---|---|---|---|---|---|---|---|---|---|---|---|---|
| Party | Candidates | Votes | |||||||||||||
| Stood | Elected | Gained | Unseated | Net | % of total | % | No. | Net % | |||||||
| Conservative | 9 | 7 | 3 | 43.2 | 20,594 | ||||||||||
| Labour | 9 | 1 | 29.8 | 14,213 | |||||||||||
| Liberal Democrats | 7 | 1 | 4 | 14.9 | 7,096 | ||||||||||
| UKIP | 8 | 0 | 4.5 | 2,135 | |||||||||||
| Green | 6 | 0 | 4.1 | 1,966 | |||||||||||
| Independent | 2 | 0 | 3.5 | 1,680 | |||||||||||
Beeston Central & Rylands
| Party | Candidate | Votes | % | |
|---|---|---|---|---|
| Labour | Kate Foale | 2,051 | 52.3 | |
| Conservative | Trish Roberts-Thomson | 1,269 | 32.3 | |
| Liberal Democrats | Gav Slater | 387 | 9.9 | |
| Green | Sylvia Anne Rule | 217 | 5.5 | |
| Turnout | 3,924 | 41.8 | ||
Bramcote & Beeston North
| Party | Candidate | Votes | % | |
|---|---|---|---|---|
| Liberal Democrats | Steve Carr | 1,966 | 41.2 | |
| Conservative | Tony Smith | 1,355 | 28.4 | |
| Labour | Ellie Winfield | 1,178 | 24.7 | |
| Independent | Paul Constantine Nathanail | 150 | 3.1 | |
| UKIP | Chris Cobb | 119 | 2.5 | |
| Turnout | 4,768 | 48.2 | ||
Eastwood
| Party | Candidate | Votes | % | |
|---|---|---|---|---|
| Conservative | Tony Harper | 1,180 | 38.5 | |
| Liberal Democrats | Keith Longdon | 861 | 28.1 | |
| Labour | David Jonathan Griffiths | 721 | 23.5 | |
| UKIP | Paul Bryan Tordoff | 219 | 7.1 | |
| Green | Pat Morton | 84 | 2.7 | |
| Turnout | 3,065 | 32.8 | ||
Greasley & Brinsley
| Party | Candidate | Votes | % | |
|---|---|---|---|---|
| Conservative | John William Handley | 2,159 | 61.0 | |
| Labour | David Thomas Patrick | 774 | 21.9 | |
| UKIP | Tracey Ann Cahill | 358 | 10.1 | |
| Green | Bethan Hewis | 248 | 7.0 | |
| Turnout | 3,539 | 37.5 | ||
Nuthall & Kimberley
| Party | Candidate | Votes | % | |
|---|---|---|---|---|
| Conservative | Philip John Owen | 2,132 | 56.0 | |
| Labour | Teresa Ann Cullen | 1,011 | 26.5 | |
| Green | Kat Boettge | 397 | 10.4 | |
| UKIP | Graham Andrew Jones | 268 | 7.0 | |
| Turnout | 3,808 | 37.4 | ||
Stapleford & Broxtowe Central
| Party | Candidate | Votes | % | |
|---|---|---|---|---|
| Conservative | John Anthony Doddy | 2,692 | 20.6 | |
| Conservative | William John Longdon | 2,179 | 16.6 | |
| Labour | John Liam Sean McGrath | 2,034 | 15.5 | |
| Labour | Lisa Marie Clarke | 1,903 | 14.5 | |
| Independent | Richard Danny MacRae | 1,530 | 11.7 | |
| Liberal Democrats | Jacky Williams | 1,147 | 8.8 | |
| Liberal Democrats | Tim Hallam | 1,101 | 8.4 | |
| UKIP | Nina Peterson-Tait | 286 | 2.2 | |
| UKIP | Daniel Roy Stowell | 216 | 1.7 | |
| Turnout | 13,088 | 39.8 | ||
Toton, Chilwell & Attenborough
| Party | Candidate | Votes | % | |
|---|---|---|---|---|
| Conservative | Eric Kerry | 3,817 | 24.6 | |
| Conservative | Richard Ian Jackson | 3,811 | 24.6 | |
| Labour | Dawn Angela Elliott | 2,387 | 15.4 | |
| Labour | Tom Roberts | 2,154 | 13.9 | |
| Liberal Democrats | Graham Heal | 925 | 6.0 | |
| Liberal Democrats | Si Frost | 709 | 4.6 | |
| Green | Richard David Eddleston | 560 | 3.6 | |
| Green | Mary Evelyn Venning | 460 | 3.0 | |
| UKIP | Mick Ashton | 367 | 2.4 | |
| UKIP | Tony Hall | 302 | 1.9 | |
| Turnout | 14,862 | 41.1 | ||
Gedling Borough
(9 seats, 6 electoral divisions)
| Gedling Borough | |||||||||||||||
|---|---|---|---|---|---|---|---|---|---|---|---|---|---|---|---|
| Party | Candidates | Votes | |||||||||||||
| Stood | Elected | Gained | Unseated | Net | % of total | % | No. | Net % | |||||||
| Labour | 9 | 7 | 43.9 | 24,021 | |||||||||||
| Conservative | 9 | 2 | 42.4 | 23,184 | |||||||||||
| Liberal Democrats | 9 | 0 | 6.1 | 3,339 | |||||||||||
| UKIP | 9 | 0 | 5.2 | 2,859 | |||||||||||
| Green | 6 | 0 | 2.3 | 1,239 | |||||||||||
| Independent | 1 | 0 | 0.2 | 82 | |||||||||||
Arnold North
| Party | Candidate | Votes | % | |
|---|---|---|---|---|
| Labour | Pauline Annette Allan | 3,377 | 23.1 | |
| Labour | Michael Richard Payne | 3,309 | 22.7 | |
| Conservative | James Anthony Patrick Faulconbridge | 3,171 | 21.7 | |
| Conservative | Carol Pepper | 3,157 | 21.6 | |
| UKIP | George Eric Rose | 426 | 2.9 | |
| UKIP | David William Voce | 400 | 2.7 | |
| Liberal Democrats | Tad Jones | 229 | 1.6 | |
| Liberal Democrats | Andrew Julian Swift | 226 | 1.5 | |
| Green | Jeannie Thompson | 169 | 1.2 | |
| Green | Jim Norris | 143 | 1.0 | |
| Turnout | 14,607 | 37.2 | ||
Arnold South
| Party | Candidate | Votes | % | |
|---|---|---|---|---|
| Labour | William John Clarke | 3,842 | 24.1 | |
| Labour | Muriel Weisz | 3,787 | 23.8 | |
| Conservative | Michael James Adams | 3,184 | 20.0 | |
| Conservative | Jane Maria Walker | 2,804 | 17.6 | |
| Liberal Democrats | Robert Andrew Swift | 544 | 3.4 | |
| Liberal Democrats | Jason Martin Stansfield | 499 | 3.1 | |
| UKIP | John Colin Hart | 443 | 2.8 | |
| UKIP | Jean Olive Truman | 334 | 2.1 | |
| Green | Margret Susan Barbara Vince | 255 | 1.6 | |
| Green | Jim Stuart | 225 | 1.4 | |
| Turnout | 15,917 | 39.8 | ||
Calverton
| Party | Candidate | Votes | % | |
|---|---|---|---|---|
| Conservative | Boyd Bryan Elliott | 2,492 | 61.3 | |
| Labour | Mike Hope | 1,104 | 27.2 | |
| Liberal Democrats | Anne Marguerite Wright | 285 | 7.0 | |
| UKIP | Lee Waters | 183 | 4.5 | |
| Turnout | 4,064 | 40.6 | ||
Carlton East
| Party | Candidate | Votes | % | |
|---|---|---|---|---|
| Labour | Nicki Brooks | 1,576 | 44.1 | |
| Conservative | Kevin Backhouse Doyle | 1,547 | 43.3 | |
| Liberal Democrats | John Edward Flynn | 229 | 6.4 | |
| UKIP | Graham Kenneth Roebuck | 140 | 3.9 | |
| Independent | Ray Ellis | 82 | 2.3 | |
| Turnout | 3,574 | 37.4 | ||
Carlton West
| Party | Candidate | Votes | % | |
|---|---|---|---|---|
| Labour | Jim Creamer | 3,213 | 24.4 | |
| Labour | Errol George Henry | 3,165 | 24.0 | |
| Conservative | Robert James Dawson | 2,260 | 17.2 | |
| Conservative | Ged Clarke | 2,243 | 17.0 | |
| Liberal Democrats | Andrew Mark Ellwood | 653 | 5.0 | |
| Liberal Democrats | Paul Anthony Hughes | 551 | 4.2 | |
| UKIP | Piero Loi | 387 | 2.9 | |
| UKIP | Philip Anthony Pritchard | 367 | 2.8 | |
| Green | Laurence James Baldwin | 332 | 2.5 | |
| Turnout | 13,171 | 33.8 | ||
Newstead
| Party | Candidate | Votes | % | |
|---|---|---|---|---|
| Conservative | Christopher Paul Barnfather | 2,326 | 68.6 | |
| Labour | Michael John Smith | 648 | 19.1 | |
| UKIP | Rhea Waters | 179 | 5.3 | |
| Liberal Democrats | David Kenneth Watts | 123 | 3.6 | |
| Green | Rebecca Connick | 115 | 3.4 | |
| Turnout | 3,391 | 42.0 | ||
Mansfield District
(9 seats, 5 electoral divisions)
| Mansfield District | |||||||||||||||
|---|---|---|---|---|---|---|---|---|---|---|---|---|---|---|---|
| Party | Candidates | Votes | |||||||||||||
| Stood | Elected | Gained | Unseated | Net | % of total | % | No. | Net % | |||||||
| Labour | 9 | 5 | 2 | 42.6 | 16,645 | ||||||||||
| Mansfield Independent | 4 | 4 | 2 | 27.6 | 10,759 | ||||||||||
| Conservative | 4 | 0 | 13.1 | 5,107 | |||||||||||
| Liberal Democrats | 6 | 0 | 4.2 | 1,629 | |||||||||||
| UKIP | 5 | 0 | 10.3 | 4,010 | |||||||||||
| TUSC | 3 | 0 | 1.1 | 422 | |||||||||||
| Independent | 1 | 0 | 1.2 | 461 | |||||||||||
East Mansfield
| Party | Candidate | Votes | % | |
|---|---|---|---|---|
| Mansfield Independent | Martin Wright | 2,695 | 29.6 | |
| Mansfield Independent | Vaughan Adrian Hopewell | 2,450 | 26.9 | |
| Labour | Alan Bell | 1,799 | 19.7 | |
| Labour | Colleen Harwood | 1,699 | 18.6 | |
| Liberal Democrats | Christopher Andrew Morris | 357 | 3.9 | |
| TUSC | Tom Hunt | 112 | 1.2 | |
| Turnout | 9,112 | 27.3 | ||
North Mansfield
| Party | Candidate | Votes | % | |
|---|---|---|---|---|
| Labour | Joyce Bosnjak | 2,557 | 28.3 | |
| Labour | Parry Tsimbiridis | 2,143 | 23.7 | |
| Conservative | Daniel Redfern | 1,924 | 21.3 | |
| UKIP | Raymond William Foster | 1,019 | 11.3 | |
| UKIP | David Hamilton | 848 | 9.4 | |
| Liberal Democrats | Clive Arthur Trussel | 386 | 4.3 | |
| TUSC | Karen Rachel Mary Seymour | 154 | 1.7 | |
| Turnout | 9,031 | 28.6 | ||
South Mansfield
| Party | Candidate | Votes | % | |
|---|---|---|---|---|
| Mansfield Independent | Steve Garner | 3,075 | 30.2 | |
| Mansfield Independent | Andy Sissons | 2,539 | 25.0 | |
| Labour | Charles Ian Hammersley | 1,280 | 12.6 | |
| Labour | Darren Hunt | 1,268 | 12.5 | |
| Conservative | Paul James Saxelby | 1,143 | 11.2 | |
| Independent | Philip Shields | 461 | 4.5 | |
| Liberal Democrats | Dean Malpass | 235 | 2.3 | |
| Liberal Democrats | Anita Prabhakar | 166 | 1.6 | |
| Turnout | 10,167 | 30.3 | ||
West Mansfield
| Party | Candidate | Votes | % | |
|---|---|---|---|---|
| Labour | Paul Nigel Henshaw | 2,124 | 26.1 | |
| Labour | Diana Mary Meale | 2,110 | 25.9 | |
| Conservative | Steph Stewardson | 1,474 | 18.1 | |
| UKIP | Stephen John Crosby | 1,116 | 13.7 | |
| UKIP | Fran Loi | 745 | 9.2 | |
| Liberal Democrats | Rebecca Suzanne Buck | 416 | 5.1 | |
| TUSC | Paul Tooley-Okonkwo | 156 | 1.9 | |
| Turnout | 8,141 | 27.1 | ||
Warsop
| Party | Candidate | Votes | % | |
|---|---|---|---|---|
| Labour | Andy Wetton | 1,665 | 64.5 | |
| Conservative | Don Brown | 566 | 21.9 | |
| UKIP | Allan Dallman | 282 | 10.9 | |
| Liberal Democrats | Janette Smith | 69 | 2.7 | |
| Turnout | 2,582 | 27.1 | ||
Newark & Sherwood District
(10 seats, 10 electoral divisions)
| Newark & Sherwood District | |||||||||||||||
|---|---|---|---|---|---|---|---|---|---|---|---|---|---|---|---|
| Party | Candidates | Votes | |||||||||||||
| Stood | Elected | Gained | Unseated | Net | % of total | % | No. | Net % | |||||||
| Conservative | 10 | 6 | 55.3 | 17,918 | |||||||||||
| Labour | 9 | 3 | 25.9 | 8,390 | |||||||||||
| Independent | 3 | 1 | 9.4 | 3,047 | |||||||||||
| Liberal Democrats | 8 | 0 | 8.7 | 2,826 | |||||||||||
| Green | 1 | 0 | 0.8 | 250 | |||||||||||
Balderton
| Party | Candidate | Votes | % | |
|---|---|---|---|---|
| Conservative | Keith Walker | 1,467 | 70.2 | |
| Labour | Vivienne Leach | 445 | 21.3 | |
| Liberal Democrats | Marylyn Rayner | 178 | 8.5 | |
| Turnout | 2,090 | 28.4 | ||
Blidworth
| Party | Candidate | Votes | % | |
|---|---|---|---|---|
| Labour | Yvonne Woodhead | 1,006 | 41.9 | |
| Conservative | Bill Turnbull | 909 | 37.8 | |
| Independent | Chris Wharton | 416 | 17.3 | |
| Liberal Democrats | Philip Ashley Smith | 71 | 3.0 | |
| Turnout | 2,402 | 28.9 | ||
Collingham
| Party | Candidate | Votes | % | |
|---|---|---|---|---|
| Independent | Maureen Dobson | 2,191 | 62.1 | |
| Conservative | Johno Lee | 1,339 | 37.9 | |
| Turnout | 3,530 | 36.8 | ||
Farndon & Trent
| Party | Candidate | Votes | % | |
|---|---|---|---|---|
| Conservative | Sue Saddington | 2,008 | 64.3 | |
| Independent | Declan Patrick Logue | 440 | 14.1 | |
| Labour | Mary Obodo | 372 | 11.9 | |
| Liberal Democrats | Chris Adams | 303 | 9.7 | |
| Turnout | 3,123 | 42.5 | ||
Muskham & Farnsfield
| Party | Candidate | Votes | % | |
|---|---|---|---|---|
| Conservative | Bruce Laughton | 3,108 | 69.0 | |
| Labour | Jeremy Paul Spry | 770 | 17.1 | |
| Liberal Democrats | Peter Harris | 377 | 8.4 | |
| Green | Richard Pain | 250 | 5.5 | |
| Turnout | 4,505 | 43.4 | ||
Newark East
| Party | Candidate | Votes | % | |
|---|---|---|---|---|
| Conservative | Stuart Robert Wallace | 1,586 | 64.0 | |
| Labour | Paul Stephen Peacock | 671 | 27.1 | |
| Liberal Democrats | Vivien Helen Scorer | 222 | 9.0 | |
| Turnout | 2,479 | 31.9 | ||
Newark West
| Party | Candidate | Votes | % | |
|---|---|---|---|---|
| Conservative | Keith Frank Girling | 1,412 | 60.2 | |
| Labour | Zena Sanigar | 933 | 39.8 | |
| Turnout | 2,345 | 27.0 | ||
Ollerton
| Party | Candidate | Votes | % | |
|---|---|---|---|---|
| Labour | Mike Pringle | 1,940 | 54.6 | |
| Conservative | Glenn John Alexander Bardill | 1,484 | 41.8 | |
| Liberal Democrats | Christopher Cooke | 126 | 3.5 | |
| Turnout | 3,550 | 37.1 | ||
Sherwood Forest
| Party | Candidate | Votes | % | |
|---|---|---|---|---|
| Labour | John Malcolm Peck | 1,738 | 53.5 | |
| Conservative | Michael Andrew Brown | 1,397 | 43.0 | |
| Liberal Democrats | Peter James Scorer | 112 | 3.4 | |
| Turnout | 3,247 | 36.3 | ||
Southwell
| Party | Candidate | Votes | % | |
|---|---|---|---|---|
| Conservative | Roger James Jackson | 3,208 | 62.2 | |
| Liberal Democrats | Stuart Ross Thompstone | 1,437 | 27.8 | |
| Labour | Ed Lyons | 515 | 10.0 | |
| Turnout | 5,160 | 48.9 | ||
Rushcliffe Borough
(10 seats, 9 electoral divisions)
| Rushcliffe Borough | |||||||||||||||
|---|---|---|---|---|---|---|---|---|---|---|---|---|---|---|---|
| Party | Candidates | Votes | |||||||||||||
| Stood | Elected | Gained | Unseated | Net | % of total | % | No. | Net % | |||||||
| Conservative | 10 | 9 | 2 | 53.6 | 22,785 | ||||||||||
| Labour | 10 | 1 | 1 | 25.5 | 10,829 | ||||||||||
| Liberal Democrats | 8 | 0 | 10.9 | 4,628 | |||||||||||
| Green | 8 | 0 | 5.6 | 2,393 | |||||||||||
| Independent | 2 | 0 | 3.6 | 1,539 | |||||||||||
| UKIP | 2 | 0 | 0.9 | 360 | |||||||||||
Bingham East
| Party | Candidate | Votes | % | |
|---|---|---|---|---|
| Conservative | Francis Anthoney Purdue-Horan | 2,294 | 54.9 | |
| Independent | Tracey Lindsay Kerry | 922 | 22.1 | |
| Labour | Chris Grocock | 595 | 14.3 | |
| Green | Ian Richard Mumford | 190 | 4.6 | |
| UKIP | Brian Ralph Edward Weaver | 174 | 4.2 | |
| Turnout | 4,175 | 45.2 | ||
Bingham West
| Party | Candidate | Votes | % | |
|---|---|---|---|---|
| Conservative | Jonathan Neil Clarke | 1,390 | 55.3 | |
| Independent | Alan Robert Harvey | 617 | 24.6 | |
| Labour | Tony Wallace | 506 | 20.1 | |
| Turnout | 2,513 | 37.2 | ||
Cotgrave
| Party | Candidate | Votes | % | |
|---|---|---|---|---|
| Conservative | Richard Langton Butler | 1,961 | 61.9 | |
| Labour | Keri Tricia Howe | 892 | 28.2 | |
| Liberal Democrats | David John Allen | 313 | 9.9 | |
| Turnout | 3,166 | 38.0 | ||
Keyworth
| Party | Candidate | Votes | % | |
|---|---|---|---|---|
| Conservative | John Elliott Cottee | 2,520 | 62.0 | |
| Liberal Democrats | Linda Jane Abbey | 760 | 18.7 | |
| Labour | Kevin James Fitzgerald | 473 | 11.6 | |
| UKIP | David Alan King | 186 | 4.6 | |
| Green | David Anthony Nicholson-Cole | 125 | 3.1 | |
| Turnout | 4,064 | 46.7 | ||
Leake & Ruddington
| Party | Candidate | Votes | % | |
|---|---|---|---|---|
| Conservative | Andy Brown | 3,433 | 28.9 | |
| Conservative | Reg Adair | 3,349 | 28.2 | |
| Labour | Jill Maureen Reedman | 1,206 | 10.1 | |
| Labour | Yvonne Barbara Lishman | 1,202 | 10.1 | |
| Liberal Democrats | Jason Richard Billin | 1,030 | 8.7 | |
| Liberal Democrats | Debbie Boote | 676 | 5.7 | |
| Green | Stephen Richard Perriman | 544 | 4.6 | |
| Green | Ian Paul Wilson | 447 | 3.8 | |
| Turnout | 10,857 | 39.3 | ||
Radcliffe On Trent
| Party | Candidate | Votes | % | |
|---|---|---|---|---|
| Conservative | Kay Cutts | 2,220 | 57.8 | |
| Labour | Stuart James Brady | 1,151 | 30.0 | |
| Liberal Democrats | Juliette Khan | 262 | 6.8 | |
| Green | Darren James Wells | 205 | 5.3 | |
| Turnout | 3,838 | 45.0 | ||
West Bridgford North
| Party | Candidate | Votes | % | |
|---|---|---|---|---|
| Labour | Liz Plant | 2,368 | 50.5 | |
| Conservative | Mike Watkinson | 1,474 | 31.5 | |
| Green | Timothy Andrew Baker | 441 | 9.4 | |
| Liberal Democrats | Vicky Price | 402 | 8.6 | |
| Turnout | 4,685 | 47.2 | ||
West Bridgford South
| Party | Candidate | Votes | % | |
|---|---|---|---|---|
| Conservative | Jonathan Gordon Alexander Wheeler | 1,893 | 50.3 | |
| Labour | Lizzie Edgerton | 1,043 | 27.7 | |
| Liberal Democrats | David Charles Turner | 592 | 15.7 | |
| Green | Ian James Whitehead | 239 | 6.3 | |
| Turnout | 3,767 | 43.3 | ||
West Bridgford West
| Party | Candidate | Votes | % | |
|---|---|---|---|---|
| Conservative | Douglas Wheeler | 2,251 | 50.7 | |
| Labour | Nadia Whittome | 1,393 | 31.4 | |
| Liberal Democrats | Ian Munro | 593 | 13.4 | |
| Green | Will Richardson | 202 | 4.6 | |
| Turnout | 4,439 | 45.9 | ||
References
- "Upcoming elections & referendums". Electoral Commission. Retrieved 15 September 2016.
- "The Nottinghamshire (Electoral Changes) Order 2016". legislation.gov.uk. Retrieved 15 September 2016.
- "Nottinghamshire County Council". Local Government Boundary Commission for England. Archived from the original on 19 October 2016. Retrieved 15 September 2016.
- "Councillors Details". Retrieved 2017-02-18.