2017 Suffolk County Council election
The 2017 Suffolk County Council election took place on 4 May 2017 as part of the 2017 local elections in the United Kingdom.[1] All 75 councillors were elected from 63 electoral divisions, which returned either one or two county councillors each, by first-past-the-post voting, for a four-year term of office.
| |||||||||||||||||||||||||||||||||||||||||||||||||||||||||||||||||||||
All 75 seats to Suffolk County Council 38 seats needed for a majority | |||||||||||||||||||||||||||||||||||||||||||||||||||||||||||||||||||||
|---|---|---|---|---|---|---|---|---|---|---|---|---|---|---|---|---|---|---|---|---|---|---|---|---|---|---|---|---|---|---|---|---|---|---|---|---|---|---|---|---|---|---|---|---|---|---|---|---|---|---|---|---|---|---|---|---|---|---|---|---|---|---|---|---|---|---|---|---|---|
| |||||||||||||||||||||||||||||||||||||||||||||||||||||||||||||||||||||
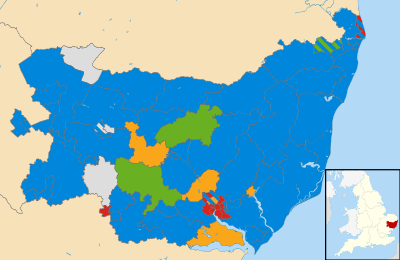 Map of the results of the 2017 Suffolk council election. Conservatives in blue, Liberal Democrats in yellow, Labour in red, Greens in green and independents in grey. | |||||||||||||||||||||||||||||||||||||||||||||||||||||||||||||||||||||
| |||||||||||||||||||||||||||||||||||||||||||||||||||||||||||||||||||||
Voters who live in divisions which elected two councillors (12 divisions) were entitled to cast a maximum of two votes, while those living in divisions only electing one councillor (51 divisions) were only entitled to cast one vote.
Labour and the Conservatives were the only parties fielding candidates in all 63 electoral divisions. The Liberal Democrats had candidates standing in 58 divisions, while the Green Party stood candidates in 46 divisions and UKIP stood candidates in 43 divisions.
Overall Result

| Party | Seats | Gains | Losses | Net gain/loss | Seats % | Votes % | Votes | +/− | |
|---|---|---|---|---|---|---|---|---|---|
| Conservative | 52 | 18 | 3 | 69.3 | 45.6 | 112,828 | +9.5 | ||
| Labour | 11 | 1 | 5 | 14.7 | 22.8 | 56,137 | -1.8 | ||
| Liberal Democrats | 5 | 0 | 3 | 6.7 | 13.0 | 32,237 | +2.9 | ||
| Green | 3 | 2 | 1 | 4.0 | 7.9 | 19,510 | -0.1 | ||
| Independent | 3 | 0 | 0 | 5.3 | 4.4 | 10,977 | +1.8 | ||
| West Suffolk Independents | 1 | 1 | 0 | 0.0 | 0.7 | 1,771 | N/A | ||
| UKIP | 0 | 0 | 10 | 0.0 | 5.7 | 13,997 | -12.7 | ||
Results summaries by district
Babergh
Babergh District Summary
| Party | Seats | +/- | Votes | % | +/- | |
|---|---|---|---|---|---|---|
| Conservative | 6 | 10,463 | 39.5 | +3.7 | ||
| Liberal Democrat | 1 | 5,880 | 22.2 | +4.3 | ||
| Labour | 1 | 3,439 | 13.0 | -1.6 | ||
| Independent | 1 | 3,007 | 11.3 | +5.2 | ||
| Green | 1 | 2,424 | 9.1 | -2.0 | ||
| UKIP | 0 | 1,293 | 4.9 | -9.6 | ||
Forest Heath
District Summary
| Party | Seats | +/- | Votes | % | +/- | |
|---|---|---|---|---|---|---|
| Conservative | 4 | 5,441 | 47.0 | +11.0 | ||
| West Suffolk Independents | 1 | 1,771 | 15.3 | N/A | ||
| Labour | 0 | 1,830 | 15.8 | +1.3 | ||
| Independent | 0 | 1,185 | 10.2 | +3.9 | ||
| UKIP | 0 | 830 | 7.2 | -28.4 | ||
| Liberal Democrat | 0 | 513 | 4.4 | -3.1 | ||
Ipswich
District Summary
| Party | Seats | +/- | Votes | % | +/- | |
|---|---|---|---|---|---|---|
| Labour | 9 | 19,130 | 40.9 | -1.5 | ||
| Conservative | 2 | 17,187 | 36.8 | +9.6 | ||
| Liberal Democrat | 1 | 6,123 | 13.1 | +2.8 | ||
| UKIP | 0 | 2,160 | 4.6 | -9.7 | ||
| Green | 0 | 1,863 | 4.0 | -1.8 | ||
| Independent | 0 | 259 | 0.6 | N/A | ||
Mid Suffolk
District Summary
| Party | Seats | +/- | Votes | % | +/- | |
|---|---|---|---|---|---|---|
| Conservative | 7 | 13,918 | 49.3 | +14.3 | ||
| Liberal Democrat | 2 | 5,750 | 20.4 | +6.6 | ||
| Green | 1 | 4,171 | 14.8 | -0.8 | ||
| Labour | 0 | 3,179 | 11.3 | -0.6 | ||
| UKIP | 0 | 1,191 | 4.2 | -19.4 | ||
Suffolk Coastal
District Summary
| Party | Seats | +/- | Votes | % | +/- | |
|---|---|---|---|---|---|---|
| Conservative | 10 | 25,773 | 53.3 | +3.4 | ||
| Liberal Democrat | 1 | 7,338 | 15.2 | -2.2 | ||
| Green | 0 | 3,265 | 6.7 | +4.1 | ||
| Labour | 0 | 8,072 | 16.7 | -3.4 | ||
| UKIP | 0 | 2,550 | 5.3 | -3.1 | ||
St. Edmundsbury
District Summary
| Party | Seats | +/- | Votes | % | +/- | |
|---|---|---|---|---|---|---|
| Conservative | 7 | 17,205 | 49.0 | +11.6 | ||
| Independent | 2 | 4,084 | 11.6 | +0.6 | ||
| Labour | 0 | 6,890 | 19.6 | +1.7 | ||
| Liberal Democrat | 0 | 3,691 | 10.5 | +6.4 | ||
| Green | 0 | 1,630 | 4.6 | -1.5 | ||
| UKIP | 0 | 1,599 | 4.6 | -18.8 | ||
Waveney
District Summary
| Party | Seats | +/- | Votes | % | +/- | |
|---|---|---|---|---|---|---|
| Conservative | 11 | 22,315 | 44.5 | +12.3 | ||
| Labour | 1 | 13,585 | 27.1 | -4.2 | ||
| Green | 1 | 6,048 | 12.0 | +0.6 | ||
| UKIP | 0 | 4,945 | 9.9 | -12.1 | ||
| Liberal Democrat | 0 | 2,469 | 4.9 | +1.7 | ||
| Independent | 0 | 837 | 1.7 | N/A | ||
Results by division
Aldeburgh and Leiston
| Party | Candidate | Votes | % | ± | |
|---|---|---|---|---|---|
| Conservative | Russ Rainger | 1,288 | 49.4 | +9.8 | |
| Labour | Freda Casagrande | 607 | 23.3 | -3.7 | |
| UKIP | Roger Ball | 291 | 11.2 | N/A | |
| Liberal Democrats | Julia McLean | 270 | 10.3 | +3.1 | |
| Green | Peter Ward | 153 | 5.9 | -3.7 | |
| Majority | 681 | 26.1 | |||
| Turnout | 2,609 | 35.0 | |||
| Conservative hold | Swing | ||||
Beccles
| Party | Candidate | Votes | % | ± | |
|---|---|---|---|---|---|
| Conservative | Mark Bee | 2,241 | 23.7 | +2.1 | |
| Green | Elfrede Brambley-Crawshaw | 2,189 | 23.2 | +7.6 | |
| Conservative | Graham Catchpole | 2,031 | 21.5 | +4.4 | |
| Green | Josi Horne | 1,446 | 15.3 | +4.4 | |
| Labour | Tarik Lahin | 541 | 5.7 | -5.8 | |
| Labour | Nasima Begum | 388 | 4.1 | -6.2 | |
| UKIP | Pat Hawes | 224 | 2.4 | -7.7 | |
| UKIP | Mike Shaw | 194 | 2.1 | N/A | |
| Liberal Democrats | Caroline Way | 105 | 1.1 | -0.5 | |
| Liberal Democrats | Simon Macdowall | 96 | 1.0 | N/A | |
| Majority | |||||
| Turnout | 4,843 | 41.3 | |||
| Conservative hold | Swing | ||||
| Green gain from Conservative | Swing | ||||
Belstead Brook
| Party | Candidate | Votes | % | ± | |
|---|---|---|---|---|---|
| Conservative | Christopher Hudson | 867 | 40.9 | +7.4 | |
| Liberal Democrats | David Busby | 792 | 37.4 | -0.1 | |
| Labour Co-op | David Plowman | 270 | 12.7 | -5.3 | |
| UKIP | Stuart Armstrong | 119 | 5.6 | N/A | |
| Green | Richard Hardacre | 72 | 3.4 | -7.6 | |
| Majority | 75 | 3.5 | |||
| Turnout | 2,120 | 31.5 | +3.8 | ||
| Conservative gain from Liberal Democrats | Swing | ||||
Bixley
| Party | Candidate | Votes | % | ± | |
|---|---|---|---|---|---|
| Conservative | Paul West | 1,310 | 55.7 | -2.7 | |
| Labour | Paul Anderson | 557 | 23.7 | -1.0 | |
| Liberal Democrats | Timothy Lockington | 198 | 8.4 | +2.8 | |
| UKIP | Dave Ranson | 166 | 7.1 | N/A | |
| Independent | Linda Sharp | 120 | 5.1 | N/A | |
| Majority | 753 | 32.0 | |||
| Turnout | 2,351 | 41.4 | |||
| Conservative hold | Swing | ||||
Blackbourn
| Party | Candidate | Votes | % | |
|---|---|---|---|---|
| Conservative | Joanna Spicer | 2,532 | 81.7 | |
| Labour | Cyrille Bouché | 568 | 18.3 | |
| Majority | 1,964 | 63.4 | ||
| Turnout | 3,100 | 38.5 | ||
| Conservative hold | ||||
Blything
| Party | Candidate | Votes | % | |
|---|---|---|---|---|
| Conservative | Richard Smith | 1,602 | 52.9 | |
| Liberal Democrats | James Sandbach | 586 | 19.3 | |
| Labour | Mark Turner | 540 | 17.8 | |
| Green | Nigel Hiley | 302 | 10.0 | |
| Majority | 1,016 | 33.5 | ||
| Turnout | 3,030 | 40.9 | ||
| Conservative hold | ||||
Bosmere
| Party | Candidate | Votes | % | |
|---|---|---|---|---|
| Conservative | Anne Whybrow | 1,169 | 46.0 | |
| Liberal Democrats | Steve Phillips | 987 | 38.7 | |
| Labour | Tony Elliott | 198 | 7.8 | |
| Green | Terence Carter | 185 | 7.3 | |
| Majority | 182 | 7.3 | ||
| Turnout | 2,539 | 32.2 | ||
| Conservative gain from Liberal Democrats | ||||
Brandon
| Party | Candidate | Votes | % | ± | |
|---|---|---|---|---|---|
| West Suffolk Independent | Victor Lukaniuk | 937 | 46.9 | N/A | |
| Conservative | Stephen Frost | 562 | 28.1 | +0.8 | |
| UKIP | Reg Silvester | 256 | 12.8 | -33.1 | |
| Labour | Susan Dean | 242 | 12.1 | +1.3 | |
| Majority | 375 | 18.8 | |||
| Turnout | 1,997 | 29.4 | |||
| West Suffolk Independent gain from UKIP | |||||
Bridge
| Party | Candidate | Votes | % | ± | |
|---|---|---|---|---|---|
| Labour Co-op | Jack Abbott | 1,036 | 50.0 | +6.1 | |
| Conservative | Mark Felix-Thomas | 630 | 30.4 | +10.4 | |
| Green | Charlotte Armstrong | 154 | 7.4 | +2.5 | |
| Independent | Lynn Turner | 139 | 6.7 | N/A | |
| Liberal Democrats | Christopher Wrathall | 114 | 5.5 | +1.3 | |
| Majority | 406 | 19.6 | |||
| Turnout | 2,073 | 26.9 | |||
| Labour Co-op hold | Swing | ||||
Bungay
| Party | Candidate | Votes | % | |
|---|---|---|---|---|
| Conservative | David Ritchie | 1,534 | 53.1 | |
| Labour | Sue Collins | 758 | 26.2 | |
| Green | Pauline Midwinter | 280 | 9.7 | |
| Liberal Democrats | Dave O'Neill | 173 | 6.0 | |
| UKIP | Andrew Bols | 144 | 5.0 | |
| Majority | 776 | 26.9 | ||
| Turnout | 2,889 | 39.4 | ||
| Conservative hold | ||||
Carlford
| Party | Candidate | Votes | % | |
|---|---|---|---|---|
| Conservative | Robin Vickery | 1,646 | 55.4 | |
| Independent | Rose Johnson | 411 | 13.8 | |
| Liberal Democrats | Kay Yule | 311 | 10.5 | |
| Labour | Shasha Toptani | 293 | 9.9 | |
| Green | Miriam Burns | 185 | 6.2 | |
| UKIP | Michael Coney | 123 | 4.1 | |
| Majority | 1,235 | 41.6 | ||
| Turnout | 2,969 | 42.4 | ||
| Conservative hold | ||||
Chantry
| Party | Candidate | Votes | % | ± | |
|---|---|---|---|---|---|
| Labour | Helen Armitage | 2,246 | 23.0 | -1.7 | |
| Labour | Peter Gardiner | 2,145 | 22.0 | -2.3 | |
| Conservative | Bob Hall | 2,110 | 21.6 | +8.6 | |
| Conservative | Nadia Cenci | 2,069 | 21.2 | +8.9 | |
| UKIP | Alan Cotterell | 658 | 6.7 | -8.7 | |
| Liberal Democrats | Robert Chambers | 271 | 2.8 | -0.1 | |
| Liberal Democrats | Maureen Haaker | 257 | 2.6 | +0.9 | |
| Majority | |||||
| Turnout | 32.0 | ||||
| Labour hold | Swing | ||||
| Labour hold | Swing | ||||
Clare
| Party | Candidate | Votes | % | ± | |
|---|---|---|---|---|---|
| Conservative | Mary Evans | 2,445 | 66.8 | +20.5 | |
| Liberal Democrats | Alex Rolph | 545 | 14.9 | N/A | |
| Labour | Robin Davies | 355 | 9.7 | +3.0 | |
| UKIP | Stuart Letten | 315 | 8.6 | -23.0 | |
| Majority | 1,900 | 51.9 | |||
| Turnout | 3,660 | 41.9 | |||
| Conservative hold | Swing | ||||
Cosford
| Party | Candidate | Votes | % | ± | |
|---|---|---|---|---|---|
| Green | Robert Lindsay | 1,630 | 48.4 | +8.0 | |
| Conservative | Philip Mutton | 1,519 | 45.1 | -6.8 | |
| UKIP | Leon Stedman | 115 | 3.4 | N/A | |
| Labour | Rickaby Shearly-Sanders | 106 | 3.1 | -4.7 | |
| Majority | 111 | 3.3 | |||
| Turnout | 3,370 | 47.8 | +6.1 | ||
| Green gain from Conservative | Swing | ||||
Eastgate & Moreton Hall
| Party | Candidate | Votes | % | |
|---|---|---|---|---|
| Independent | Trevor Beckwith | 1,050 | 41.4 | |
| Conservative | Peter Thompson | 924 | 36.4 | |
| Labour | Elle Zwandahl | 308 | 12.1 | |
| Liberal Democrats | Chris Lale | 255 | 10.1 | |
| Majority | 126 | 5.0 | ||
| Turnout | 2,537 | 35.0 | ||
| Independent hold | ||||
Exning & Newmarket
| Party | Candidate | Votes | % | |
|---|---|---|---|---|
| Conservative | Rachel Hood | 909 | 37.2 | |
| Labour | Michael Jefferys | 585 | 23.9 | |
| West Suffolk Independent | Simon Cole | 561 | 23.0 | |
| UKIP | Dave Hudson | 252 | 10.3 | |
| Liberal Democrats | Martin Redbond | 136 | 5.6 | |
| Majority | 324 | 13.3 | ||
| Turnout | 2,443 | 31.1 | ||
| Conservative gain from UKIP | ||||
Felixstowe Coastal
| Party | Candidate | Votes | % | |
|---|---|---|---|---|
| Conservative | Graham Newman | 3,198 | 28.0 | |
| Conservative | Steve Wiles | 3,018 | 26.4 | |
| Labour | Margaret Morris | 1,038 | 9.1 | |
| Labour | Corrine Franklin | 1,036 | 9.1 | |
| Liberal Democrats | Seamus Bennett | 1,028 | 9.0 | |
| Liberal Democrats | Jan Candy | 754 | 6.6 | |
| UKIP | Keith Phair | 727 | 6.4 | |
| Green | Kay Lyndle | 403 | 3.5 | |
| Green | Aidan Semmens | 230 | 2.0 | |
| Majority | ||||
| Turnout | 39.0 | |||
| Conservative hold | ||||
| Conservative hold | ||||
Felixstowe North & Trimley
| Party | Candidate | Votes | % | ± | |
|---|---|---|---|---|---|
| Conservative | Stuart Bird | 1,295 | 49.2 | +4.2 | |
| Labour | Dave Ablitt | 692 | 26.3 | -10.8 | |
| UKIP | David Coutts | 306 | 11.6 | N/A | |
| Liberal Democrats | Andrew Marfleet | 235 | 8.9 | -9.1 | |
| Green | Jonathan Mulbery | 106 | 4.0 | N/A | |
| Majority | 603 | 22.9 | |||
| Turnout | 2,634 | 34.7 | |||
| Conservative hold | Swing | ||||
Framlingham
| Party | Candidate | Votes | % | ± | |
|---|---|---|---|---|---|
| Conservative | Stephen Burroughes | 1,685 | 57.2 | +12.9 | |
| Green | James Holloway | 408 | 13.8 | +3.7 | |
| Labour | Kezia Bayfield | 389 | 13.2 | -0.9 | |
| Liberal Democrats | Andrew Turner | 310 | 10.5 | +1.8 | |
| UKIP | David Owen | 156 | 5.3 | -17.6 | |
| Majority | 1,277 | 43.3 | |||
| Turnout | 2,948 | 42.0 | |||
| Conservative hold | Swing | ||||
Gainsborough
| Party | Candidate | Votes | % | ± | |
|---|---|---|---|---|---|
| Labour | Kim Clements | 1,081 | 41.3 | -6.1 | |
| Conservative | Liz Harsant | 1,078 | 41.2 | +17.0 | |
| UKIP | Shayne Pooley | 275 | 10.5 | -11.4 | |
| Green | Ben Magrath | 110 | 4.2 | +1.4 | |
| Liberal Democrats | Robin Whitmore | 75 | 2.9 | -0.8 | |
| Majority | 3 | 0.1 | |||
| Turnout | 2,619 | 32.2 | |||
| Labour hold | Swing | ||||
Gipping Valley
| Party | Candidate | Votes | % | ± | |
|---|---|---|---|---|---|
| Liberal Democrats | John Field | 1,030 | 40.1 | +8.1 | |
| Conservative | John Whitehead | 1,000 | 39.0 | +13.1 | |
| Labour | Julie Cuninghame | 249 | 9.7 | -3.8 | |
| UKIP | David Bosworth | 203 | 7.9 | -16.2 | |
| Green | David Penny | 85 | 3.3 | -1.2 | |
| Majority | 30 | 1.2 | |||
| Turnout | 2,567 | 34.2 | |||
| Liberal Democrats hold | Swing | ||||
Great Cornard
| Party | Candidate | Votes | % | ± | |
|---|---|---|---|---|---|
| Conservative | Peter Beer | 902 | 48.9 | +5.9 | |
| Labour | Sarah Page | 522 | 28.3 | -3.3 | |
| UKIP | Aidan Powlesland | 173 | 9.4 | N/A | |
| Liberal Democrats | Marjorie Bark | 157 | 8.5 | +1.9 | |
| Green | Dean Walton | 91 | 4.9 | -14.0 | |
| Majority | 380 | 20.6 | |||
| Turnout | 1,845 | 25.8 | |||
| Conservative hold | Swing | ||||
Gunton
| Party | Candidate | Votes | % | ± | |
|---|---|---|---|---|---|
| Conservative | Steve Ardley | 1,569 | 19.9 | +6.6 | |
| Labour | Keith Patience | 1,517 | 19.2 | -0.7 | |
| Conservative | Mary Rudd | 1,511 | 19.1 | +6.9 | |
| Labour | Janet Craig | 1,471 | 18.6 | -1.2 | |
| UKIP | Bernie Guymer | 570 | 7.2 | -6.0 | |
| UKIP | Jenny Hinton | 503 | 6.4 | -5.6 | |
| Green | Emma Bateman | 297 | 3.8 | +0.3 | |
| Liberal Democrats | Steven Taylor | 258 | 3.3 | +2.2 | |
| Green | Rupert Butley | 201 | 2.6 | -0.5 | |
| Majority | |||||
| Turnout | 4,121 | 27.5 | |||
| Conservative gain from Labour | Swing | ||||
| Labour hold | Swing | ||||
Hadleigh
| Party | Candidate | Votes | % | ± | |
|---|---|---|---|---|---|
| Conservative | Mick Fraser | 847 | 39.6 | +8.0 | |
| Liberal Democrats | Trevor Sheldrick | 795 | 37.2 | +13.0 | |
| Labour | Sue Monks | 330 | 15.4 | -1.2 | |
| UKIP | Christine Hempstead | 91 | 4.3 | -18.4 | |
| Green | Lisa Gordon | 75 | 3.5 | -1.4 | |
| Majority | 52 | 2.4 | |||
| Turnout | 2,138 | 31.8 | |||
| Conservative hold | Swing | ||||
Halesworth
| Party | Candidate | Votes | % | |
|---|---|---|---|---|
| Conservative | Tony Goldson | 1,545 | 53.5 | |
| Labour | Peter Coghill | 608 | 21.1 | |
| Green | Alice Bull | 290 | 10.0 | |
| Liberal Democrats | Sarah Hunt | 249 | 8.6 | |
| UKIP | James Scott | 196 | 6.8 | |
| Majority | 937 | 32.4 | ||
| Turnout | 2,888 | 39.1 | ||
| Conservative hold | ||||
Hardwick
| Party | Candidate | Votes | % | ± | |
|---|---|---|---|---|---|
| Conservative | Richard Rout | 1,645 | 58.7 | +28.7 | |
| Liberal Democrats | Helen Korfanty | 470 | 16.8 | +5.3 | |
| Labour | Nicola Iannelli-Popham | 463 | 16.5 | +4.3 | |
| Green | Sara Rae | 224 | 8.0 | N/A | |
| Majority | 1,175 | 41.9 | |||
| Turnout | 2,802 | 41.8 | |||
| Conservative hold | Swing | ||||
Hartismere
| Party | Candidate | Votes | % | ± | |
|---|---|---|---|---|---|
| Conservative | Jessica Fleming | 1,810 | 61.2 | +17.7 | |
| Green | Rowland Warboys | 459 | 15.5 | +0.9 | |
| Labour | Anthony Scott-Robinson | 431 | 14.6 | +0.1 | |
| Liberal Democrats | Josh Townsley | 258 | 8.7 | +2.5 | |
| Majority | 1,351 | 45.7 | |||
| Turnout | 2,958 | 36.5 | |||
| Conservative hold | Swing | ||||
Haverhill Cangle
| Party | Candidate | Votes | % | ± | |
|---|---|---|---|---|---|
| Conservative | Paula Fox | 1,481 | 23.2 | +0.7 | |
| Conservative | Quillon Fox | 1,324 | 20.7 | +1.5 | |
| Labour | Maureen Byrne | 1,134 | 17.8 | -2.4 | |
| Labour | David Smith | 845 | 13.2 | -2.3 | |
| UKIP | Julian Flood | 773 | 12.1 | -7.4 | |
| Liberal Democrats | Lewis Curtis | 455 | 7.1 | +2.9 | |
| Liberal Democrats | Ken Rolph | 376 | 5.9 | +1.7 | |
| Majority | |||||
| Turnout | 3,462 | 26.1 | |||
| Conservative gain from UKIP | Swing | ||||
| Conservative gain from UKIP | Swing | ||||
Haverhill East & Kedington
| Party | Candidate | Votes | % | ± | |
|---|---|---|---|---|---|
| Conservative | David Roach | 922 | 47.9 | +22.9 | |
| Labour | Jason Simpkin | 464 | 24.1 | +2.7 | |
| UKIP | Ant Williams | 366 | 19.0 | -20.2 | |
| Liberal Democrats | Oliver Forder | 172 | 8.9 | -2.8 | |
| Majority | 458 | 23.8 | |||
| Turnout | 1,924 | 27.5 | |||
| Conservative gain from UKIP | Swing | ||||
Hoxne & Eye
| Party | Candidate | Votes | % | ± | |
|---|---|---|---|---|---|
| Conservative | Guy McGregor | 1,846 | 56.9 | +11.3 | |
| Liberal Democrats | John Blake | 470 | 14.5 | +9.4 | |
| Labour Co-op | Garry Deeks | 466 | 14.4 | -2.1 | |
| Green | James Hargrave | 268 | 8.3 | -0.1 | |
| UKIP | Roger Fouracre | 197 | 6.1 | -18.4 | |
| Majority | 1,376 | 42.4 | |||
| Turnout | 3,247 | 41.4 | |||
| Conservative hold | Swing | ||||
Kesgrave & Rushmere St Andrew
| Party | Candidate | Votes | % | ± | |
|---|---|---|---|---|---|
| Conservative | Stuart Lawson | 2,840 | 28.5 | +2.9 | |
| Conservative | Robert Whiting | 2,474 | 24.8 | +2.3 | |
| Labour | Becky Patten | 1,083 | 10.9 | -1.8 | |
| Labour | Helen Clarkson | 961 | 9.6 | -0.4 | |
| Independent | Mark Ling | 543 | 5.4 | N/A | |
| Liberal Democrats | Sally Neal | 436 | 4.4 | -1.8 | |
| Independent | Jonathan Ogden | 434 | 4.3 | N/A | |
| UKIP | David Mears | 390 | 3.9 | -13.9 | |
| Liberal Democrats | Jon Neal | 380 | 3.8 | -2.5 | |
| Green | Barbara Richardson-Todd | 295 | 3.0 | N/A | |
| Green | Charlie Zakss | 145 | 1.5 | N/A | |
| Majority | |||||
| Turnout | 33.0 | ||||
| Conservative hold | Swing | ||||
| Conservative hold | Swing | ||||
Kessingland & Southwold
| Party | Candidate | Votes | % | ± | |
|---|---|---|---|---|---|
| Conservative | Michael Ladd | 1,392 | 48.9 | +11.3 | |
| Liberal Democrats | David Beavan | 498 | 17.5 | +14.8 | |
| Labour | Paul Tyack | 497 | 17.5 | -4.2 | |
| UKIP | Jean Difford | 308 | 10.8 | -20.7 | |
| Green | Callum Rollo | 150 | 5.3 | -1.3 | |
| Majority | 894 | 31.4 | |||
| Turnout | 2,845 | 38.2 | |||
| Conservative hold | Swing | ||||
Lowestoft South
| Party | Candidate | Votes | % | ± | |
|---|---|---|---|---|---|
| Conservative | Jenny Ceresa | 1,582 | 20.1 | +9.8 | |
| Conservative | Jamie Starling | 1,455 | 18.5 | +9.3 | |
| Labour | Tess Gandy | 1,174 | 14.9 | -2.4 | |
| Labour | David Finnigan | 1,167 | 14.8 | -2.3 | |
| UKIP | Peter Collecott | 489 | 6.2 | -12.0 | |
| UKIP | Steve Harvey | 444 | 5.6 | -12.5 | |
| Independent | Desmond Baldry | 428 | 5.4 | N/A | |
| Independent | Bill Mountford | 409 | 5.2 | N/A | |
| Green | Peter Lang | 203 | 2.6 | -0.1 | |
| Green | Mark Morgan | 191 | 2.4 | +0.2 | |
| Liberal Democrats | Sandra Tonge | 179 | 2.3 | -0.4 | |
| Liberal Democrats | Darius McCarthy | 160 | 2.0 | -0.2 | |
| Majority | |||||
| Turnout | 4,135 | 28.0 | |||
| Conservative gain from UKIP | Swing | ||||
| Conservative gain from UKIP | Swing | ||||
Martlesham
| Party | Candidate | Votes | % | ± | |
|---|---|---|---|---|---|
| Conservative | Patricia O'Brien | 2,542 | 67.6 | +17.1 | |
| Liberal Democrats | Mark Gibbons | 458 | 12.2 | -10.2 | |
| Labour | Jeremy Hawksley | 446 | 11.9 | -2.5 | |
| Green | Betsy Reid | 315 | 8.4 | -4.4 | |
| Majority | 2,084 | 55.4 | |||
| Turnout | 3,761 | 41.6 | |||
| Conservative hold | Swing | ||||
Melford
| Party | Candidate | Votes | % | ± | |
|---|---|---|---|---|---|
| Independent | Richard Kemp | 1,614 | 56.0 | +2.8 | |
| Conservative | Margaret Maybury | 809 | 28.1 | +12.0 | |
| Labour | Paul Watson | 208 | 7.2 | +0.6 | |
| Green | John Smith | 131 | 4.5 | -1.1 | |
| UKIP | Peter Lynham | 119 | 4.1 | -14.2 | |
| Majority | 805 | 27.9 | |||
| Turnout | 2,881 | 35.7 | |||
| Independent hold | Swing | ||||
Mildenhall
| Party | Candidate | Votes | % | ± | |
|---|---|---|---|---|---|
| Conservative | Louis Busuttil | 1,405 | 65.5 | +26.2 | |
| Independent | David Chandler | 423 | 19.7 | N/A | |
| Labour | Kevin Yarrow | 317 | 14.8 | +0.9 | |
| Majority | 982 | 45.8 | |||
| Turnout | 2,145 | 30.7 | |||
| Conservative hold | Swing | ||||
Newmarket & Red Lodge
| Party | Candidate | Votes | % | ± | |
|---|---|---|---|---|---|
| Conservative | Robin Millar | 1,203 | 50.5 | +5.9 | |
| Labour | Joy Uney | 373 | 15.6 | -5.2 | |
| UKIP | Roger Dicker | 322 | 13.5 | -14.9 | |
| West Suffolk Independent | Andrew Appleby | 273 | 11.5 | N/A | |
| Liberal Democrats | Andrew Gillett | 213 | 8.9 | +2.6 | |
| Majority | 830 | 34.8 | |||
| Turnout | 2,384 | 25.6 | |||
| Conservative hold | Swing | ||||
Oulton
| Party | Candidate | Votes | % | ± | |
|---|---|---|---|---|---|
| Conservative | James Reeder | 2,274 | 25.0 | +7.2 | |
| Conservative | Keith Robinson | 2,139 | 23.5 | +6.3 | |
| Labour | Len Jacklin | 1,394 | 15.3 | -3.3 | |
| Labour | Lynne Ward | 1,368 | 15.0 | -2.2 | |
| UKIP | George Hawes | 607 | 6.7 | -13.2 | |
| UKIP | Bert Poole | 515 | 5.7 | N/A | |
| Green | Sally Phillips | 232 | 2.5 | -2.1 | |
| Green | Peter Eyres | 225 | 2.5 | -0.3 | |
| Liberal Democrats | Chris Thomas | 201 | 2.2 | -0.5 | |
| Liberal Democrats | Patrick Gillard | 145 | 1.6 | N/A | |
| Majority | |||||
| Turnout | 4,693 | 30.3 | |||
| Conservative gain from UKIP | Swing | ||||
| Conservative gain from Labour | Swing | ||||
Pakefield
| Party | Candidate | Votes | % | ± | |
|---|---|---|---|---|---|
| Conservative | Melanie Vigo di Gallidoro | 1,569 | 21.7 | +4.2 | |
| Conservative | Craig Rivett | 1,473 | 20.4 | +5.8 | |
| Labour | Peter Byatt | 1,369 | 19.0 | +1.5 | |
| Labour | Sonia Barker | 1,333 | 18.4 | +1.2 | |
| UKIP | Robin Hinton | 384 | 5.3 | -10.5 | |
| UKIP | Phillip Trindall | 367 | 5.1 | -9.6 | |
| Liberal Democrats | Adam Robertson | 215 | 3.0 | +1.3 | |
| Liberal Democrats | Christian Newsome | 190 | 2.6 | N/A | |
| Green | Rachel Fawkes | 182 | 2.5 | +0.1 | |
| Green | Ben Quail | 162 | 2.2 | +0.2 | |
| Majority | |||||
| Turnout | 3,715 | 31.0 | |||
| Conservative gain from Labour | Swing | ||||
| Conservative gain from Labour | Swing | ||||
Peninsula
| Party | Candidate | Votes | % | ± | |
|---|---|---|---|---|---|
| Liberal Democrats | Dave Wood | 1,337 | 38.9 | -4.2 | |
| Independent | Derek Davis | 923 | 26.9 | N/A | |
| Conservative | Will Shropshire | 786 | 22.9 | +2.5 | |
| Labour | Phil Dunnett | 274 | 8.0 | -1.9 | |
| Green | Andrew Sterling | 113 | 3.3 | -2.9 | |
| Majority | 414 | 12.1 | |||
| Turnout | 3,433 | 42.3 | |||
| Liberal Democrats hold | Swing | ||||
Priory Heath
| Party | Candidate | Votes | % | ± | |
|---|---|---|---|---|---|
| Labour | Bill Quinton | 927 | 50.0 | -3.0 | |
| Conservative | Andy Shannon | 639 | 34.2 | +16.9 | |
| UKIP | Pippa Gordon | 141 | 7.5 | -13.3 | |
| Liberal Democrats | Nicholas Jacob | 93 | 5.0 | +0.7 | |
| Green | Andrew Patmore | 71 | 3.8 | -0.9 | |
| Majority | 288 | 15.4 | |||
| Turnout | 1,871 | 28.3 | |||
| Labour hold | Swing | ||||
Row Heath
| Party | Candidate | Votes | % | ± | |
|---|---|---|---|---|---|
| Conservative | Colin Noble | 1,362 | 52.4 | +9.1 | |
| Independent | David Gathercole | 383 | 14.7 | +3.5 | |
| Independent | John Smith | 379 | 14.6 | N/A | |
| Labour | Jack Fawbert | 313 | 12.0 | +4.2 | |
| Liberal Democrats | Ralph Brownie | 164 | 6.3 | +3.3 | |
| Majority | 979 | 37.6 | |||
| Turnout | 2,601 | 32.3 | |||
| Conservative hold | Swing | ||||
Rushmere
| Party | Candidate | Votes | % | ± | |
|---|---|---|---|---|---|
| Labour | Sandra Gage | 1,429 | 50.5 | +3.2 | |
| Conservative | Paul Cawthorn | 997 | 35.2 | +8.6 | |
| Liberal Democrats | Edward Packard | 162 | 5.7 | +1.9 | |
| UKIP | Jo Grant | 152 | 5.4 | -11.6 | |
| Green | Maxwell Phillips | 89 | 3.1 | -0.9 | |
| Majority | 432 | 15.3 | |||
| Turnout | 2,829 | 39.1 | |||
| Labour hold | Swing | ||||
Samford
| Party | Candidate | Votes | % | ± | |
|---|---|---|---|---|---|
| Conservative | Gordon Jones | 1,502 | 43.3 | +9.6 | |
| Liberal Democrats | Sue Carpendale | 1,410 | 40.6 | +15.2 | |
| Labour | Charlie Nixon | 323 | 9.3 | -1.0 | |
| UKIP | Steve Laing | 235 | 6.8 | -18.0 | |
| Majority | 92 | 2.7 | |||
| Turnout | 3,470 | 42.6 | |||
| Conservative hold | Swing | ||||
St Helen's
| Party | Candidate | Votes | % | ± | |
|---|---|---|---|---|---|
| Labour | Mandy Gaylard | 1,322 | 54.7 | +9.2 | |
| Conservative | Alex Burgess | 664 | 27.5 | +9.3 | |
| Liberal Democrats | Julia Barrett | 201 | 8.3 | +0.5 | |
| Green | Maria Harrison | 142 | 5.9 | -4.3 | |
| UKIP | Wilfred Arasaratnam | 88 | 3.6 | -14.7 | |
| Majority | 658 | 27.2 | |||
| Turnout | 2,417 | 30.5 | |||
| Labour hold | Swing | ||||
St John's
| Party | Candidate | Votes | % | ± | |
|---|---|---|---|---|---|
| Labour Co-op | Sandy Martin | 1,383 | 57.6 | +3.0 | |
| Conservative | Steve Flood | 761 | 31.7 | +3.5 | |
| Green | Jane Scott | 138 | 5.7 | -5.7 | |
| Liberal Democrats | Kenneth Toye | 120 | 5.0 | -0.9 | |
| Majority | 622 | 25.9 | |||
| Turnout | 2,402 | 35.86 | |||
| Labour Co-op hold | Swing | ||||
St Margaret's & Westgate
| Party | Candidate | Votes | % | ± | |
|---|---|---|---|---|---|
| Liberal Democrats | Inga Lockington | 2,284 | 19.3 | +4.3 | |
| Conservative | Chris Chambers | 1,954 | 16.5 | +2.5 | |
| Labour | Sarah Adams | 1,897 | 16.0 | -1.2 | |
| Liberal Democrats | Oliver Holmes | 1,869 | 15.8 | +3.3 | |
| Conservative | Lee Reynolds | 1,697 | 14.3 | +1.8 | |
| Labour | Jan Parry | 1,541 | 13.0 | -1.9 | |
| Green | Kirsty Wilmot | 323 | 2.7 | N/A | |
| Green | John Mann | 287 | 2.4 | -2.6 | |
| Majority | |||||
| Turnout | 11,852 | 40.0 | |||
| Liberal Democrats hold | Swing | ||||
| Conservative gain from Labour | Swing | ||||
Stour Valley
| Party | Candidate | Votes | % | ± | |
|---|---|---|---|---|---|
| Conservative | James Finch | 1,428 | 51.4 | +8.9 | |
| Liberal Democrats | Bryn Hurren | 966 | 34.8 | +7.6 | |
| Labour | John Cook | 167 | 6.0 | -2.3 | |
| UKIP | James Carver | 121 | 4.4 | -17.6 | |
| Green | Lois Hickey | 96 | 3.5 | N/A | |
| Majority | 462 | ||||
| Turnout | 2,778 | 43.1 | |||
| Conservative hold | Swing | ||||
Stowmarket North & Stowupland
| Party | Candidate | Votes | % | ± | |
|---|---|---|---|---|---|
| Conservative | Gary Green | 1,320 | 49.4 | +13.3 | |
| Green | Keith Welham | 793 | 29.7 | +14.3 | |
| Labour | Susan Hollands | 376 | 14.1 | -1.3 | |
| Liberal Democrats | John Curle | 181 | 6.8 | +3.8 | |
| Majority | 527 | ||||
| Turnout | 2,670 | 26.5 | |||
| Conservative hold | Swing | ||||
Stowmarket South
| Party | Candidate | Votes | % | ± | |
|---|---|---|---|---|---|
| Conservative | Nicholas Gowrley | 921 | 38.3 | +12.7 | |
| Liberal Democrats | Keith Scarff | 789 | 32.8 | +9.0 | |
| Labour | Nikki Betts | 307 | 12.8 | -1.1 | |
| UKIP | Stephen Searle | 220 | 9.2 | -16.4 | |
| Green | Max Betts-Davies | 167 | 6.9 | -4.2 | |
| Majority | 132 | ||||
| Turnout | 2,404 | 31.1 | |||
| Conservative gain from UKIP | Swing | ||||
Sudbury
| Party | Candidate | Votes | % | ± | |
|---|---|---|---|---|---|
| Labour | Jack Owen | 693 | 30.5 | -0.9 | |
| Conservative | Adrian Osborne | 631 | 27.8 | -16.5 | |
| Independent | John Sayers | 470 | 20.7 | N/A | |
| Liberal Democrats | Andrew Welsh | 262 | 11.5 | -0.7 | |
| Green | Julie Fowles-Smith | 124 | 5.5 | -6.7 | |
| UKIP | Steven Whalley | 91 | 4.3 | N/A | |
| Majority | 62 | ||||
| Turnout | 2,271 | 32.0 | |||
| Labour gain from Conservative | Swing | ||||
Sudbury East & Waldingfield
| Party | Candidate | Votes | % | ± | |
|---|---|---|---|---|---|
| Conservative | Colin Spence | 1,169 | 53.2 | +7.3 | |
| Labour | Luke Cresswell | 546 | 24.9 | +3.8 | |
| UKIP | Darren Clarke | 229 | 10.4 | -17.3 | |
| Liberal Democrats | Robert Spivey | 161 | 7.3 | N/A | |
| Green | John Burch | 92 | 4.2 | -1.1 | |
| Majority | 623 | ||||
| Turnout | 2,197 | 31.5 | |||
| Conservative hold | Swing | ||||
Thedwastre North
| Party | Candidate | Votes | % | ± | |
|---|---|---|---|---|---|
| Conservative | Jane Storey | 1,927 | 62.2 | +14.7 | |
| Green | Andy Mellen | 678 | 21.9 | +9.6 | |
| Labour | Ursula Ajimal | 293 | 9.5 | -1.3 | |
| Liberal Democrats | Jon James | 199 | 6.4 | +2.0 | |
| Majority | 1,249 | 40.3 | |||
| Turnout | 3,097 | 36.71 | |||
| Conservative hold | Swing | ||||
Thedwastre South
| Party | Candidate | Votes | % | ± | |
|---|---|---|---|---|---|
| Liberal Democrats | Penny Otton | 1,346 | 46.7 | +17.5 | |
| Conservative | Gilly Morgan | 1,263 | 43.8 | +16.1 | |
| Labour | Philip Cockell | 274 | 9.5 | +1.7 | |
| Majority | 83 | 2.9 | +1.4 | ||
| Turnout | 2,883 | 39.1 | |||
| Liberal Democrats hold | Swing | +0.7 | |||
Thingoe North
| Party | Candidate | Votes | % | ± | |
|---|---|---|---|---|---|
| Conservative | Beccy Hopfensperger[2] | 1,989 | 72.9 | +19.2 | |
| Labour Co-op | Frederick Rowell | 439 | 16.1 | +7.6 | |
| Liberal Democrats | Peter Turner | 302 | 11.1 | N/A | |
| Majority | 1,550 | 56.8 | +23.1 | ||
| Turnout | 2,730 | 38.19 | |||
| Conservative hold | Swing | ||||
Thingoe South
| Party | Candidate | Votes | % | |
|---|---|---|---|---|
| Conservative | Karen Soons | 2,110 | ||
| Liberal Democrats | Zigurds Kronbergs | 436 | ||
| Labour | Hilary Appleton | 409 | ||
| UKIP | Dawn Dicker | 145 | ||
| Majority | 1,674 | |||
| Turnout | 3,100 | |||
| Conservative hold | ||||
Thredling
| Party | Candidate | Votes | % | ± | |
|---|---|---|---|---|---|
| Conservative | Matthew Hicks | 2,066 | 70.0 | +20.5 | |
| Liberal Democrats | David Payne | 455 | 15.4 | +9.7 | |
| Labour | Stan Robinson | 431 | 14.6 | 5.1 | |
| Majority | 1,611 | 54.6 | |||
| Turnout | 2,952 | 37.99 | |||
| Conservative hold | Swing | ||||
Tower
| Party | Candidate | Votes | % | ± | |
|---|---|---|---|---|---|
| Conservative | Robert Everitt | 1,833 | 20.2 | +6.6 | |
| Independent | David Nettleton | 1,628 | 17.9 | +2.9 | |
| Independent | Paul Hopfensperger[3] | 1,623 | 17.9 | N/A | |
| Green | Mark Ereira | 1,406 | 15.5 | -0.9 | |
| Labour | Quentin Cornish | 998 | 11.0 | +1.1 | |
| Labour | Alex Griffin | 907 | 10.0 | +0.7 | |
| Liberal Democrats | Julia Lale | 507 | 5.6 | +1.2 | |
| Liberal Democrats | Sheena Rawlings | 173 | 1.9 | N/A | |
| Majority | |||||
| Turnout | |||||
| Conservative gain from Green | Swing | ||||
| Independent hold | Swing | ||||
Upper Gipping
| Party | Candidate | Votes | % | ± | |
|---|---|---|---|---|---|
| Green | Andrew Stringer | 1,645 | 53.6 | +0.5 | |
| Conservative | Glen Horn | 1,135 | 37.0 | +16.4 | |
| Labour | Terry Wilson | 166 | 5.4 | +0.1 | |
| Liberal Democrats | Mark Valladares | 122 | 5.4 | +2.8 | |
| Majority | 510 | ||||
| Turnout | 3,068 | 39 | |||
| Green hold | Swing | ||||
Whitehouse & Whitton
| Party | Candidate | Votes | % | ± | |
|---|---|---|---|---|---|
| Conservative | David Goldsmith | 1,869 | 21.9 | +7.7 | |
| Labour | Kathy Bole | 1,833 | 21.4 | -2.1 | |
| Labour | Rob Bridgeman | 1,733 | 20.3 | +1.9 | |
| Conservative | Erion Xhaferaj | 1,409 | 16.5 | +2.4 | |
| UKIP | Tony Gould | 680 | 8.0 | -11.3 | |
| Green | Liz Smith | 293 | 3.4 | -2.3 | |
| Liberal Democrats | Martin Hore | 263 | 3.1 | +0.5 | |
| Green | Shaun McDonald | 256 | 3.0 | N/A | |
| Liberal Democrats | Malcolm Mitchell | 216 | 2.5 | -0.1 | |
| Majority | |||||
| Turnout | |||||
| Conservative gain from UKIP | Swing | ||||
| Labour hold | Swing | ||||
Wickham
| Party | Candidate | Votes | % | ± | |
|---|---|---|---|---|---|
| Conservative | Alexander Nicoll | 1,566 | 48.4 | +1.8 | |
| Liberal Democrats | Kit Twinch | 684 | 21.2 | +9.3 | |
| Labour | Lesley Bensley | 418 | 12.9 | -7.9 | |
| UKIP | Trevor Coult MC | 308 | 9.5 | -11.8 | |
| Green | Catherine Walsh | 258 | 8.0 | N/A | |
| Majority | 882 | ||||
| Turnout | 3,234 | 38.82 | |||
| Conservative hold | Swing | ||||
Wilford
| Party | Candidate | Votes | % | ± | |
|---|---|---|---|---|---|
| Conservative | Andrew Reid | 1,578 | 56.8 | -5.1 | |
| Green | Victoria Hambley | 352 | 12.7 | N/A | |
| Liberal Democrats | Nigel Brown | 339 | 12.2 | -3.8 | |
| Labour | Philip Harle | 315 | 11.3 | -10.8 | |
| UKIP | Garry Debenham | 194 | 7.0 | N/A | |
| Majority | 1,226 | ||||
| Turnout | 2,778 | 41.8 | |||
| Conservative hold | Swing | ||||
Woodbridge
| Party | Candidate | Votes | % | ± | |
|---|---|---|---|---|---|
| Liberal Democrats | Caroline Page | 1,547 | 51.4 | +9.7 | |
| Conservative | Stephen Attwell | 1,041 | 34.6 | +2.4 | |
| Labour | Vicky Jones | 254 | 8.4 | -0.1 | |
| Green | Eamonn O'Nolan | 113 | 3.8 | -0.7 | |
| UKIP | Ray Tunstall | 55 | 1.8 | -10.3 | |
| Majority | 506 | ||||
| Turnout | 3,010 | 47.19 | |||
| Liberal Democrats hold | Swing | ||||
References
- "Upcoming elections & referendums". Electoral Commission. Retrieved 15 September 2016.
- "Councillor details – Suffolk County Councillor Beccy Hopfensperger - Cabinet Member for Adult Care". 28 January 2019.
- "Councillor Paul Hopfensperger - Official Website".
| Suffolk County Council | |
|---|---|
| Babergh District Council | |
| East Suffolk District Council | |
| Ipswich Borough Council | |
| Mid Suffolk District Council | |
| West Suffolk District Council | |
| East Suffolk County Council |
|
| Forest Heath District Council |
|
| St Edmundsbury Borough Council |
|
| Suffolk Coastal District Council | |
| Waveney District Council | |
| West Suffolk County Council |
|
| |