Bradford North (UK Parliament constituency)
| Bradford North | |
|---|---|
|
Former Borough constituency for the House of Commons | |
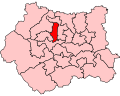 Boundary of Bradford North in West Yorkshire for the 2005 general election. | |
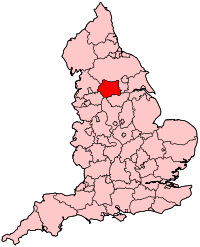 Location of West Yorkshire within England. | |
| County |
1918–1974: West Riding of Yorkshire 1974–2010: West Yorkshire |
| Major settlements | Bradford |
| 1918–2010 | |
| Number of members | One |
| Replaced by | Bradford East |
| Created from | Bradford East |
Bradford North was a borough constituency represented in the House of Commons of the Parliament of the United Kingdom. Until it was abolished for the 2010 general election, it elected one Member of Parliament (MP) by the first past the post system of election.
Boundaries
1918-1950: The County Borough of Bradford wards of Allerton, Bolton, Eccleshill, Heaton, Idle, and Thornton.
1950-1955: The County Borough of Bradford wards of Allerton, Bolton, Eccleshill, Heaton, and Idle.
1955-1974: The County Borough of Bradford wards of Bolton, Bradford Moor, Eccleshill, Idle, and North East.
1974-1983: The County Borough of Bradford wards of Bolton, Bowling, Bradford Moor, Eccleshill, Idle, Laisterdyke, and Undercliffe.
1983-2010: The City of Bradford wards of Bolton, Bowling, Bradford Moor, Eccleshill, Idle, and Undercliffe.
The constituency covered the northern part of Bradford.
Following the review of parliamentary representation in West Yorkshire by the Boundary Commission for England, Bradford was significantly altered, and the resulting constituency was renamed as Bradford East, with effect from the 2010 general election.
Members of Parliament
Elections
This constituency was replaced by Bradford East for the 2010 general election.
Elections in the 1910s
| Party | Candidate | Votes | % | ± | |
|---|---|---|---|---|---|
| C | Unionist | Archibald Boyd-Carpenter | 11,042 | 49.7 | n/a |
| Labour | John Palin | 6,499 | 29.2 | n/a | |
| Liberal | Everest Binns | 4,688 | 21.1 | n/a | |
| Majority | 4,543 | 20.5 | n/a | ||
| Turnout | 67.3 | n/a | |||
| Unionist win | |||||
| C indicates candidate endorsed by the coalition government. | |||||
Elections in the 1920s
| Party | Candidate | Votes | % | ± | |
|---|---|---|---|---|---|
| Unionist | Archibald Boyd-Carpenter | 10,260 | 36.5 | -13.2 | |
| Liberal | Walter Rea | 9,008 | 32.0 | +10.9 | |
| Labour | John Palin | 8,869 | 31.5 | +2.3 | |
| Majority | 1,252 | 4.5 | -16.0 | ||
| Turnout | 84.0 | +12.7 | |||
| Unionist hold | Swing | ||||
| Party | Candidate | Votes | % | ± | |
|---|---|---|---|---|---|
| Liberal | Walter Rea | 9,365 | 34.0 | +2.0 | |
| Unionist | Archibald Boyd-Carpenter | 9,192 | 33.3 | -3.2 | |
| Labour | Thomas Blythe | 9,036 | 32.7 | +1.2 | |
| Majority | 173 | 0.7 | +5.2 | ||
| Turnout | 81.7 | -2.3 | |||
| Liberal gain from Unionist | Swing | +2.6 | |||
| Party | Candidate | Votes | % | ± | |
|---|---|---|---|---|---|
| Unionist | Eugene Ramsden | 11,459 | 39.6 | +6.3 | |
| Labour | Frank Wise | 9,442 | 32.7 | -0.0 | |
| Liberal | Walter Rea | 8,007 | 27.7 | -6.3 | |
| Majority | 2,017 | 6.9 | |||
| Turnout | 84.7 | ||||
| Unionist gain from Liberal | Swing | ||||
| Party | Candidate | Votes | % | ± | |
|---|---|---|---|---|---|
| Labour | Norman Angell | 17,873 | 41.0 | +8.3 | |
| Unionist | Eugene Ramsden | 15,413 | 35.4 | -4.2 | |
| Liberal | Joseph Burton Hobman | 10,290 | 23.6 | -4.1 | |
| Majority | 2,460 | 5.5 | 12.4 | ||
| Turnout | 84.5 | -0.2 | |||
| Labour gain from Unionist | Swing | +6.2 | |||
Elections in the 1930s
| Party | Candidate | Votes | % | ± | |
|---|---|---|---|---|---|
| Conservative | Eugene Ramsden | 31,537 | 71.8 | ||
| Labour | Philip Butler | 12,401 | 28.2 | ||
| Majority | 19,136 | 43.5 | |||
| Turnout | 43,938 | 83.1 | |||
| Conservative gain from Labour | Swing | ||||
| Party | Candidate | Votes | % | ± | |
|---|---|---|---|---|---|
| Conservative | Eugene Ramsden | 21,150 | 53.0 | ||
| Labour | Muriel Nichol | 14,047 | 35.2 | ||
| National Dividend[3] | Reginald Kenney | 4,684 | 11.7 | ||
| Majority | 7,103 | 17.8 | |||
| Turnout | 39,881 | 72.3 | |||
| Conservative hold | Swing | ||||
General Election 1939/40:
Another General Election was required to take place before the end of 1940. The political parties had been making preparations for an election to take place from 1939 and by the end of this year, the following candidates had been selected;
- National Labour: George R Carter[4]
- Labour: Muriel Nichol
Elections in the 1940s
| Party | Candidate | Votes | % | ± | |
|---|---|---|---|---|---|
| Labour | Muriel Nichol | 20,268 | 43.6 | ||
| Conservative | John Andrews Benn | 16,824 | 36.2 | ||
| Liberal | Robert Wilson Town | 9,337 | 20.1 | ||
| Majority | 3,444 | 7.4 | |||
| Turnout | 79.6 | ||||
| Labour gain from Conservative | Swing | +12.7 | |||
Elections in the 1950s
| Party | Candidate | Votes | % | ± | |
|---|---|---|---|---|---|
| Conservative and National Liberal | William Taylor | 20,628 | 45.71 | ||
| Labour | Muriel Nichol | 18,517 | 41.03 | ||
| Liberal | Jack Kitching | 5,985 | 13.26 | ||
| Majority | 2,111 | 4.68 | |||
| Turnout | 87.70 | ||||
| Conservative and National Liberal gain from Labour | Swing | ||||
| Party | Candidate | Votes | % | ± | |
|---|---|---|---|---|---|
| Conservative and National Liberal | William Taylor | 24,524 | 54.29 | ||
| Labour | Edward J Parris | 20,647 | 45.71 | ||
| Majority | 3,877 | 8.58 | |||
| Turnout | 87.14 | ||||
| Conservative and National Liberal hold | Swing | ||||
| Party | Candidate | Votes | % | ± | |
|---|---|---|---|---|---|
| Conservative and National Liberal | William Taylor | 21,084 | 50.08 | ||
| Labour | Maurice Webb | 21,015 | 49.92 | ||
| Majority | 69 | 0.16 | |||
| Turnout | 81.79 | ||||
| Conservative and National Liberal hold | Swing | ||||
| Party | Candidate | Votes | % | ± | |
|---|---|---|---|---|---|
| Conservative and National Liberal | William Taylor | 22,850 | 53.10 | ||
| Labour | John Marshall | 20,179 | 46.90 | ||
| Majority | 2,671 | 6.21 | |||
| Turnout | 82.82 | ||||
| Conservative and National Liberal hold | Swing | ||||
Elections in the 1960s
| Party | Candidate | Votes | % | ± | |
|---|---|---|---|---|---|
| Labour | Ben Ford | 17,905 | 43.61 | ||
| Conservative and National Liberal | William Taylor | 16,507 | 40.21 | ||
| Liberal | Edgar Robinson | 6,642 | 16.18 | ||
| Majority | 1,398 | 3.41 | |||
| Turnout | 80.40 | ||||
| Labour gain from Conservative and National Liberal | Swing | ||||
| Party | Candidate | Votes | % | ± | |
|---|---|---|---|---|---|
| Labour | Ben Ford | 21,727 | 55.35 | ||
| Conservative | WH Peter Laycock | 17,528 | 44.65 | ||
| Majority | 4,199 | 10.70 | |||
| Turnout | 77.71 | ||||
| Labour hold | Swing | ||||
Elections in the 1970s
| Party | Candidate | Votes | % | ± | |
|---|---|---|---|---|---|
| Labour | Ben Ford | 20,141 | 52.11 | ||
| Conservative | WH Peter Laycock | 18,511 | 47.89 | ||
| Majority | 1,630 | 4.22 | |||
| Turnout | 73.84 | ||||
| Labour hold | Swing | ||||
| Party | Candidate | Votes | % | ± | |
|---|---|---|---|---|---|
| Labour | Ben Ford | 22,381 | 43.34 | ||
| Conservative | Patrick Thompson | 15,764 | 30.52 | ||
| Liberal | Gordon Lishman | 13,115 | 25.39 | ||
| Independent | A Marriott | 386 | 0.75 | ||
| Majority | 6,617 | 12.81 | |||
| Turnout | 78.84 | ||||
| Labour hold | Swing | ||||
| Party | Candidate | Votes | % | ± | |
|---|---|---|---|---|---|
| Labour | Ben Ford | 22,841 | 49.05 | ||
| Conservative | Patrick Thompson | 14,252 | 30.60 | ||
| Liberal | Gordon Lishman | 9,475 | 20.35 | ||
| Majority | 8,589 | 18.44 | |||
| Turnout | 70.41 | ||||
| Labour hold | Swing | ||||
| Party | Candidate | Votes | % | ± | |
|---|---|---|---|---|---|
| Labour | Ben Ford | 25,069 | 50.94 | ||
| Conservative | Neil Hamilton | 17,548 | 35.66 | ||
| Liberal | A Bagshawe | 5,819 | 11.83 | ||
| National Front | Andrew Brons | 614 | 1.25 | ||
| Workers Revolutionary | CE Smith | 158 | 0.32 | ||
| Majority | 7,521 | 15.28 | |||
| Turnout | 71.81 | ||||
| Labour hold | Swing | ||||
Elections in the 1980s
| Party | Candidate | Votes | % | ± | |
|---|---|---|---|---|---|
| Conservative | Geoffrey Lawler | 16,094 | 34.3 | ||
| Labour | Pat Wall | 14,492 | 30.9 | ||
| Social Democratic | Peter Birkby | 11,962 | 25.5 | ||
| Independent Labour | Ben Ford | 4,018 | 8.56 | ||
| Monster Raving Loony | Arthur Howarth | 194 | 0.4 | ||
| BNP | Michael Easter | 193 | 0.4 | ||
| Majority | 1,602 | 3.41 | |||
| Turnout | 70.8 | ||||
| Conservative gain from Labour | Swing | ||||
| Party | Candidate | Votes | % | ± | |
|---|---|---|---|---|---|
| Labour | Pat Wall | 21,009 | 42.84 | +11.98 | |
| Conservative | Geoffrey Lawler | 19,376 | 39.51 | +5.23 | |
| Social Democratic | Adrian Berkley | 8,656 | 17.65 | −7.83 | |
| Majority | 1,633 | 3.33 | |||
| Turnout | 49041 | 72.73 | +1.96 | ||
| Labour gain from Conservative | Swing | 6.74 | |||
Elections in the 1990s
| Party | Candidate | Votes | % | ± | |
|---|---|---|---|---|---|
| Labour | Terry Rooney | 18,619 | 51.7 | +8.8 | |
| Liberal Democrat | David Ward | 9,105 | 25.3 | +7.6 | |
| Conservative | Joy Atkin | 6,048 | 16.8 | −22.7 | |
| Islamic Party | David Pidcock | 800 | 2.2 | ||
| Green | Michael Knott | 447 | 1.2 | ||
| National Front | Robert Tenney | 305 | 0.8 | ||
| Independent | Joseph Floyd | 219 | 0.6 | ||
| Monster Raving Loony | Wild Willi Beckett | 210 | 0.6 | ||
| Liberal | Noel Nowosielski | 187 | 0.5 | ||
| Ind. Conservative | Malcolm Wigglesworth | 89 | 0.2 | ||
| Majority | 9,514 | 26.4 | +23.1 | ||
| Turnout | 36,029 | 53.4 | -19.3 | ||
| Labour hold | Swing | ||||
| Party | Candidate | Votes | % | ± | |
|---|---|---|---|---|---|
| Labour | Terry Rooney | 23,420 | 47.8 | +5.0 | |
| Conservative | Mohammed Riaz | 15,756 | 32.2 | −7.3 | |
| Liberal Democrat | David Ward | 9,133 | 18.7 | +1.0 | |
| Monster Raving Loony | Wild Willi Beckett | 369 | 0.9 | ||
| Islamic Party | Mohamed H. Nasr | 304 | 0.6 | ||
| Majority | 7,664 | 15.6 | |||
| Turnout | 48,963 | 73.4 | +0.7 | ||
| Labour hold | Swing | −10.8 | |||
| Party | Candidate | Votes | % | ± | |
|---|---|---|---|---|---|
| Labour | Terry Rooney | 23,493 | 56.1 | +8.3 | |
| Conservative | Rasjid Skinner | 10,723 | 25.6 | −6.6 | |
| Liberal Democrat | Terry Browne | 6,083 | 14.5 | −4.2 | |
| Referendum | Harry Wheatley | 1,227 | 2.9 | N/A | |
| Monster Raving Loony | Wild Willi Beckett | 369 | 0.9 | +0.3 | |
| Majority | 12,770 | 30.5 | +14.9 | ||
| Turnout | 41,895 | 63.3 | −10.1 | ||
| Labour hold | Swing | +7.4 | |||
Elections in the 2000s
| Party | Candidate | Votes | % | ± | |
|---|---|---|---|---|---|
| Labour | Terry Rooney | 17,419 | 49.7 | −6.3 | |
| Conservative | Zahid Iqbal | 8,450 | 24.1 | −1.5 | |
| Liberal Democrat | David Ward | 6,924 | 19.8 | +5.3 | |
| BNP | John Brayshaw | 1,613 | 4.6 | N/A | |
| Green | Steven Schofield | 611 | 1.7 | N/A | |
| Majority | 8,969 | 25.6 | −4.9 | ||
| Turnout | 35,017 | 52.7 | −10.6 | ||
| Labour hold | Swing | −10.6 | |||
| Party | Candidate | Votes | % | ± | |
|---|---|---|---|---|---|
| Labour | Terry Rooney | 14,622 | 42.5 | −7.2 | |
| Liberal Democrat | David Ward | 11,111 | 32.3 | +12.5 | |
| Conservative | Teck Khong | 5,569 | 16.2 | −7.9 | |
| BNP | Lynda Cromie | 2,061 | 6.0 | +1.4 | |
| Green | Steven Schofield | 560 | 1.6 | −0.1 | |
| Respect | Umit Yildiz | 474 | 1.4 | N/A | |
| Majority | 3,511 | 10.2 | −15.4 | ||
| Turnout | 34,397 | 53.3 | 0.6 | ||
| Labour hold | Swing | −9.8 | |||
See also
Notes and references
Craig, F. W. S. (1983). British parliamentary election results 1918-1949 (3 ed.). Chichester: Parliamentary Research Services. ISBN 0-900178-06-X.
- ↑ Leigh Rayment's Historical List of MPs – Constituencies beginning with "B" (part 5)
- ↑ British Parliamentary Election Results 1918-1949, FWS Craig
- ↑ Supported by the Social Credit secretariat
- ↑ Yorkshire Post and Leeds Intelligencer 31 July 1939
- ↑ Kimber, Richard. "UK General Election results 1950". Political Science Resources. Retrieved 13 December 2016.
- ↑
- ↑ Kimber, Richard. "UK General Election results 1951". Political Science Resources. Retrieved 13 December 2016.
- ↑
- ↑ Kimber, Richard. "UK General Election results 1955". Political Science Resources. Retrieved 13 December 2016.
- ↑
- ↑ Kimber, Richard. "UK General Election results 1959". Political Science Resources. Retrieved 13 December 2016.
- ↑
- ↑ Kimber, Richard. "UK General Election results 1964". Political Science Resources. Retrieved 13 December 2016.
- ↑
- ↑ Kimber, Richard. "UK General Election results 1966". Political Science Resources. Retrieved 13 December 2016.
- ↑
- ↑
- ↑ "Election Data 1983". Electoral Calculus. Archived from the original on 15 October 2011. Retrieved 18 October 2015.
- ↑ "Election Data 1987". Electoral Calculus. Archived from the original on 15 October 2011. Retrieved 18 October 2015.
- ↑ "Election Data 1992". Electoral Calculus. Archived from the original on 15 October 2011. Retrieved 18 October 2015.
- ↑ "Politics Resources". Election 1992. Politics Resources. 9 April 1992. Retrieved 6 December 2010.
- ↑ "Election Data 1997". Electoral Calculus. Archived from the original on 15 October 2011. Retrieved 18 October 2015.
- ↑ "Election Data 2001". Electoral Calculus. Archived from the original on 15 October 2011. Retrieved 18 October 2015.
- ↑ "Election Data 2005". Electoral Calculus. Archived from the original on 15 October 2011. Retrieved 18 October 2015.