Mount Royal (electoral district)
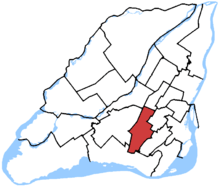 Mount Royal in relation to other federal electoral districts in Montreal and Laval (2013 boundaries) | |||
| Federal electoral district | |||
| Legislature | House of Commons | ||
| MP |
Liberal | ||
| District created | 1924 | ||
| First contested | 1925 | ||
| Last contested | 2015 | ||
| District webpage | profile, map | ||
| Demographics | |||
| Population (2011)[1] | 101,258 | ||
| Electors (2015) | 74,055 | ||
| Area (km²)[2] | 23 | ||
| Pop. density (per km²) | 4,402.5 | ||
| Census divisions | Montreal | ||
| Census subdivisions | Montreal, Côte Saint-Luc, Mount Royal, Hampstead | ||
Mount Royal (French: Mont-Royal) is a federal electoral district in Quebec, Canada, that has been represented in the House of Commons of Canada since 1925. Its population in 2006 was 98,888.
The riding is among the strongest Liberal ridings in the country. Réal Caouette, long-time leader of the Social Credit Party in Quebec, once said that a mailbox could win the Liberal nomination in Mount Royal and still win election just because it was red (the traditional colour of the Liberal Party). The Liberals have held the riding continuously since 1940, and have only been seriously threatened three times since then—in 1958, 1984 and 2011.
Its best-known MP is former Prime Minister Pierre Trudeau, who represented the riding from 1965 to 1984. Its current MP, Anthony Housefather, was elected on 19 October 2015, garnering 50.3% of the vote,[3] and was profiled as one of 10 rookie MPs to watch in the new parliament.[4]
Once the English name of this riding was eliminated in the 2012 electoral redistribution but reversed by the Riding Name Change Act, 2014.
The riding has a large Jewish population, the second largest in Canada—36.3 percent. Mount Royal and Thornhill in Ontario are the only two districts in Canada where Judaism is the most commonly practised religion.
Geography
The district includes the City of Côte Saint-Luc, the Towns of Mount Royal and Hampstead, the neighbourhood of Snowdon and the western part of the neighbourhood of Côte-des-Neiges in the city of Montreal, Quebec.
Demographics
- According to the Canada 2011 Census[5]
Ethnic groups: 62.1% White, 10.8% Filipino, 6.3% Black, 5.5% South Asian, 3.4% Arab, 3.3% Southeast Asian, 2.9% Chinese, 2.1% Latino, 1.2% West Asian, 2.4% Other
Languages: 33.0% English, 23.8% French, 5.4% Tagalog, 4.2% Russian, 3.5% Arabic, 2.9% Spanish, 2.4% Chinese, 2.2% Romanian, 1.9% Tamil, 1.8% Vietnamese, 1.7% Hebrew, 1.7% Yiddish, 1.6% Italian, 1.4% Bengali, 1.2% Greek, 1.2% Persian, 10.1% Other
Religions: 44.4% Christian, 30.7% Jewish, 7.4% Muslim, 2.8% Hindu, 2.1% Buddhist, 0.3% Other, 12.3% None
Median income: $24,313 (2010)
Average income: $48,466 (2010)
- According to the Canada 2016 Census
- 2016 mother tongue languages (top twenty) : 31.5% English, 25.1% French, 5.8% Tagalog. 3.8% Arabic, 3.8% Russian, 2.8% Spanish, 2.2% Farsi, 2.1% Romanian, 1.8% Vietnamese, 1.8% Mandarin, 1.6% Italian, 1.6% Hebrew, 1.5% Tamil, 1.3% Bengali, 1.2% Greek, 1.1% Yiddish, 0.7% Hungarian, 0.7% Cantonese, 0.6% Portuguese, 0.5% Korean, 0.5% Polish, 0.5% Creole languages[6]
History
The electoral district was created in 1924 from Jacques-Cartier and Westmount—Saint-Henri ridings. The electoral district was actually abolished twice since 1924, in 1966 and in 1987; however, the district to replace it kept the same name and incumbent both times.
This riding remained largely intact during the 2012 electoral redistribution, losing a small (uninhabited) territory to Outremont.
Former boundaries
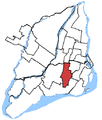 2004 to 2011 election
Members of Parliament
This riding has elected the following Members of Parliament:
| Parliament | Years | Member | Party | |
|---|---|---|---|---|
| Mount Royal Riding created from Jacques-Cartier and Westmount—St. Henri |
||||
| 15th | 1925–1926 | Robert Smeaton White | Conservative | |
| 16th | 1926–1930 | |||
| 17th | 1930–1935 | |||
| 18th | 1935–1940 | William Allen Walsh | ||
| 19th | 1940–1945 | Fred Whitman | Liberal | |
| 20th | 1945–1949 | |||
| 21st | 1949–1953 | Alan Macnaughton | ||
| 22nd | 1953–1957 | |||
| 23rd | 1957–1958 | |||
| 24th | 1958–1962 | |||
| 25th | 1962–1963 | |||
| 26th | 1963–1965 | |||
| 27th | 1965–1968 | Pierre Trudeau | ||
| 28th | 1968–1972 | |||
| 29th | 1972–1974 | |||
| 30th | 1974–1979 | |||
| 31st | 1979–1980 | |||
| 32nd | 1980–1984 | |||
| 33rd | 1984–1988 | Sheila Finestone | ||
| 34th | 1988–1993 | |||
| 35th | 1993–1997 | |||
| 36th | 1997–1999 | |||
| 1999–2000 | Irwin Cotler | |||
| 37th | 2000–2004 | |||
| 38th | 2004–2006 | |||
| 39th | 2006–2008 | |||
| 40th | 2008–2011 | |||
| 41st | 2011–2015 | |||
| 42nd | 2015–Present | Anthony Housefather | ||
Election results
| Canadian federal election, 2015 | ||||||||
|---|---|---|---|---|---|---|---|---|
| Party | Candidate | Votes | % | ±% | Expenditures | |||
| Liberal | Anthony Housefather | 24,187 | 50.34 | +8.93 | $95,380.32 | |||
| Conservative | Robert Libman | 18,201 | 37.88 | +2.27 | $157,866.00 | |||
| New Democratic | Mario Jacinto Rimbao | 3,884 | 8.08 | -9.77 | $8,395.91 | |||
| Bloc Québécois | Jade Bossé-Bélanger | 908 | 1.90 | -1.01 | $198.94 | |||
| Green | Timothy Landry | 747 | 1.55 | -0.20 | – | |||
| Marxist–Leninist | Diane Johnston | 124 | 0.26 | -0.02 | – | |||
| Total valid votes/Expense limit | 48,051 | 100.00 | – | $207,183.11 | ||||
| Total rejected ballots | 425 | 0.88 | – | – | ||||
| Turnout | 48,476 | 65.18 | +7.54 | – | ||||
| Eligible voters | 74,374 | – | – | – | ||||
| Liberal hold | Swing | +6.66 | ||||||
| Source: Elections Canada[7][8] | ||||||||
| Canadian federal election, 2011 | ||||||||
|---|---|---|---|---|---|---|---|---|
| Party | Candidate | Votes | % | ±% | Expenditures | |||
| Liberal | Irwin Cotler | 16,151 | 41.41 | -14.24 | – | |||
| Conservative | Saulie Zajdel | 13,891 | 35.61 | +8.28 | – | |||
| New Democratic | Jeff Itcush | 6,963 | 17.85 | +10.13 | – | |||
| Bloc Québécois | Gabriel Dumais | 1,136 | 2.91 | -1.45 | – | |||
| Green | Brian Sarwer-Foner | 683 | 1.75 | -2.67 | – | |||
| Marxist–Leninist | Diane Johnston | 109 | 0.28 | +0.01 | – | |||
| Independent | Abraham Weizfeld | 74 | 0.19 | – | – | |||
| Total valid votes/Expense limit | 39,007 | 100.00 | – | – | ||||
| Total rejected ballots | 312 | 0.79 | +0.04 | – | ||||
| Turnout | 39,319 | 57.64 | +5.34 | – | ||||
| Canadian federal election, 2008 | ||||||||
|---|---|---|---|---|---|---|---|---|
| Party | Candidate | Votes | % | ±% | Expenditures | |||
| Liberal | Irwin Cotler | 19,702 | 55.65 | -9.90 | $70,302 | |||
| Conservative | Rafael Tzoubari | 9,676 | 27.33 | +9.43 | $63,120 | |||
| New Democratic | Nicolas Thibodeau | 2,733 | 7.72 | +1.02 | $3,089 | |||
| Green | Tyrell Alexander | 1,565 | 4.42 | +0.57 | $600 | |||
| Bloc Québécois | Maryse Lavallée | 1,543 | 4.36 | -1.35 | $6,931 | |||
| Marxist–Leninist | Diane Johnston | 97 | 0.27 | -0.02 | ||||
| Communist | Antonio Artuso | 89 | 0.25 | – | $907 | |||
| Total valid votes/Expense limit | 35,405 | 100.00 | – | $80,838 | ||||
| Total rejected ballots | 268 | 0.75 | +0.06 | – | ||||
| Turnout | 35,673 | 52.30 | -0.51 | – | ||||
| Canadian federal election, 2006 | ||||||||
|---|---|---|---|---|---|---|---|---|
| Party | Candidate | Votes | % | ±% | Expenditures | |||
| Liberal | Irwin Cotler | 24,248 | 65.55 | -10.13 | $66,099 | |||
| Conservative | Neil Martin Drabkin | 6,621 | 17.90 | +9.27 | $41,404 | |||
| New Democratic | Nicolas R. Thibodeau | 2,479 | 6.70 | +1.79 | $2,810 | |||
| Bloc Québécois | Guillaume Dussault | 2,112 | 5.71 | -1.25 | $8,542 | |||
| Green | Damien Pichereau | 1,423 | 3.85 | +1.09 | ||||
| Marxist–Leninist | Diane Johnston | 106 | 0.29 | +0.04 | ||||
| Total valid votes/Expense limit | 36,989 | 100.00 | – | $75,740 | ||||
| Total rejected ballots | 241 | 0.65 | -0.18 | – | ||||
| Turnout | 37,230 | 52.81 | -0.59 | – | ||||
| Canadian federal election, 2004 | ||||||||
|---|---|---|---|---|---|---|---|---|
| Party | Candidate | Votes | % | ±% | Expenditures | |||
| Liberal | Irwin Cotler | 28,670 | 75.68 | -5.56 | $79,191 | |||
| Conservative | Matthew Fireman | 3,271 | 8.63 | -1.02 | $16,501 | |||
| Bloc Québécois | Vincent Gagnon | 2,636 | 6.96 | +2.69 | $5,960 | |||
| New Democratic | Sébastien Beaudet | 1,859 | 4.91 | +2.37 | $2,199 | |||
| Green | Adam Sommerfeld | 1,046 | 2.76 | +1.09 | ||||
| Marijuana | Adam Greenblatt | 308 | 0.81 | – | ||||
| Marxist–Leninist | Diane Johnston | 94 | 0.25 | – | ||||
| Total valid votes/Expense limit | 37,884 | 100.00 | – | $74,792 | ||||
| Total rejected ballots | 317 | 0.83 | – | – | ||||
| Turnout | 38,201 | 53.40 | – | – | ||||
Note: Conservative vote is compared to the total of the Canadian Alliance vote and Progressive Conservative vote in 2000 election.
| Canadian federal election, 2000 | ||||||||
|---|---|---|---|---|---|---|---|---|
| Party | Candidate | Votes | % | ±% | ||||
| Liberal | Irwin Cotler | 33,118 | 81.24 | -10.74 | ||||
| Progressive Conservative | Stephane Gelgoot | 2,489 | 6.11 | +2.34 | ||||
| Bloc Québécois | Jean-Sebastien Houle | 1,740 | 4.27 | +2.03 | ||||
| Alliance | Alex Gabanski | 1,444 | 3.54 | |||||
| New Democratic | Maria Pia Chávez | 1,034 | 2.54 | +0.52 | ||||
| Green | Jean-Claude Balu | 681 | 1.67 | |||||
| Communist | Judith Chafoya | 140 | 0.34 | |||||
| Natural Law | Ena Kahn | 122 | 0.30 | |||||
| Total valid votes | 40,768 | 100.00 | – | |||||
| Canadian federal by-election, 15 November 1999 | ||||||||
|---|---|---|---|---|---|---|---|---|
| Party | Candidate | Votes | % | ±% | ||||
| Resignation of Sheila Finestone, 10 August 1999 | ||||||||
| Liberal | Irwin Cotler | 15,820 | 91.98 | +29.72 | ||||
| Progressive Conservative | Noel Earl Alexander | 648 | 3.77 | -6.58 | ||||
| Bloc Québécois | Mathieu Alarie | 385 | 2.24 | -1.86 | ||||
| New Democratic | Serge Granger | 347 | 2.02 | +0.02 | ||||
| Total valid votes | 17,200 | 100.00 | – | |||||
Note: Canadian Alliance vote is compared to the Reform vote in 1997 election.
| Canadian federal election, 1997 | ||||||||
|---|---|---|---|---|---|---|---|---|
| Party | Candidate | Votes | % | ±% | ||||
| Liberal | Sheila Finestone | 30,115 | 62.26 | -20.68 | ||||
| Independent | Howard Galganov | 10,090 | 20.86 | |||||
| Progressive Conservative | Carolyn Steinman | 5,006 | 10.35 | +4.57 | ||||
| Bloc Québécois | Jacques Thibaudeau | 1,981 | 4.10 | -2.86 | ||||
| New Democratic | Adam Giambrone | 966 | 2.00 | +0.33 | ||||
| Natural Law | Ena Kahn | 211 | 0.44 | -0.21 | ||||
| Total valid votes | 48,369 | 100.00 | – | |||||
| Canadian federal election, 1993 | ||||||||
|---|---|---|---|---|---|---|---|---|
| Party | Candidate | Votes | % | ±% | ||||
| Liberal | Sheila Finestone | 39,598 | 82.94 | +23.09 | ||||
| Bloc Québécois | Guillaume Dumas | 3,324 | 6.96 | |||||
| Progressive Conservative | Neil Drabkin | 2,758 | 5.78 | -26.17 | ||||
| New Democratic | Michael Richard Werbowski | 796 | 1.67 | -3.70 | ||||
| Independent | Harry Polansky | 537 | 1.12 | |||||
| Natural Law | Ken Matthews | 312 | 0.65 | |||||
| National | Kurtis Law | 300 | 0.63 | |||||
| Commonwealth of Canada | Georges Duchesnay | 71 | 0.15 | -0.09 | ||||
| Abolitionist | Marie Vienneau | 47 | 0.10 | |||||
| Total valid votes | 47,743 | 100.00 | – | |||||
| Canadian federal election, 1988 | ||||||||
|---|---|---|---|---|---|---|---|---|
| Party | Candidate | Votes | % | ±% | ||||
| Liberal | Sheila Finestone | 27,354 | 59.85 | +12.38 | ||||
| Progressive Conservative | Robert Presser | 14,601 | 31.95 | -7.14 | ||||
| New Democratic | Tariq Alvi | 2,455 | 5.37 | -4.52 | ||||
| Rhinoceros | Lady Be Ann Poulin | 512 | 1.12 | -0.50 | ||||
| Green | Daniel Reicher | 438 | 0.96 | |||||
| Independent | Barry Goodman | 165 | 0.36 | |||||
| Commonwealth of Canada | Paul G. Fraleigh | 108 | 0.24 | +0.07 | ||||
| Independent | Abe Rosner | 68 | 0.15 | |||||
| Total valid votes | 45,701 | 100.00 | – | |||||
| Canadian federal election, 1984 | ||||||||
|---|---|---|---|---|---|---|---|---|
| Party | Candidate | Votes | % | ±% | ||||
| Liberal | Sheila Finestone | 22,716 | 47.47 | -33.76 | ||||
| Progressive Conservative | Sharon Wolfe | 18,707 | 39.09 | +28.52 | ||||
| New Democratic | Nancy Pearson | 4,735 | 9.89 | +4.23 | ||||
| Rhinoceros | Claude Parachute Racine | 776 | 1.62 | -0.10 | ||||
| Parti nationaliste | André Daoust | 392 | 0.82 | |||||
| Libertarian | Victor Lévis | 338 | 0.71 | +0.41 | ||||
| Independent | Mark Sholzberg | 110 | 0.23 | |||||
| Commonwealth of Canada | Guy R. Huard | 80 | 0.17 | |||||
| Total valid votes | 47,854 | 100.00 | – | |||||
| Canadian federal election, 1980 | ||||||||
|---|---|---|---|---|---|---|---|---|
| Party | Candidate | Votes | % | ±% | ||||
| Liberal | Pierre Trudeau | 33,821 | 81.23 | -3.9 | ||||
| Progressive Conservative | Harry Bloomfield | 4,402 | 10.57 | +3.4 | ||||
| New Democratic | David C. Winch | 2,356 | 5.66 | +1.7 | ||||
| Rhinoceros | Michel Flybin Rivard | 715 | 1.72 | +0.4 | ||||
| Independent | Gordon Edwards | 149 | 0.36 | |||||
| Libertarian | Eddie Paul | 126 | 0.30 | |||||
| Marxist–Leninist | Liz Watkins | 68 | 0.16 | +0.0 | ||||
| Total valid votes | 41,637 | 100.00 | – | |||||
| Canadian federal election, 1979 | ||||||||
|---|---|---|---|---|---|---|---|---|
| Party | Candidate | Votes | % | ±% | ||||
| Liberal | Pierre Trudeau | 43,202 | 85.2 | +10.2 | ||||
| Progressive Conservative | J. David Dejong | 3,660 | 7.2 | -6.1 | ||||
| New Democratic | David C. Winch | 2,023 | 4.0 | -5.8 | ||||
| Social Credit | Laflèche Trudeau | 1,049 | 2.1 | 1.1 | ||||
| Rhinoceros | Jacques Ferron | 649 | 1.3 | |||||
| Communist | David G. Johnston | 81 | 0.2 | |||||
| Marxist–Leninist | Robert Verrier | 61 | 0.1 | -0.3 | ||||
| Total valid votes | 50,725 | 100.0 | – | |||||
| Canadian federal election, 1974 | ||||||||
|---|---|---|---|---|---|---|---|---|
| Party | Candidate | Votes | % | ±% | ||||
| Liberal | Pierre Trudeau | 32,166 | 75.0 | -5.6 | ||||
| Progressive Conservative | Émile Mashaal | 5,723 | 13.3 | +3.6 | ||||
| New Democratic | Joe Rabinovitch | 4,214 | 9.8 | +2.7 | ||||
| Social Credit | Bertrand Marcil | 414 | 1.0 | -0.4 | ||||
| Independent | Edward J. Sommer | 211 | 0.5 | |||||
| Marxist–Leninist | Robert A. Cruise | 162 | 0.4 | +0.2 | ||||
| Total valid votes | 42,890 | 100.0 | – | |||||
| Canadian federal election, 1972 | ||||||||
|---|---|---|---|---|---|---|---|---|
| Party | Candidate | Votes | % | ±% | ||||
| Liberal | Pierre Trudeau | 36,875 | 80.6 | -10.1 | ||||
| Progressive Conservative | Andrew Albert Brichant | 4,446 | 9.7 | +5.0 | ||||
| New Democratic | Harry Yudin | 3,274 | 7.2 | +3.3 | ||||
| Social Credit | Alexander O. Bronstein | 625 | 1.4 | +1.2 | ||||
| Independent | Gaston Miron | 433 | 0.9 | |||||
| Independent | Robert A. Cruise | 80 | 0.2 | |||||
| Total valid votes | 45,733 | 100.0 | – | |||||
Note: Social Credit vote is compared to Ralliement créditiste vote in the 1968 election.
| Canadian federal election, 1968 | ||||||||
|---|---|---|---|---|---|---|---|---|
| Party | Candidate | Votes | % | ±% | ||||
| Liberal | Pierre Trudeau | 37,402 | 90.8 | +35.1 | ||||
| Progressive Conservative | Huguette Marleau | 1,965 | 4.8 | -8.8 | ||||
| New Democratic | Jussy Brainin | 1,583 | 3.8 | -25.8 | ||||
| Independent | Walter Gallagher | 182 | 0.4 | |||||
| Ralliement créditiste | Michel Lamonde | 80 | 0.2 | -1.0 | ||||
| Total valid votes | 41,212 | 100.0 | – | |||||
| Canadian federal election, 1965 | ||||||||
|---|---|---|---|---|---|---|---|---|
| Party | Candidate | Votes | % | ±% | ||||
| Liberal | Pierre Trudeau | 28,064 | 55.6 | -14.7 | ||||
| New Democratic | Charles Taylor | 14,929 | 29.6 | +13.1 | ||||
| Progressive Conservative | Peter S. Wise | 6,840 | 13.6 | +2.9 | ||||
| Ralliement créditiste | Michel Smith | 598 | 1.2 | -1.3 | ||||
| Total valid votes | 50,431 | 100.0 | ||||||
Note: Ralliement créditiste vote is compared to Social Credit vote in the 1963 election.
| Canadian federal election, 1963 | ||||||||
|---|---|---|---|---|---|---|---|---|
| Party | Candidate | Votes | % | ±% | ||||
| Liberal | Alan Macnaughton | 37,648 | 70.4 | +7.3 | ||||
| New Democratic | Charles Taylor | 8,855 | 16.5 | +3.8 | ||||
| Progressive Conservative | Thomas Joseph Coonan | 5,693 | 10.6 | -12.0 | ||||
| Social Credit | Austin G. Gordon | 1,318 | 2.5 | +0.8 | ||||
| Total valid votes | 53,514 | 100.0 | ||||||
| Canadian federal election, 1962 | ||||||||
|---|---|---|---|---|---|---|---|---|
| Party | Candidate | Votes | % | ±% | ||||
| Liberal | Alan Macnaughton | 31,654 | 63.0 | +14.6 | ||||
| Progressive Conservative | Stanley Shenkman | 11,352 | 22.6 | -24.7 | ||||
| New Democratic | Charles Taylor | 6,388 | 12.7 | +8.4 | ||||
| Social Credit | Henri-J. Bernard | 845 | 1.7 | |||||
| Total valid votes | 50,239 | 100.0 | ||||||
Note: NDP vote is compared to CCF vote in 1958 election.
| Canadian federal election, 1958 | ||||||||
|---|---|---|---|---|---|---|---|---|
| Party | Candidate | Votes | % | ±% | ||||
| Liberal | Alan Macnaughton | 22,051 | 48.4 | -12.0 | ||||
| Progressive Conservative | Reginald J. Dawson | 21,562 | 47.3 | +11.4 | ||||
| Co-operative Commonwealth | Harold Atwill | 1,952 | 4.3 | +0.6 | ||||
| Total valid votes | 45,565 | 100.0 | ||||||
| Canadian federal election, 1957 | ||||||||
|---|---|---|---|---|---|---|---|---|
| Party | Candidate | Votes | % | ±% | ||||
| Liberal | Alan Macnaughton | 23,330 | 60.4 | -1.2 | ||||
| Progressive Conservative | George Brown | 13,861 | 35.9 | +2.0 | ||||
| Co-operative Commonwealth | Harold Atwill | 1,420 | 3.7 | +1.9 | ||||
| Total valid votes | 38,611 | 100.0 | ||||||
| Canadian federal election, 1953 | ||||||||
|---|---|---|---|---|---|---|---|---|
| Party | Candidate | Votes | % | ±% | ||||
| Liberal | Alan Macnaughton | 17,183 | 61.7 | -2.2 | ||||
| Progressive Conservative | Dudley Holden Kerr | 9,460 | 33.9 | -0.1 | ||||
| Labor–Progressive | Norman Nerenberg | 727 | 2.6 | |||||
| Co-operative Commonwealth | Ross Worrall | 500 | 1.8 | -0.3 | ||||
| Total valid votes | 27,870 | 100.0 | ||||||
| Canadian federal election, 1949 | ||||||||
|---|---|---|---|---|---|---|---|---|
| Party | Candidate | Votes | % | ±% | ||||
| Liberal | Alan Macnaughton | 21,654 | 63.8 | +17.1 | ||||
| Progressive Conservative | Earle Moore | 11,550 | 34.0 | -5.7 | ||||
| Co-operative Commonwealth | Ross Edward Worrall | 719 | 2.1 | -5.9 | ||||
| Total valid votes | 33,923 | 100.0 | ||||||
| Canadian federal election, 1945 | ||||||||
|---|---|---|---|---|---|---|---|---|
| Party | Candidate | Votes | % | ±% | ||||
| Liberal | Frederick Primrose Whitman | 20,925 | 46.8 | -9.7 | ||||
| Progressive Conservative | St. Clair Holland | 17,798 | 39.8 | +1.9 | ||||
| Co-operative Commonwealth | John Stanley Allen | 3,608 | 8.1 | +2.4 | ||||
| Independent PC | Gilbert Layton | 1,270 | 2.8 | |||||
| Labor–Progressive | Beryl Truax | 1,147 | 2.6 | |||||
| Total valid votes | 44,748 | 100.0 | ||||||
Note: Progressive Conservative vote is compared to "National Government" vote in 1940 election.
| Canadian federal election, 1940 | ||||||||
|---|---|---|---|---|---|---|---|---|
| Party | Candidate | Votes | % | ±% | ||||
| Liberal | Frederick Primrose Whitman | 19,858 | 56.5 | +20.0 | ||||
| National Government | William Allen Walsh | 13,319 | 37.9 | -11.6 | ||||
| Co-operative Commonwealth | John Stanley Allen | 1,983 | 5.6 | +1.1 | ||||
| Total valid votes | 35,160 | 100.0 | ||||||
Note: "National Government" vote is compared to Conservative vote in 1935 election.
| Canadian federal election, 1935 | ||||||||
|---|---|---|---|---|---|---|---|---|
| Party | Candidate | Votes | % | ±% | ||||
| Conservative | William Allen Walsh | 16,203 | 49.4 | -26.0 | ||||
| Liberal | Adam Kirk Cameron | 11,967 | 36.5 | +12.0 | ||||
| Reconstruction | Clifford Henry Cheasley | 2,782 | 8.5 | |||||
| Co-operative Commonwealth | Lloyd B. Almond | 1,473 | 4.5 | |||||
| Independent | Thomas Henry Carveth | 343 | 1.0 | |||||
| Total valid votes | 32,768 | 100.0 | ||||||
| Canadian federal election, 1930 | ||||||||
|---|---|---|---|---|---|---|---|---|
| Party | Candidate | Votes | % | ±% | ||||
| Conservative | Robert Smeaton White | 19,932 | 75.5 | -0.5 | ||||
| Liberal | Octavia Grace Ritchie England | 6,483 | 24.5 | +0.5 | ||||
| Total valid votes | 26,415 | 100.0 | ||||||
| Canadian federal election, 1926 | ||||||||
|---|---|---|---|---|---|---|---|---|
| Party | Candidate | Votes | % | ±% | ||||
| Conservative | Robert Smeaton White | 14,249 | 76.0 | +6.3 | ||||
| Liberal | Thomas Henry Carveth | 4,499 | 24.0 | |||||
| Total valid votes | 18,748 | 100.0 | ||||||
| Canadian federal election, 1925 | ||||||||
|---|---|---|---|---|---|---|---|---|
| Party | Candidate | Votes | % | |||||
| Conservative | Robert Smeaton White | 16,377 | 69.7 | |||||
| Independent Liberal | Robert Louis Calder | 7,129 | 30.3 | |||||
| Total valid votes | 23,506 | 100.0 | ||||||
See also
References
- "(Code 24044) Census Profile". 2011 census. Statistics Canada. 2012. Retrieved 2011-03-07.
- Campaign expense data from Elections Canada
Riding history from the Library of Parliament:
Notes
- ↑ Statistics Canada: 2012
- ↑ Statistics Canada: 2012
- ↑ "Quebec / Mount Royal". Elections Canada. 2015. Retrieved 8 September 2017.
- ↑ "Nearly 200 rookie MPs were elected on Monday. Here's who to watch". National Post. Retrieved 2015-10-22.
- ↑ http://www12.statcan.gc.ca/nhs-enm/2011/dp-pd/prof/details/page.cfm?Lang=E&Geo1=FED2013&Code1=24052&Data=Count&SearchText=mount%20royal&SearchType=Begins&SearchPR=01&A1=All&B1=All&Custom=&TABID=1
- ↑ https://www12.statcan.gc.ca/census-recensement/2016/dp-pd/dt-td/Rp-eng.cfm?LANG=E&APATH=3&DETAIL=0&DIM=0&FL=A&FREE=0&GC=0&GID=0&GK=0&GRP=1&PID=109979&PRID=10&PTYPE=109445&S=0&SHOWALL=0&SUB=888&Temporal=2016,2017&THEME=118&VID=0&VNAMEE=&VNAMEF=
- ↑ Elections Canada – Election Results, 22 October 2015
- ↑ Elections Canada – Preliminary Election Expenses Limits for Candidates
| Parliament of Canada | ||
|---|---|---|
| Preceded by Algoma East |
Riding represented by the Prime Minister 1968–1979 |
Succeeded by Yellowhead |
| Preceded by Yellowhead |
Riding represented by the Prime Minister 1980–1984 |
Succeeded by Vacant; next was Manicouagan, in 1984 |
.png)