List of U.S. states and territories by GDP
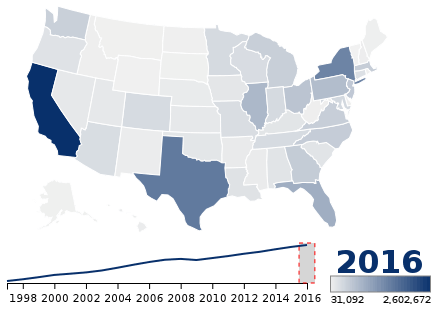
Map of U.S. states by GDP in million U.S. dollars.
This is a list of U.S. states and territories sorted by their gross domestic product (GDP). The United States Bureau of Economic Analysis (BEA) defines GDP by state as "the sum of value added from all industries in the state."[1] Data for the territories is from Worldbank.org.[2][3][4][5][6]
List
Map of U.S.states by Nominal GDP in billions USD
| >$1 trillion $100 bil. - $1 tril. <$100 billion |
| Rank | Rank (50 states) |
State or territory | 2017 | % of Nation | Region |
|---|---|---|---|---|---|
| — | — | 19,263,350[B] | 100.00[B] | ||
| 1 | 1 | 2,746,873 | 14.17 | West | |
| 2 | 2 | 1,696,206 | 8.64 | South | |
| 3 | 3 | 1,547,116 | 8.10 | Northeast | |
| 4 | 4 | 967,337 | 5.00 | South | |
| 5 | 5 | 820,362 | 4.30 | Midwest | |
| 6 | 6 | 752,071 | 3.89 | Northeast | |
| 7 | 7 | 649,127 | 3.39 | Midwest | |
| 8 | 8 | 591,743 | 3.11 | Northeast | |
| 9 | 9 | 554,269 | 2.87 | South | |
| 10 | 10 | 538,291 | 2.82 | South | |
| 11 | 11 | 527,455 | 2.73 | Northeast | |
| 12 | 12 | 508,662 | 2.66 | South | |
| 13 | 13 | 506,353 | 2.58 | West | |
| 14 | 14 | 504,967 | 2.65 | Midwest | |
| 15 | 15 | 393,632 | 2.07 | South | |
| 16 | 16 | 359,122 | 1.88 | Midwest | |
| 17 | 17 | 351,113 | 1.83 | Midwest | |
| 18 | 18 | 345,218 | 1.79 | South | |
| 19 | 19 | 342,748 | 1.74 | West | |
| 20 | 20 | 324,061 | 1.69 | Midwest | |
| 21 | 21 | 319,850 | 1.65 | West | |
| 22 | 22 | 304,898 | 1.62 | Midwest | |
| 23 | 23 | 260,827 | 1.40 | Northeast | |
| 24 | 24 | 246,264 | 1.28 | South | |
| 25 | 25 | 236,219 | 1.24 | West | |
| 26 | 26 | 219,093 | 1.13 | South | |
| 27 | 27 | 210,954 | 1.11 | South | |
| 28 | 28 | 202,507 | 1.06 | South | |
| 29 | 29 | 190,191 | 1.00 | Midwest | |
| 30 | 30 | 189,160 | 0.98 | South | |
| 31 | 31 | 165,526 | 0.85 | West | |
| 32 | 32 | 157,797 | 0.81 | Midwest | |
| 33 | 33 | 156,313 | 0.79 | West | |
| 34 | — | 131,010 | 0.68 | South | |
| 35 | 34 | 124,918 | 0.66 | South | |
| 36 | 35 | 121,774 | 0.63 | Midwest | |
| 37 | 36 | 111,707 | 0.59 | South | |
| 38 | — | 103,135 | 0.55[A] | ||
| 39 | 37 | 97,090 | 0.51 | West | |
| 40 | 38 | 88,136 | 0.46 | West | |
| 41 | 39 | 80,516 | 0.42 | Northeast | |
| 42 | 40 | 76,794 | 0.39 | South | |
| 43 | 41 | 73,541 | 0.39 | South | |
| 44 | 42 | 71,886 | 0.37 | West | |
| 45 | 43 | 61,404 | 0.32 | Northeast | |
| 46 | 44 | 59,458 | 0.31 | Northeast | |
| 47 | 45 | 55,493 | 0.29 | Midwest | |
| 48 | 46 | 52,789 | 0.27 | West | |
| 49 | 47 | 49,928 | 0.26 | Midwest | |
| 50 | 48 | 48,098 | 0.25 | West | |
| 51 | 49 | 40,286 | 0.21 | West | |
| 52 | 50 | 32,197 | 0.17 | Northeast | |
| 53 | — | 5,793 | 0.03[A] | ||
| 54 | — | 3,765 | 0.02[A] | ||
| 55 | — | 1,242 | 0.006[A] | ||
| 56 | — | 658 | 0.003[A] | ||
Notes
- A. ^ Percentage is out of a separate United States GDP total which includes the territories and the District of Columbia (18,626,092 million).
- B. ^ Excludes the U.S. territories.[8] If the territories are included, total is 18,626,092 million. Percentages for states are based on 18,511,499 number.
See also
- List of sovereign states in Europe by GDP (nominal)
- Comparison between U.S. states and countries by GDP (nominal)
- Comparison between U.S. states and countries by GDP (PPP)
- List of country subdivisions by GDP over USD 100 billions
- List of U.S. states by economic growth rate
- List of U.S. state economies
- List of cities by GDP
- List of U.S. states by GDP per capita
- List of U.S. metropolitan areas by GDP
- STATS America state-level rankings
References
- ↑ "BEA Glossary". Bureau of Economic Analysis. U.S. Department of Commerce. Retrieved 8 June 2017.
- ↑ https://data.worldbank.org/country/American-Samoa Worldbank.org. American Samoa. Retrieved 3 January 2018.
- ↑ https://data.worldbank.org/country/Virgin-Islands-US Worldbank.org. Virgin Islands (U.S.). Retrieved 3 January 2018.
- ↑ https://data.worldbank.org/country/Northern-Mariana-Islands Worldbank.org. Northern Mariana Islands. Retrieved 3 January 2018.
- ↑ https://data.worldbank.org/country/Guam Worldbank.org. Guam. Retrieved 3 January 2018.
- ↑ https://data.worldbank.org/country/Puerto-Rico Worldbank.org. Puerto Rico. Retrieved 3 January 2018.
- ↑ "Gross domestic product (GDP) by state (millions of current dollars)". Bureau of Economic Analysis. Retrieved 8 December 2017.
- ↑ https://www.bea.gov/faq/index.cfm?faq_id=1188&searchQuery= BEA.gov. Frequently Asked Questions: Are Puerto Rico and the U.S. Territories included in the estimates of U.S. GDP? Retrieved 3 January 2018.
| Demographics | |
|---|---|
| Economy | |
| Environment | |
| Geography | |
| Government |
|
| Health | |
| History | |
| Law | |
| Miscellaneous | |
| |
This article is issued from
Wikipedia.
The text is licensed under Creative Commons - Attribution - Sharealike.
Additional terms may apply for the media files.