List of U.S. states by Gini coefficient
| This article is part of a series on |
| Income in the United States of America |
|---|
 |
|
Lists by income |
|
|
The Gini coefficient is a measure of inequality of incomes (or sometimes wealth) across individuals.
A score of "0" on the Gini coefficient represents complete equality, i.e., every person has the same income. A score of 1 would represent complete inequality, i.e., where one person has all the income and others have none. Therefore, a lower Gini score is roughly associated with a more equal distribution of income, and vice versa.
The information was tabulated in 2010 from data from the American Community Survey conducted by the US Census Bureau. Utah, Alaska, and Wyoming show the smallest income disparities while the District of Columbia, New York State, and Connecticut have the largest disparities in income between wage earners in all income categories.[1]
U.S. income inequality was at its highest level since the United States Census Bureau began tracking household income in 1967. The U.S. also has the greatest disparity among western industrialized nations.[1]
List of U.S. states by Gini coefficient of income inequality
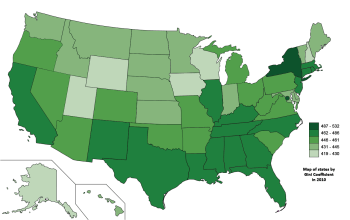
Legend:
|
487–532
462–486
446–461
|
431–445
419–430
|
The list goes from lowest Gini coefficient to the highest. The Gini index for the United States as a whole is 0.486.
| Rank | State | Gini Coefficient |
|---|---|---|
| 1 | Utah | 0.4063 |
| 2 | Alaska | 0.4081 |
| 3 | Wyoming | 0.4360 |
| 4 | New Hampshire | 0.4304 |
| 5 | Iowa | 0.4451 |
| 6 | Wisconsin | 0.4498 |
| 7 | Nebraska | 0.4477 |
| 8 | Hawaii | 0.4420 |
| 8 | Idaho | 0.4503 |
| 8 | North Dakota | 0.4533 |
| 11 | Montana | 0.4667 |
| 12 | Maine | 0.4519 |
| 13 | Delaware | 0.4522 |
| 14 | Indiana | 0.4527 |
| 15 | Minnesota | 0.4496 |
| 16 | Washington | 0.4591 |
| 17 | South Dakota | 0.4495 |
| 18 | Maryland | 0.4499 |
| 19 | Vermont | 0.4539 |
| 20 | Kansas | 0.4550 |
| 21 | Nevada | 0.4577 |
| 22 | Oregon | 0.4583 |
| 23 | Michigan | 0.4695 |
| 23 | West Virginia | 0.4711 |
| 25 | Ohio | 0.4680 |
| 26 | Oklahoma | 0.4645 |
| 27 | Arizona | 0.4713 |
| 27 | Missouri | 0.4646 |
| 29 | Colorado | 0.4586 |
| 30 | Arkansas | 0.4719 |
| 31 | Virginia | 0.4705 |
| 32 | Pennsylvania | 0.4689 |
| 32 | South Carolina | 0.4735 |
| 34 | New Jersey | 0.4813 |
| 34 | New Mexico | 0.4769 |
| 34 | North Carolina | 0.4780 |
| 37 | Illinois | 0.4810 |
| 38 | Kentucky | 0.4813 |
| 39 | Rhode Island | 0.4781 |
| 40 | Georgia | 0.4813 |
| 40 | Mississippi | 0.4828 |
| 40 | Tennessee | 0.4790 |
| 43 | Texas | 0.4800 |
| 44 | California | 0.4899 |
| 45 | Alabama | 0.4847 |
| 46 | Florida | 0.4852 |
| 47 | Louisiana | 0.4990 |
| 47 | Massachusetts | 0.4786 |
| 49 | Connecticut | 0.4945 |
| 50 | New York | 0.5229 |
| 51 | District of Columbia | 0.5420 |
See also
Notes
- 1 2 "Census data: Weddings in 2009 at record low level". Associated Pressdate=. Retrieved 2011-02-08.
A different measure, the international Gini index, found U.S. income inequality at its highest level since the Census Bureau began tracking household income in 1967. The U.S. also has the greatest disparity among Western industrialized nations. ... Three states - New York, Connecticut and Texas – and the District of Columbia had the largest gaps in rich and poor, disparities that exceeded the national average. Similar income gaps were evident in large cities such as New York, Miami, Los Angeles, Boston and Atlanta, home to both highly paid financial and high-tech jobs as well as clusters of poorer immigrant and minority residents. On the other end of the scale, Alaska, Utah, Wyoming, Idaho and Hawaii had the smallest income gaps.
References
- - Gini index by state for households
- - Gini index for US as tabulated in the 2010 American Community Survey
- U.S. Census Bureau - Gini index as tabulated in the 2009 American Community Survey
External links
| Demographics | |
|---|---|
| Economy | |
| Environment | |
| Geography | |
| Government |
|
| Health | |
| History | |
| Law | |
| Miscellaneous | |
| |