List of Canadian provinces and territories by gross domestic product
This article lists Canadian provinces and territories by gross domestic product (GDP).
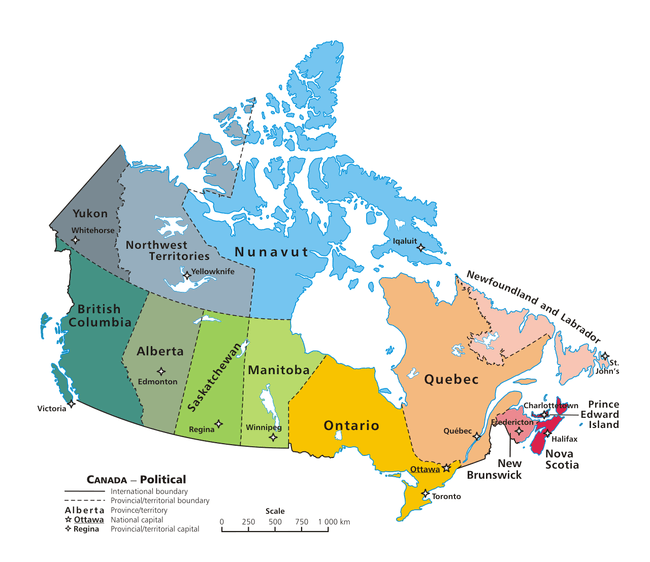
While Canada’s ten provinces and three territories exhibit high per capita GDPs, there is wide variation among them. Ontario, the country's most populous province, is a manufacturing and trade locus with extensive linkages to the northeastern and midwestern United States. The economies of Alberta, Saskatchewan, Newfoundland and the territories rely heavily on natural resources and produce the highest per capita GDP values in the country. On the other hand, Manitoba, Quebec and The Maritimes have the country's lowest per capita GDP values.
In the face of these long-term regional disparities, the Government of Canada redistributes some of its revenues through unconditional equalization payments and finances the delivery of comparable levels of government services through the Canada Health Transfer and the Canada Social Transfer.
GDP and per capita GDP
A table listing total GDP (expenditure-based), share of Canadian GDP, population, and per capita GDP. For illustrative purposes, market income (total income less government transfers) per capita from tax returns is included. (The per capita, rather than per taxfiler, measure is chosen for comparability with GDP per capita.)
| Province or Territory |
GDP (million CAD, 2016) |
Share of national GDP (%, 2016) |
Population (2016) |
GDP per capita (CAD, 2016) |
Market Income per capita (CAD, 2016) |
|---|---|---|---|---|---|
| 2,035,506 | 100 | 36,264,604 | 56,129 | 31,737 | |
| 263,706 | 12.96 | 4,757,658 | 55,428 | 32,451 | |
| 314,944 | 15.47 | 4,236,376 | 74,343 | 37,905 | |
| 75,261 | 3.70 | 1,148,588 | 65,525 | 31,049 | |
| 67,863 | 3.33 | 1,318,115 | 51,485 | 27,831 | |
| 794,835 | 39.05 | 13,976,320 | 56,870 | 32,673 | |
| 394,819 | 19.40 | 8,321,888 | 47,443 | 28,580 | |
| 34,224 | 1.68 | 757,384 | 45,187 | 26,177 | |
| 6,321 | 0.31 | 149,472 | 42,289 | 25,807 | |
| 41,726 | 2.05 | 948,618 | 43,986 | 27,623 | |
| 31,112 | 1.53 | 530,305 | 58,668 | 29,480 | |
| 2,800 | 0.14 | 38,086 | 73,518 | 38,233 | |
| 4,739 | 0.23 | 44,617 | 106,215 | 40,496 | |
| 2,443 | 0.12 | 37,177 | 65,713 | 25,856 |
Source: Statistics Canada: GDP (totals),[1] Population,[2] Total income and government transfers,[3] Population covered by income data[4]
International comparisons
The table below uses the International Monetary Fund's estimate for Canada's GDP by purchasing power parity in United States dollars. Provincial figures are computed proportionally, and per capita figures are obtained through division by the population numbers in the previous table. The national economy with the closest figure for the relevant year according to the International Monetary Fund is then indicated.
(Note that because the same conversion rate is used for all of Canada, this method overstates the GDP PPP of provinces and territories with high price levels, and understates the GDP PPP of provinces and territories with low price levels.)
| Province or Territory |
GDP PPP (million USD, 2016) |
Comparable economy by GDP PPP |
GDP per capita PPP (USD, 2016) |
Comparable economy by GDP PPP per capita |
|---|---|---|---|---|
| 1,687,364 | | 46,529 | | |
| 658,891 | 47,143 | |||
| 327,291 | 39,329 | |||
| 261,078 | 61,628 | |||
| 218,603 | 45,948 | |||
| 62,389 | 54,318 | |||
| 56,256 | 42,679 | |||
| 34,589 | 36,463 | |||
| 28,371 | 37,459 | |||
| 25,791 | 48,634 | |||
| 5,240 | 35,056 | |||
| 3,928 | 88,049 | |||
| 2,321 | 60,944 | |||
| 2,025 | 54,474 |
Source: International Monetary Fund[5]
Components of GDP
A table of Canadian provinces and territories by descending GDP (at current prices and expenditure-based); all figures are from Statistics Canada. [6]
| Province or Territory |
GDP (million CAD, 2014) |
= Final Consumption Expenditure |
+ Gross Capital Formation |
+ Investment in Inventories |
+ Exports | − Imports |
|---|---|---|---|---|---|---|
| 1,973,043 | 1,513,043 | 469,739 | 8,488 | 1,005,446 | 1,024,061 | |
| 237,188 | 202,405 | 56,081 | 1,747 | 93,215 | 116,444 | |
| 375,756 | 198,643 | 132,709 | 1,876 | 206,923 | 164,444 | |
| 82,780 | 50,046 | 26,100 | −2,316 | 58,328 | 49,340 | |
| 64,077 | 55,129 | 15,663 | −385 | 35,992 | 42,256 | |
| 721,970 | 576,173 | 135,610 | 5,234 | 370,845 | 365,804 | |
| 370,064 | 315,396 | 74,182 | 2,110 | 171,350 | 193,352 | |
| 32,056 | 31,898 | 5,391 | 1 | 25,792 | 31,015 | |
| 6,003 | 6,106 | 989 | 56 | 2,729 | 3,877 | |
| 39,077 | 42,981 | 7,465 | 25 | 15,377 | 26,756 | |
| 33,514 | 23,786 | 11,853 | −68 | 19,787 | 21,855 | |
| 2,603 | 2,783 | 814 | 4 | 802 | 1,791 | |
| 4,731 | 3,705 | 1,485 | 83 | 3,392 | 3,929 | |
| 2,487 | 2,473 | 1,293 | 122 | 910 | 2,301 |
Figures may not add up precisely due to omission of the statistical discrepancy column and the "Outside Canada" row.
See also
Notes
- ↑ Canada, Government of Canada, Statistics. "CANSIM - 384-0038 - Gross domestic product, expenditure-based, provincial and territorial". www5.statcan.gc.ca. Retrieved 2016-12-27.
- ↑ Canada, Government of Canada, Statistics. "CANSIM - 051-0001 - Estimates of population, by age group and sex for July 1, Canada, provinces and territories". www5.statcan.gc.ca. Retrieved 2017-09-28.
- ↑ Canada, Government of Canada, Statistics. "Tax filers and dependants with income by source of income". www150.statcan.gc.ca. Retrieved 2018-07-12.
- ↑ Canada, Government of Canada, Statistics. "Selected characteristics of tax filers and dependants, income and demographics (final T1 Family File)". www150.statcan.gc.ca. Retrieved 2018-07-12.
- ↑ "World Economic Outlook Database, April 2018". www.imf.org. Retrieved 2018-04-19.
- ↑ "Table 384-0038 - Gross domestic product, expenditure-based, provincial and territorial, annual (dollars unless otherwise noted), CANSIM (database)". Statistics Canada. 2012-11-26.
References
| Ranked | |
|---|---|
| Political | |
| Historical | |
| Other | |