List of German states by GRP per capita
This article is about the gross regional product (GRP) per capita of German states in nominal values.[1] Values are shown in EUR€. For easy comparison, all the GRP figures are converted into US$ according to annual average exchange rates.[2][n 1] All values are rounded to the nearest hundred.
2017
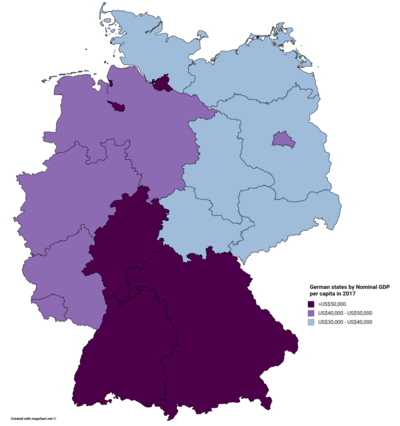
German states by Nominal GRP per capita in 2017
| State | Rank | GRP per capita (EUR€)[3] | GRP per capita (US$) | Comparable countries[4] |
|---|---|---|---|---|
| — | 39,500 | 47,600 | ||
| 1 | 64,600 | 73,100 | ||
| 2 | 49,600 | 56,000 | ||
| 3 | 45,800 | 51,800 | ||
| 4 | 44,900 | 50,700 | ||
| 5 | 44,800 | 50,600 | ||
| 6 | 38,600 | 43,700 | ||
| 7 | 38,000 | 43,000 | ||
| 8 | 36,200 | 40,900 | ||
| 9 | 35,500 | 40,100 | ||
| 10 | 35,500 | 40,100 | ||
| 11 | 32,300 | 36,500 | ||
| 12 | 29,900 | 33,700 | ||
| 13 | 28,800 | 32,600 | ||
| 14 | 27,700 | 31,300 | ||
| 15 | 27,200 | 30,700 | ||
| 16 | 26,600 | 30,000 | ||
2016
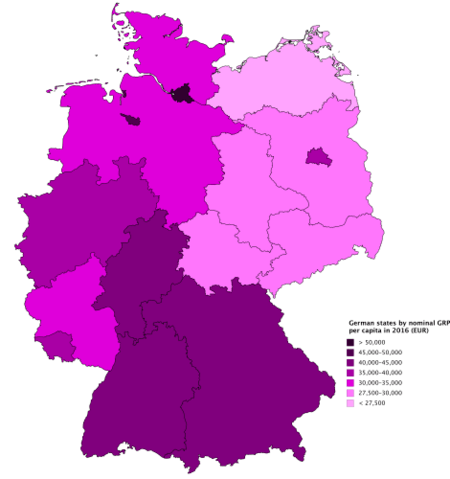
German states by nominal GRP per capita in 2016
| State | Rank | GRP per capita (EUR€) | GRP per capita (US$) |
|---|---|---|---|
| — | 38,200 | 42,300 | |
| 1 | 61,800 | 68,400 | |
| 2 | 47,900 | 53,000 | |
| 3 | 44,200 | 48,900 | |
| 4 | 43,800 | 48,500 | |
| 5 | 43,800 | 48,500 | |
| 6 | 37,600 | 41,600 | |
| 7 | 36,600 | 40,500 | |
| 8 | 35,300 | 39,100 | |
| 9 | 34,500 | 38,200 | |
| 10 | 33,300 | 36,800 | |
| 11 | 31,100 | 34,400 | |
| 12 | 29,200 | 32,300 | |
| 13 | 28,300 | 31,300 | |
| 14 | 27,600 | 30,500 | |
| 15 | 26,600 | 29,400 | |
| 16 | 25,800 | 28,500 | |
See also
Notes
- ↑ Euro figures are converted to GBP and USD rates as of 31 December of a given year.
References
- ↑ "Regional GDP in the European Union, 2016". ec.europa.eu. Retrieved 21 May 2018.
- ↑ "Yearly Average Rates & Forex History Data". OFX. Retrieved 21 May 2018.
- ↑ https://www.statistik-bw.de/VGRdL/tbls/tab.jsp?rev=RV2014&tbl=tab01&lang=de-DE#tab01
- ↑ World Economic Outlook Database, April 2018, International Monetary Fund. Accessed on 17 April 2018.
This article is issued from
Wikipedia.
The text is licensed under Creative Commons - Attribution - Sharealike.
Additional terms may apply for the media files.