List of countries by GDP sector composition
This is a list of countries by gross domestic product (GDP) sector composition.
Methodology
The figures are based on nominal GDP and GDP (PPP) estimates and sector composition ratios provided by the CIA World Factbook at market or government official exchange rates with figures in trillions of United States dollars.
- Agricultural (or primary) sector
- Agriculture (a term which encompasses farming) is the process of producing food, feed, fiber and other goods by the systematic raising of plants and animals. Agricultural output is a component of the GDP of a nation.
- Industrial (or secondary) sector
- Industry is the segment of economy concerned with production of goods (including fuels and fertilisers). Industrial output is a component of the GDP of a nation.
- Service (or tertiary) sector
- A service is the non-material equivalent of a good. Service provision is defined as an economic activity that does not result in ownership, and this is what differentiates it from providing physical goods. It is claimed to be a process that creates benefits by facilitating either a change in customers, a change in their physical possessions, or a change in their intangible assets. Service output is a component of the GDP of a nation. The service sector includes (but is not limited to) farm and factory related activities.
By economic sector
Nominal GDP sector composition
Nominal GDP sector composition, 2017 (in percentage and in billions of dollars):[1][2]
| No. | Country | Total GDP (billions of US$) |
Agri. % | Indus. % | Service % | Agri. B$ | Indus. B$ | Service B$ |
|---|---|---|---|---|---|---|---|---|
| 1 | 19362 | 0.90% | 18.90% | 80.20% | 174.26 | 3659.44 | 15528.40 | |
| 2 | 11938 | 8.20% | 39.50% | 52.20% | 978.88 | 4715.35 | 6231.43 | |
| 3 | 4884.5 | 1.00% | 29.70% | 69.30% | 48.85 | 1450.70 | 3384.96 | |
| 4 | 3651.9 | 0.60% | 30.10% | 69.30% | 21.91 | 1099.22 | 2530.77 | |
| 5 | 2574.8 | 1.60% | 19.40% | 78.90% | 41.20 | 499.51 | 2031.52 | |
| 6 | 2565.1 | 0.60% | 19.00% | 80.40% | 15.39 | 487.37 | 2062.34 | |
| 7 | 2439 | 16.80% | 28.90% | 46.60% | 409.75 | 704.87 | 1136.57 | |
| 8 | 2080.9 | 6.20% | 21.00% | 72.80% | 129.02 | 436.99 | 1514.90 | |
| 9 | 1921.1 | 2.10% | 24.00% | 73.90% | 40.34 | 461.06 | 1419.69 | |
| 10 | 1640.4 | 1.70% | 28.10% | 70.20% | 27.89 | 460.95 | 1151.56 | |
| 11 | 1529.7 | 2.20% | 38.80% | 59.10% | 33.65 | 593.52 | 904.05 | |
| 12 | 1469.3 | 4.70% | 32.40% | 62.30% | 69.06 | 476.05 | 915.37 | |
| 13 | 1390.2 | 3.60% | 26.10% | 70.30% | 50.05 | 362.84 | 977.31 | |
| 14 | 1307.2 | 2.60% | 23.20% | 74.20% | 33.99 | 303.27 | 969.94 | |
| 15 | 1142.5 | 3.90% | 31.60% | 64.00% | 44.56 | 361.03 | 731.20 | |
| 16 | 1010.9 | 13.90% | 40.30% | 45.90% | 140.52 | 407.39 | 464.00 | |
| 17 | 841.2 | 6.70% | 31.80% | 61.40% | 56.36 | 267.50 | 516.50 | |
| 18 | 824.5 | 1.60% | 17.90% | 70.20% | 13.19 | 147.59 | 578.80 | |
| 19 | 680.6 | 0.70% | 25.60% | 73.70% | 4.76 | 174.23 | 501.60 | |
| 20 | 678.5 | 2.60% | 44.20% | 53.20% | 17.64 | 299.90 | 360.96 | |
| 21 | 619.9 | 10.90% | 28.20% | 60.90% | 67.57 | 174.81 | 377.52 | |
| 22 | 571.5 | 1.80% | 36.00% | 62.10% | 10.29 | 205.74 | 354.90 | |
| 23 | 541.9 | 1.60% | 33.00% | 65.40% | 8.67 | 178.83 | 354.40 | |
| 24 | 510 | 2.40% | 40.20% | 64.30% | 12.24 | 205.02 | 327.93 | |
| 25 | 491.7 | 0.70% | 21.80% | 77.50% | 3.44 | 107.19 | 381.07 | |
| 26 | 437.8 | 8.20% | 36.20% | 55.60% | 35.90 | 158.48 | 243.42 | |
| 27 | 427.7 | - | - | - | - | - | - | |
| 28 | 409.3 | 1.20% | 28.20% | 70.50% | 4.91 | 115.42 | 288.56 | |
| 29 | 394.8 | 21.60% | 18.30% | 60.10% | 85.28 | 72.25 | 237.27 | |
| 30 | 392.1 | 2.40% | 31.10% | 66.50% | 9.41 | 121.94 | 260.75 | |
| 31 | 378.7 | 0.90% | 49.80% | 49.20% | 3.41 | 188.59 | 186.32 | |
| 32 | 348 | 2.30% | 26.60% | 69.50% | 8.00 | 92.57 | 241.86 | |
| 33 | 344.1 | 2.80% | 29.70% | 67.50% | 9.63 | 102.20 | 232.27 | |
| 34 | 334.1 | 0.10% | 7.20% | 92.70% | 0.33 | 24.06 | 309.71 | |
| 35 | 325.6 | 1.00% | 38.20% | 60.70% | 3.26 | 124.38 | 197.64 | |
| 36 | 324.1 | 1.10% | 23.70% | 75.20% | 3.57 | 76.81 | 243.72 | |
| 37 | 321.2 | 9.40% | 30.80% | 59.80% | 30.19 | 98.93 | 192.08 | |
| 38 | 309.9 | 8.40% | 36.90% | 54.70% | 26.03 | 114.35 | 169.52 | |
| 39 | 307.5 | 7.40% | 31.30% | 61.40% | 22.76 | 96.25 | 188.81 | |
| 40 | 305.8 | 0.00% | 26.00% | 74.00% | 0.00 | 79.51 | 226.29 | |
| 41 | 263.2 | 4.40% | 31.40% | 64.30% | 11.58 | 82.64 | 169.24 | |
| 42 | 251.5 | 2.60% | 27.20% | 70.20% | 6.54 | 68.41 | 176.55 | |
| 43 | 250 | 14.20% | 29.20% | 56.50% | 35.50 | 73.00 | 141.25 |
Nominal GDP sector composition, 2015 (in percentage and in millions of dollars):[1]
| № | Country/Economy | Total GDP (US$MM) |
Agri. | Indus. | Serv. | Agri. | Indus. | Serv. |
|---|---|---|---|---|---|---|---|---|
| – | World | 75,212,696 | 5.9% | 30.5% | 63.6% | 4,437,549 | 22,939,872 | 47,835,275 |
| 1 | 17,946,996 | 1.12% | 19.1% | 79.7% | 215,364 | 3,427,876 | 14,303,756 | |
| 2 | 12,218,281 | 6.9% | 40.1% | 52.9% | 843,061 | 4,899,531 | 6,463,471 | |
| 3 | 4,730,300 | 1.2% | 27.5% | 71.4% | 56,764 | 1,300,833 | 3,377,434 | |
| 4 | 3,494,900 | 0.8% | 28.1% | 71.1% | 27,959 | 982,067 | 2,484,874 | |
| 5 | 2,649,890 | 0.7% | 21% | 78.3% | 18,549 | 556,477 | 2,074,864 | |
| 6 | 2,488,280 | 1.9% | 18.3% | 79.8% | 47,277 | 455,355 | 1,985,647 | |
| 7 | 2,250,990 | 17.4% | 25.8% | 56.9% | 391,672 | 580,755 | 1,280,813 | |
| 8 | 1,852,500 | 2% | 24.2% | 73.8% | 37,050 | 448,305 | 1,367,145 | |
| 9 | 1,769,600 | 5.4% | 27.4% | 67.2% | 95,558 | 484,870 | 1,189,171 | |
| 10 | 1,532,340 | 1.8% | 28.6% | 69.6% | 27,582 | 438,249 | 1,066,509 | |
| 11 | 1,404,380 | 2.7% | 39.8% | 57.5% | 37,918 | 558,943 | 807,519 | |
| 12 | 1,267,750 | 3.9% | 36% | 60.1% | 49,442 | 456,390 | 761,918 | |
| 13 | 1,256,640 | 4% | 26.6% | 69.4% | 50,266 | 334,266 | 872,108 | |
| 14 | 1,252,160 | 3.3% | 24.2% | 72.6% | 41,321 | 303,023 | 909,068 | |
| 15 | 1,063,610 | 3.7% | 34.2% | 62.1% | 39,354 | 363,755 | 660,502 | |
| 16 | 940,953 | 14.3% | 46.9% | 38.8% | 134,556 | 441,307 | 365,090 | |
| 17 | 769,930 | 2.8% | 24.1% | 73.2% | 21,558 | 185,553 | 563,589 | |
| 18 | 755,716 | 8.9% | 28.1% | 63% | 67,259 | 212,356 | 476,101 | |
| 19 | 662,483 | 1.3% | 27.7% | 71% | 8,612 | 183,508 | 470,363 | |
| 20 | 657,785 | 2% | 66.9% | 31.1% | 13,156 | 440,058 | 204,571 | |
| 21 | 541,784 | 10% | 30.7% | 59.2% | 54,178 | 166,328 | 320,736 | |
| 22 | 519,149 | 1.3% | 32% | 66.9% | 6,749 | 166,128 | 347,311 | |
| 23 | 517,440 | 1.8% | 26.9% | 71.3% | 9,314 | 139,191 | 368,935 | |
| 24 | 470,179 | 0.7% | 21.6% | 77.7% | 3,291 | 101,559 | 365,329 | |
| 25 | 467,350 | 3.4% | 33.6% | 63% | 15,890 | 157,030 | 294,431 | |
| 26 | 416,444 | 0.7% | 59.4% | 39.8% | 2,915 | 247,368 | 165,745 | |
| 27 | 415,080 | 17.8% | 25.7% | 54.6% | 73,884 | 106,676 | 226,634[3] | |
| 28 | 412,340 | 11.2% | 40.6% | 48.2% | 46,182 | 167,410 | 198,748 | |
| 29 | 400,117 | 8.9% | 38% | 53.1% | 35,610 | 152,044 | 212,462 | |
| 30 | 390,592 | 13.3% | 34% | 52.7% | 51,949 | 132,801 | 205,842 | |
| 31 | 387,299 | 1.5% | 29.5% | 69% | 5,809 | 114,253 | 267,236 | |
| 32 | 376,268 | 2.7% | 38.3% | 59% | 10,159 | 144,111 | 221,998 | |
| 33 | 347,196 | 4.5% | 19.1% | 76.4% | 15,624 | 66,314 | 265,258 | |
| 34 | 341,216 | 2.5% | 31.6% | 65.9% | 8,530 | 107,824 | 224,861 | |
| 35 | 246,397 | 3.3% | 17.9% | 78.9% | 8,131 | 44,105 | 194,407 | |
| 36 | 209,226 | 4.7% | 34.9% | 60.4% | 9,834 | 73,020 | 126,373 | |
Nominal GDP sector composition (2005 Constant Prices)
Nominal GDP sector composition, 2015 (in millions of 2005 USD):[4][5] 2005 Prices are used similarly to 2010 Constant prices in which they provide economic stats where inflation is accounted for.
| № | Country/Economy | Real gross domestic product | Agri. | Indus. | Serv. |
|---|---|---|---|---|---|
| – | World | 60,093,221 | 1,968,215 | 16,453,140 | 38,396,695 |
| 1 | 15,160,104 | 149,023 | 3,042,332 | 11,518,980 | |
| 2 | 5,762,185 | 418,455 | 2,837,667 | 2,467,184 | |
| 3 | 5,018,510 | 59,296 | 1,415,551 | 3,502,804 | |
| 4 | 3,291,225 | 15,946 | 889,336 | 2,064,936 | |
| 5 | 2,821,007 | 15,482 | 468,181 | 2,032,516 | |
| 6 | 2,406,570 | 39,823 | 415,400 | 1,727,659 | |
| 7 | 1,766,169 | 38,145 | 369,751 | 1,196,180 | |
| 8 | 1,677,339 | 196,592 | 499,519 | 849,240 | |
| 9 | 1,377,908 | 22,761 | 370,732 | 896,605 | |
| 10 | 1,130,906 | 59,977 | 267,769 | 655,172 | |
GDP from natural resources
- Source: World Development Indicators: Contribution of natural resources to gross domestic product (2011)
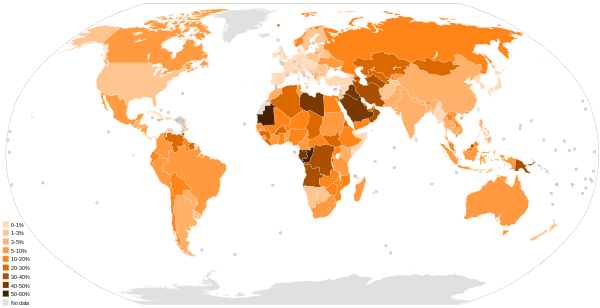
Total natural resources rents (% of GDP) by country, 2013
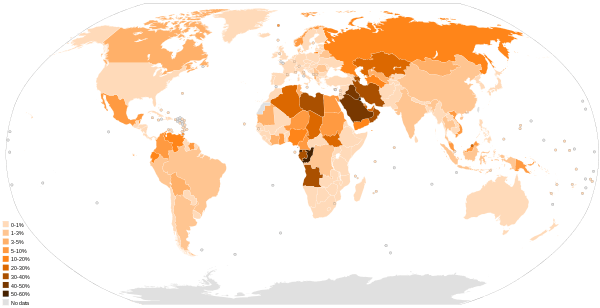
Oil rents (% of GDP) by country, 2013
| Country/Economy | Total natural resources (% of GDP) | Oil (% of GDP) | Natural gas (% of GDP) | Coal (% of GDP) | Mineral (% of GDP) | Forest (% of GDP) |
|---|---|---|---|---|---|---|
| 2.1 | .. | .. | 0 | 0 | 2.1 | |
| 5.1 | 4.6 | 0 | 0 | 0.5 | 0.1 | |
| 26.3 | 19 | 7 | 0 | 0.3 | 0.1 | |
| 46.6 | 46.3 | 0.1 | .. | 0 | 0.2 | |
| 0 | .. | .. | .. | 0 | .. | |
| 6.1 | 4.1 | 1.2 | 0 | 0.8 | 0.1 | |
| 2.7 | .. | .. | .. | 2.7 | 0 | |
| 10.7 | 0.8 | 0.7 | 1.9 | 7.2 | 0.1 | |
| 0.4 | 0.1 | 0 | 0 | 0.1 | 0.1 | |
| 45.1 | 41.9 | 3.1 | .. | 0.1 | 0 | |
| 0 | .. | .. | .. | 0 | 0 | |
| 3.4 | .. | 2.8 | 0.1 | 0 | 0.5 | |
| 0 | .. | .. | .. | 0 | .. | |
| 2.4 | 1.8 | 0 | .. | 0 | 0.5 | |
| 0 | .. | .. | 0 | 0 | 0 | |
| 0.3 | .. | .. | .. | 0 | 0.3 | |
| 1.7 | .. | .. | .. | 0 | 1.6 | |
| 8.4 | .. | .. | 0 | 0 | 8.4 | |
| 20.6 | 5.4 | 8.6 | .. | 6.3 | 0.3 | |
| 4.5 | .. | .. | 3.1 | 0.8 | 0.6 | |
| 4.7 | .. | .. | 0.4 | 4.2 | 0.1 | |
| 5.7 | 2.6 | 0.1 | 0 | 2.8 | 0.3 | |
| 41 | 28.5 | 12.5 | .. | 0 | 0.1 | |
| 3.9 | 0 | 0.1 | 1.6 | 2 | 0.3 | |
| 11.8 | .. | .. | .. | 9.1 | 2.7 | |
| 10.3 | .. | .. | .. | 1.2 | 9 | |
| 1.3 | .. | .. | .. | 0 | 1.3 | |
| 9.8 | 8 | 0.2 | 0 | 0.2 | 1.5 | |
| 5.1 | 3.2 | 0.2 | 0.2 | 1 | 0.5 | |
| 0.1 | .. | .. | .. | 0 | 0.1 | |
| 5.1 | .. | .. | .. | 0.1 | 5 | |
| 38.4 | 36.8 | .. | .. | 0 | 1.6 | |
| 19.2 | 0.1 | 0.1 | 0 | 18.6 | 0.4 | |
| 9.1 | 1.6 | 0.1 | 4.4 | 2.8 | 0.2 | |
| 0 | .. | .. | .. | 0 | 0 | |
| 0 | .. | .. | .. | 0 | .. | |
| 12.1 | 8.8 | 0.4 | 1.8 | 1 | 0.1 | |
| 1.1 | .. | .. | .. | 0 | 1.1 | |
| 35.2 | 4.4 | 0 | 0.1 | 22 | 8.8 | |
| 73.7 | 71.5 | 0 | .. | 0 | 2.1 | |
| 0.3 | .. | .. | .. | 0 | 0.3 | |
| 7.7 | 4.4 | 1 | .. | 1.2 | 1.1 | |
| 1.2 | 0.6 | 0.4 | 0 | 0 | 0.2 | |
| 0 | .. | .. | .. | 0 | 0 | |
| 1.1 | 0 | 0 | 0.8 | 0 | 0.2 | |
| 2.4 | 2.1 | 0.3 | 0 | 0 | 0 | |
| 0 | .. | .. | .. | 0 | 0 | |
| 0.7 | .. | .. | .. | 0.6 | 0 | |
| 26 | 25.6 | 0.1 | .. | 0 | 0.3 | |
| 12.7 | 8.2 | 4 | 0 | 0.4 | 0.1 | |
| 0.5 | .. | .. | .. | 0 | 0.5 | |
| 41.4 | 41.1 | .. | .. | 0 | 0.3 | |
| 0.6 | .. | .. | .. | 0 | 0.5 | |
| 3.1 | .. | .. | 2.2 | 0 | 0.9 | |
| 6 | .. | .. | .. | 1.1 | 4.8 | |
| 1.7 | .. | .. | .. | 0.7 | 0.9 | |
| 0.9 | .. | .. | .. | 0.2 | 0.7 | |
| 0.1 | 0 | 0 | 0 | 0 | 0.1 | |
| 50.6 | 47.9 | 0.2 | .. | 0.1 | 2.4 | |
| 2.3 | .. | .. | .. | 0 | 2.3 | |
| 0.8 | 0.2 | 0 | 0 | 0.5 | 0.1 | |
| 0.3 | 0 | 0 | 0.1 | 0 | 0.1 | |
| 14.3 | 3.2 | .. | .. | 9.6 | 1.4 | |
| 0.6 | 0 | 0 | 0.4 | 0.1 | 0 | |
| 0 | .. | .. | .. | 0 | .. | |
| 2.8 | 0.8 | .. | .. | 1.2 | 0.8 | |
| 20.1 | .. | .. | .. | 16 | 4.1 | |
| 4.6 | .. | .. | .. | 0 | 4.6 | |
| 16.2 | .. | .. | .. | 14.9 | 1.3 | |
| 0.7 | .. | .. | .. | 0 | 0.7 | |
| 2 | .. | .. | .. | 0.9 | 1.1 | |
| 0.8 | 0.3 | 0.2 | 0.2 | 0 | 0.1 | |
| 0 | .. | .. | .. | 0 | 0 | |
| 7.4 | 1.3 | 0.3 | 3.1 | 2 | 0.6 | |
| 10 | 3 | 0.8 | 4 | 1.6 | 0.6 | |
| 27.9 | 22 | 5 | 0 | 0.9 | 0 | |
| 78.5 | 77.7 | 0.8 | .. | 0 | 0 | |
| 0.2 | .. | 0 | 0 | 0.1 | 0 | |
| 0.4 | 0 | 0.3 | 0 | 0.2 | 0 | |
| 0.2 | 0.1 | 0 | 0 | 0 | 0 | |
| 1.7 | .. | .. | .. | 1.6 | 0.1 | |
| 0 | 0 | 0 | 0 | 0 | 0 | |
| 2.8 | 0 | 0.1 | .. | 2.7 | 0 | |
| 38.2 | 27.5 | 2.5 | 5.8 | 2.5 | 0 | |
| 1.4 | .. | .. | .. | 0.1 | 1.3 | |
| 0 | .. | .. | .. | 0 | .. | |
| 0.1 | 0 | 0 | 0 | 0 | 0 | |
| 2.9 | .. | .. | .. | 2.9 | .. | |
| 51.3 | 49.9 | 1.4 | .. | 0 | 0 | |
| 12.8 | 0.6 | 0 | 0.5 | 11.7 | 0 | |
| 16.8 | .. | .. | 0 | 15.2 | 1.5 | |
| 1.4 | .. | .. | .. | 0 | 1.4 | |
| 0 | .. | .. | .. | 0 | 0 | |
| 1.3 | .. | .. | .. | 0 | 1.3 | |
| 11 | .. | .. | .. | 2.3 | 8.7 | |
| 1.9 | 0.2 | .. | .. | 0 | 1.7 | |
| 0.1 | .. | .. | .. | 0.1 | 0 | |
| 6 | .. | .. | 1.5 | 4.5 | 0.1 | |
| 5.7 | .. | .. | .. | 3.9 | 1.8 | |
| 3.9 | .. | .. | .. | 0 | 3.9 | |
| 10.3 | 6.4 | 3.1 | 0.1 | 0.2 | 0.6 | |
| 0 | .. | .. | .. | 0 | 0 | |
| 14.2 | .. | .. | .. | 13.2 | 1 | |
| 0 | .. | .. | .. | 0 | .. | |
| 0 | .. | .. | .. | 0 | .. | |
| 58.5 | .. | .. | .. | 58 | 0.5 | |
| 0 | .. | .. | .. | 0 | 0 | |
| 9 | 7.2 | 0.6 | 0.1 | 1.1 | 0.1 | |
| 0 | .. | .. | .. | 0 | .. | |
| 0.2 | 0.1 | .. | .. | 0 | 0.1 | |
| 46 | 2.1 | .. | 26.5 | 17.2 | 0.2 | |
| 0 | .. | .. | .. | 0 | .. | |
| 4.1 | 0 | 0 | 0 | 4 | 0.1 | |
| 7.2 | .. | 4.2 | 0 | 0.2 | 2.7 | |
| 1.4 | .. | .. | .. | 1.3 | 0.1 | |
| 3 | .. | .. | 0 | 0 | 3 | |
| 1.1 | 0.1 | 1 | 0 | 0 | 0 | |
| 3 | 0.9 | 0.4 | 0.2 | 0.6 | 0.9 | |
| 2.3 | .. | .. | .. | 0.9 | 1.4 | |
| 2.4 | .. | .. | 0 | 0.5 | 1.9 | |
| 15.2 | 12.3 | 2.1 | 0 | 0 | 0.7 | |
| 13.6 | 10.8 | 2.7 | 0 | 0 | 0.1 | |
| 45.3 | 40.2 | 5.1 | .. | 0 | 0 | |
| 3.8 | 1 | 2 | 0.1 | 0.1 | 0.6 | |
| 0 | .. | .. | .. | 0 | .. | |
| 0.8 | .. | .. | .. | 0.7 | 0.1 | |
| 36.1 | .. | .. | .. | 32.5 | 3.5 | |
| 1.1 | .. | .. | .. | 0 | 1.1 | |
| 13.6 | 1.9 | 1 | 0 | 10.6 | 0.1 | |
| 3.6 | 0.1 | 0.3 | 0.4 | 2.6 | 0.2 | |
| 2.6 | 0.1 | 0.1 | 1.5 | 0.7 | 0.2 | |
| 0.4 | .. | .. | 0 | 0.2 | 0.1 | |
| 28.6 | 14.4 | 14.2 | .. | 0 | .. | |
| 2.6 | 1.3 | 0.7 | 0.4 | 0 | 0.2 | |
| 22 | 15.4 | 3.2 | 1.4 | 1.7 | 0.3 | |
| 3.3 | .. | .. | .. | 0.2 | 3 | |
| 0.3 | .. | .. | .. | 0 | 0.3 | |
| 0.9 | .. | .. | .. | 0 | 0.9 | |
| 58.7 | 55.5 | 3.1 | .. | 0 | 0 | |
| 3.4 | .. | 0 | .. | 2.3 | 1.1 | |
| 3.8 | 1.1 | 0.1 | 2.3 | 0.4 | .. | |
| 0 | .. | .. | .. | 0 | 0 | |
| 3.6 | .. | .. | .. | 1 | 2.6 | |
| 0 | .. | .. | .. | 0 | 0 | |
| 0.4 | 0 | 0 | 0.1 | 0 | 0.3 | |
| 0.4 | .. | 0 | 0.2 | 0 | 0.2 | |
| 14.1 | .. | .. | .. | 0 | 14.1 | |
| 10.6 | .. | 0 | 5.7 | 4.2 | 0.7 | |
| 0.1 | 0 | 0 | 0 | 0 | 0 | |
| 0.4 | .. | .. | .. | 0 | 0.4 | |
| 0 | .. | .. | .. | 0 | .. | |
| 0 | .. | .. | .. | 0 | .. | |
| 0 | .. | .. | .. | 0 | 0 | |
| 15.1 | 14.2 | .. | .. | 0.2 | 0.7 | |
| 11.7 | .. | .. | .. | 11.5 | 0.2 | |
| 1.6 | .. | .. | 0 | 0 | 1.6 | |
| 1.2 | .. | .. | 0 | 0.7 | 0.5 | |
| 0 | .. | .. | .. | 0 | 0 | |
| 1.6 | 0.2 | 0.1 | 0.3 | 1 | 0 | |
| 8.4 | .. | 0.5 | 0 | 5.6 | 2.2 | |
| 4 | 2.2 | 1.3 | 0.2 | 0.1 | 0.3 | |
| 0.2 | .. | .. | .. | 0 | 0.2 | |
| 4.8 | .. | .. | 0 | 2.9 | 1.9 | |
| 0 | .. | .. | .. | 0 | 0 | |
| 37.6 | 13.2 | 24.5 | .. | 0 | 0 | |
| 6.8 | 4.3 | 0.9 | .. | 1.4 | 0.1 | |
| 0.8 | 0.2 | 0 | 0.2 | 0.3 | 0.1 | |
| 43.9 | 21.3 | 22.6 | .. | 0 | .. | |
| 0 | .. | .. | .. | 0 | .. | |
| 5.4 | .. | .. | .. | 0 | 5.4 | |
| 6.1 | 0.9 | 1.3 | 3.6 | 0 | 0.2 | |
| 24.2 | 21.9 | 2.3 | .. | 0 | .. | |
| 1.5 | 1.2 | 0.2 | 0.1 | 0 | 0 | |
| 1.7 | 0.9 | 0 | 0.5 | 0.2 | 0.1 | |
| 0.9 | .. | .. | .. | 0.1 | 0.7 | |
| 27.9 | 3.3 | 15.1 | 0.2 | 9.3 | 0 | |
| 0.5 | .. | .. | .. | 0 | 0.5 | |
| 32.5 | 30 | 1.5 | 0.1 | 1 | 0 | |
| 13.6 | 7.8 | 1.1 | 3.4 | 0.6 | 0.7 | |
| 23.1 | 18.7 | 4.4 | .. | 0 | 0 | |
| 27 | .. | .. | 0 | 25.6 | 1.3 | |
| 6.9 | .. | .. | 2.8 | 2.4 | 1.6 | |
| World | 5.7 | 3.1 | 0.5 | 1 | 1 | 0.2 |
List by Alphabetical Order
| Country/Economy | Agriculture | Industry | Services | Year[7] |
|---|---|---|---|---|
| 24 | 21 | 55 | 2014 est. | |
| 21.6 | 14.9 | 63.5 | 2016 est. | |
| 13.1 | 38.7 | 48.2 | 2016 est. | |
| 27.4 | 12.4 | 60.2 | 2012 est. | |
| 14 | 79 | 6 | 2011 est. | |
| 10.2 | 61.4 | 28.4 | 2011 est. | |
| 2.3 | 21 | 76.6 | 2016 est. | |
| 2.2 | 17.8 | 80 | 2016 est. | |
| 11.4 | 30.2 | 58.4 | 2016 est. | |
| 19.6 | 29.1 | 51.3 | 2016 est. | |
| 0.4 | 33.3 | 66.3 | 2002 est. | |
| 3.6 | 28.2 | 68.2 | 2016 est. | |
| 1.5 | 29.4 | 69.1 | 2011 est. | |
| 5.5 | 62.1 | 32.4 | 2011 est. | |
| 2.2 | 6.5 | 91.3 | 2011 est. | |
| 0.4 | 63.6 | 36.0 | 2011 est. | |
| 18.4 | 28.6 | 53.0 | 2011 est. | |
| 3.2 | 13.9 | 82.9 | 2011 est. | |
| 9.4 | 45.9 | 44.7 | 2011 est. | |
| 0.7 | 21.7 | 77.6 | 2011 est. | |
| 9.7 | 19.8 | 70.5 | 2011 est. | |
| 36.0 | 6.4 | 57.6 | 2011 est. | |
| 0.7 | 7.0 | 92.2 | 2011 est. | |
| 16.7 | 45.4 | 37.9 | 2011 est. | |
| 10.0 | 40.0 | 50.0 | 2011 est. | |
| 8.3 | 26.3 | 65.4 | 2011 est. | |
| 2.1 | 45.0 | 52.9 | 2011 est. | |
| 5.5 | 27.5 | 67.0 | 2011 est. | |
| 1.0 | 11.9 | 87.2 | 2011 est. | |
| 0.8 | 66.7 | 32.5 | 2011 est. | |
| 5.2 | 30.6 | 64.2 | 2011 est. | |
| 34.7 | 23.3 | 42.0 | 2011 est. | |
| 38.2 | 18.2 | 43.6 | 2011 est. | |
| 31.0 | 21.4 | 47.7 | 2011 est. | |
| 30.0 | 30.0 | 40.0 | 2011 est. | |
| 19.5 | 31.0 | 49.5 | 2011 est. | |
| 1.9 | 27.1 | 71.0 | 2011 est. | |
| 8.4 | 15.7 | 75.9 | 2011 est. | |
| 0.5 | 50.4 | 49.1 | 2011 est. | |
| 53.1 | 14.5 | 32.4 | 2011 est. | |
| 52.7 | 6.7 | 40.6 | 2011 est. | |
| 5.1 | 41.8 | 53.1 | 2010 est. | |
| 10.1 | 46.8 | 43.1 | 2011 est. | |
| 7.0 | 37.6 | 55.5 | 2011 est. | |
| 51.6 | 13.6 | 47.0 | 2011 est. | |
| 37.5 | 27.6 | 35.0 | 2011 est. | |
| 4.2 | 70.7 | 25.1 | 2011 est. | |
| 11.7 | 9.9 | 78.5 | 2008 est. | |
| 6.3 | 21.7 | 72.0 | 2011 est. | |
| 30.0 | 21.0 | 49.0 | 2011 est. | |
| 5.4 | 25.5 | 69.1 | 2011 est. | |
| 4.0 | 20.8 | 75.2 | 2011 est. | |
| 0.7 | 15.5 | 83.8 | 2010 est. | |
| 2.4 | 16.5 | 81.1 | 2011 est. | |
| 1.6 | 38.1 | 60.3 | 2011 est. | |
| 4.5 | 19.1 | 76.4 | 2011 est. | |
| 3.0 | 17.0 | 79.9 | 2011 est. | |
| 21.4 | 22.4 | 56.3 | 2011 est. | |
| 6.7 | 26.1 | 67.2 | 2011 est. | |
| 6.5 | 34.6 | 58.9 | 2011 est. | |
| 14.5 | 37.6 | 47.6 | 2011 est. | |
| 10.6 | 30.0 | 59.3 | 2011 est. | |
| 3.6 | 89.7 | 4.3 | 2011 est. | |
| 11.0 | 34.0 | 55.0 | 2011 est. | |
| 3.5 | 28.5 | 61.0 | 2011 est. | |
| 41.0 | 13.0 | 46.0 | 2011 est. | |
| 1.8 | 24.9 | 73.2 | 2011 est. | |
| 95.0 | N/A | N/A | 1996 | |
| 16.0 | 29.0 | 55.0 | 2007 est. | |
| 12.0 | 20.2 | 67.7 | 2011 est. | |
| 3.0 | 29.2 | 67.8 | 2011 est. | |
| 1.8 | 18.8 | 79.4 | 2011 est. | |
| 3.5 | 20.4 | 76.1 | 2005 | |
| 5.2 | 54.4 | 40.4 | 2011 est. | |
| 26.7 | 17.4 | 55.9 | 2011 est. | |
| 8.8 | 22.7 | 68.5 | 2011 est. | |
| 0.8 | 28.6 | 70.6 | 2011 est. | |
| 28.3 | 21.0 | 50.7 | 2011 est. | |
| 0.0 | 0.0 | 100.0 | 2008 est. | |
| 3.3 | 17.9 | 78.9 | 2011 est. | |
| 4.0 | 29.0 | 67.0 | 2009 est. | |
| 5.3 | 14.2 | 80.5 | 2011 est. | |
| 13.3 | 24.0 | 62.7 | 2011 est. | |
| 3.0 | 10.0 | 87.0 | 2000 | |
| 16.9 | 53.6 | 29.5 | 2011 est. | |
| 55.8 | 13.0 | 31.2 | 2011 est. | |
| 18.5 | 30.6 | 50.9 | 2011 est. | |
| 25.0 | 16.0 | 59.0 | 2010 est. | |
| 12.6 | 26.3 | 61.1 | 2011 est. | |
| 0.1 | 6.8 | 93.2 | 2011 est. | |
| 3.7 | 31.3 | 65.0 | 2011 est. | |
| 5.4 | 24.7 | 69.9 | 2011 est. | |
| 17.2 | 26.4 | 56.4 | 2011 est. | |
| 14.7 | 47.2 | 38.1 | 2011 est. | |
| 10.4 | 37.7 | 51.8 | 2011 est. | |
| 9.7 | 60.5 | 29.8 | 2011 est. | |
| 2.0 | 29.0 | 69.0 | 2010 est. | |
| 1.0 | 11.0 | 88.0 | FY08/09 est. | |
| 2.5 | 31.1 | 64.9 | 2011 est. | |
| 2.0 | 24.7 | 73.4 | 2011 est. | |
| 5.8 | 29.5 | 64.7 | 2011 est. | |
| 1.2 | 27.3 | 71.6 | 2011 est. | |
| 1.0 | 2.0 | 97.0 | 2005 | |
| 4.5 | 30.8 | 64.7 | 2011 est. | |
| 5.2 | 37.9 | 56.9 | 2011 est. | |
| 19.0 | 16.4 | 64.6 | 2011 est. | |
| 8.9 | 24.2 | 66.8 | 2004 | |
| 23.0 | 43.4 | 33.6 | 2011 est. | |
| 2.6 | 39.2 | 58.2 | 2008 est. | |
| 12.9 | 22.6 | 64.5 | 2009 est. | |
| 0.3 | 47.4 | 52.3 | 2011 est. | |
| 20.1 | 28.8 | 51.1 | 2011 est. | |
| 27.8 | 34.8 | 37.4 | 2011 est. | |
| 4.0 | 21.7 | 74.3 | 2011 est. | |
| 4.6 | 19.7 | 75.7 | 2011 est. | |
| 7.5 | 33.1 | 59.4 | 2011 est. | |
| 76.9 | 5.4 | 17.7 | 2002 est. | |
| 3.2 | 49.5 | 47.3 | 2011 est. | |
| 8.0 | 37.0 | 55.0 | 2009 | |
| 3.3 | 28.2 | 68.6 | 2011 est. | |
| 0.4 | 13.6 | 86.0 | 2007 est. | |
| 0.1 | 9.4 | 90.6 | 2011 est. | |
| 9.5 | 27.1 | 63.4 | 2011 est. | |
| 28.3 | 16.4 | 55.2 | 2011 est. | |
| 30.3 | 16.7 | 53.0 | 2011 est. | |
| 12.0 | 40.0 | 48.0 | 2011 est. | |
| 5.6 | 16.9 | 77.5 | 2009 est. | |
| 38.8 | 21.9 | 39.3 | 2011 est. | |
| 1.9 | 17.2 | 80.9 | 2010 est. | |
| 31.7 | 14.9 | 53.4 | 2004 est. | |
| 17.8 | 37.6 | 44.7 | 2011 est. | |
| 4.5 | 24.0 | 71.4 | 2011 est. | |
| 3.8 | 34.2 | 62.0 | 2011 est. | |
| 28.9 | 15.2 | 55.9 | 2004 est. | |
| 16.2 | 20.3 | 63.5 | 2011 est. | |
| 0.0 | 4.9 | 95.1 | 2005 | |
| 15.8 | 32.6 | 51.6 | 2011 est. | |
| 0.8 | 11.3 | 87.9 | 2011 | |
| 1.6 | 23.0 | 75.3 | 2011 est. | |
| 16.6 | 32.2 | 51.2 | 2011 est. | |
| 31.5 | 23.8 | 44.7 | 2011 est. | |
| 7.2 | 33.3 | 59.5 | 2011 est. | |
| 34.9 | 15.0 | 50.1 | 2010 est. | |
| 2.7 | 24.2 | 73.1 | 2011 est. | |
| 2.0 | 27.1 | 70.9 | 2011 est. | |
| 4.8 | 24.5 | 70.7 | 2011 est. | |
| 17.4 | 25.7 | 56.8 | 2011 est. | |
| 39.0 | 16.0 | 45.0 | 2011 est. | |
| 17.8 | 25.7 | 54.6 | 2015 est. | |
| 23.5 | 26.9 | 49.5 | 2003 | |
| 2.6 | 39.7 | 57.7 | 2011 est. | |
| 1.5 | 49.5 | 48.9 | 2011 est. | |
| 20.9 | 25.8 | 53.3 | 2011 est. | |
| 6.2 | 12.0 | 81.8 | 2003 | |
| 4.1 | 16.7 | 79.2 | 2011 est. | |
| 29.9 | 37.6 | 32.4 | 2011 est. | |
| 23.1 | 18.6 | 58.3 | 2011 est. | |
| 8.0 | 38.0 | 54.0 | 2011 est. | |
| 12.8 | 31.5 | 55.7 | 2011 est. | |
| 3.4 | 33.6 | 63.0 | 2011 est. | |
| 2.5 | 22.8 | 74.7 | 2011 est. | |
| 1.0 | 45.0 | 54.0 | 2005 est. | |
| 0.1 | 73.0 | 26.9 | 2011 est. | |
| 7.9 | 32.9 | 59.2 | 2011 est. | |
| 4.5 | 36.9 | 58.6 | 2011 est. | |
| 33.0 | 13.9 | 53.1 | 2011 est. | |
| 2.4 | 22.8 | 74.7 | 2011 est. | |
| 4.1 | 18.4 | 77.5 | 2011 est. | |
| 1.0 | 15.0 | 84.0 | 2000 | |
| 7.8 | 25.9 | 66.3 | 2011 est. | |
| 9.9 | 28.8 | 61.4 | 2011 est. | |
| 0.1 | 39.2 | 60.7 | 2009 | |
| 15.0 | 24.4 | 60.6 | 2011 est. | |
| 2.0 | 69.1 | 28.9 | 2011 est. | |
| 15.0 | 22.8 | 62.2 | 2011 est. | |
| 11.2 | 18.7 | 70.0 | 2011 est. | |
| 2.0 | 18.5 | 79.5 | 2011 est. | |
| 51.5 | 22.0 | 26.5 | 2011 est. | |
| 0.0 | 26.6 | 73.4 | 2010 est. | |
| 0.4 | 18.3 | 81.3 | 2008 est. | |
| 3.8 | 35.5 | 60.7 | 2011 est. | |
| 2.5 | 6.9 | 90.5 | 2011 est. | |
| 37.7 | 6.4 | 55.9 | 2011 est. | |
| 60.2 | 7.4 | 32.5 | 2008 est. | |
| 2.5 | 31.6 | 65.9 | 2011 est. | |
| 3.2 | 25.8 | 71.0 | 2011 est. | |
| 13.0 | 29.6 | 57.4 | 2011 est. | |
| 25.0 | 29.3 | 45.7 | 2011 est. | |
| 10.8 | 24.4 | 64.8 | 2005 est. | |
| 8.2 | 46.9 | 44.9 | 2011 est. | |
| 1.8 | 27.3 | 70.9 | 2011 est. | |
| 1.3 | 27.5 | 71.3 | 2011 est. | |
| 16.9 | 27.4 | 55.7 | 2011 est. | |
| 1.3 | 32.0 | 66.9 | 2011 est. | |
| 21.4 | 21.7 | 56.8 | 2011 est. | |
| 27.8 | 24.2 | 48.0 | 2011 est. | |
| 13.3 | 34.0 | 52.7 | 2011 est. | |
| 26.5 | 17.8 | 55.6 | 2011 est. | |
| 46.0 | 23.0 | 31.0 | 2011 est. | |
| 20.8 | 18.1 | 61.1 | 2011 est. | |
| 0.3 | 58.4 | 41.3 | 2011 est. | |
| 10.6 | 34.6 | 54.8 | 2010 est. | |
| 9.3 | 28.1 | 62.6 | 2011 est. | |
| 7.9 | 24.5 | 67.6 | 2011 est. | |
| 1.0 | 24.2 | 74.8 | 2011 est. | |
| 16.6 | 27.2 | 56.2 | 2002 | |
| 22.0 | 25.4 | 52.6 | 2011 est. | |
| 9.4 | 34.4 | 56.2 | 2011 est. | |
| 0.8 | 53.9 | 45.3 | 2011 est. | |
| 0.7 | 21.4 | 77.8 | 2011 est. | |
| 1.2 | 19.2 | 79.6 | 2011 est. | |
| 9.4 | 21.7 | 68.9 | 2011 est. | |
| 21.9 | 37.7 | 40.3 | 2011 est. | |
| 21.2 | 10.4 | 68.4 | 2011 est. | |
| 3.8 | 35.8 | 60.4 | 2011 est. | |
| 22.0 | 40.3 | 37.7 | 2011 est. | |
| 1.0 | 19.0 | 80.0 | 2003 est. | |
| 3.7 | 13.6 | 82.7 | 2011 est. | |
| 7.9 | 42.2 | 49.9 | 2011 est. | |
| 21.4 | 35.1 | 43.5 | 2011 est. | |
| 20.4 | 24.6 | 54.9 | 2011 est. | |
| World | 6.1 | 31.1 | 62.9 | 2011 est. |
gdp per person employed(ppp) (2015) by sector
| Country Name | Agriculture % of GDP | Industry % of GDP | Services % of GDP | Agriculture % of total employment | Industry % of total employment | Services % of total employment |
|---|---|---|---|---|---|---|
| 21.4 % | 22.9 % | 55.7 % | 61.6 % | 9.9 % | 28.5 % | |
| 22.9 % | 24.2 % | 53 % | 42.3 % | 18.1 % | 39.6 % | |
| 0.7 % | 44.1 % | 55.1 % | 3.6 % | 21.5 % | 74.9 % | |
| 6 % | 28.1 % | 65.9 % | 2.1 % | 24.7 % | 73.3 % | |
| 19.3 % | 28.8 % | 52 % | 35.3 % | 15.9 % | 48.8 % | |
| 2.6 % | 25.4 % | 72 % | 2.8 % | 21.8 % | 75.5 % | |
| 1.2 % | 28.1 % | 70.7 % | 4.8 % | 25.7 % | 69.5 % | |
| 6.8 % | 49.3 % | 43.9 % | 36.4 % | 14.1 % | 49.6 % | |
| 40.4 % | 16.5 % | 43.1 % | 91.2 % | 2.6 % | 6.2 % | |
| 0.8 % | 22.2 % | 77.1 % | 1.2 % | 21.3 % | 77.5 % | |
| 25.3 % | 23.2 % | 51.4 % | 43.6 % | 10.2 % | 46.2 % | |
| 33.7 % | 21.2 % | 45.1 % | 80.3 % | 4.9 % | 14.9 % | |
| 15.5 % | 28.1 % | 56.3 % | 42.9 % | 18.7 % | 38.5 % | |
| 4.8 % | 27.9 % | 67.3 % | 6.9 % | 29.9 % | 63.2 % | |
| 0.3 % | 40.7 % | 59 % | 1 % | 33.6 % | 65.4 % | |
| 0.9 % | 11.2 % | 87.8 % | 3.8 % | 14.3 % | 81.9 % | |
| 7.6 % | 27.3 % | 65.1 % | 18.5 % | 30.4 % | 51.1 % | |
| 7.2 % | 37.7 % | 55.1 % | 9.5 % | 33 % | 57.5 % | |
| 14.9 % | 16.8 % | 68.3 % | 15.9 % | 16.2 % | 67.9 % | |
| 13.2 % | 32.6 % | 54.2 % | 30.5 % | 20.9 % | 48.6 % | |
| 5 % | 22.3 % | 72.7 % | 14.9 % | 21.6 % | 63.5 % | |
| 1.5 % | 9.6 % | 88.9 % | 2.9 % | 19.3 % | 77.8 % | |
| 1.1 % | 61.4 % | 37.5 % | 0.6 % | 19 % | 80.4 % | |
| 17.5 % | 43.2 % | 39.3 % | 58 % | 9.7 % | 32.4 % | |
| 2.4 % | 33.1 % | 64.4 % | 26.4 % | 14.9 % | 58.7 % | |
| 42.4 % | 16.4 % | 41.2 % | 72.6 % | 4.3 % | 23.2 % | |
| 0.7 % | 25.9 % | 73.4 % | 3.5 % | 20.4 % | 76.1 % | |
| 4.3 % | 32.4 % | 63.3 % | 9.6 % | 23.1 % | 67.3 % | |
| 8.8 % | 40.9 % | 50.2 % | 28.9 % | 23.7 % | 47.3 % | |
| 25.5 % | 28.9 % | 45.6 % | 57.2 % | 5.5 % | 37.3 % | |
| 16.1 % | 27.4 % | 56.6 % | 62.4 % | 8.7 % | 28.9 % | |
| 20.4 % | 35.2 % | 44.4 % | 65.6 % | 6 % | 28.4 % | |
| 7.2 % | 54.7 % | 38.1 % | 41.2 % | 26.2 % | 32.7 % | |
| 6.6 % | 33.4 % | 59.9 % | 13.7 % | 16.9 % | 69.4 % | |
| 10.2 % | 20 % | 69.8 % | 28.2 % | 11.2 % | 60.5 % | |
| 5.4 % | 22.1 % | 72.5 % | 12.3 % | 19.2 % | 68.5 % | |
| 2.1 % | 11.1 % | 86.8 % | 4.1 % | 16.9 % | 78.9 % | |
| 2.5 % | 37.8 % | 59.7 % | 2.6 % | 37.7 % | 59.7 % | |
| 0.6 % | 30.5 % | 68.9 % | 1.4 % | 27.8 % | 70.8 % | |
| 0.9 % | 22.7 % | 76.4 % | 2.5 % | 19.2 % | 78.3 % | |
| 5.8 % | 27.3 % | 66.9 % | 13.8 % | 17.2 % | 69 % | |
| 12.6 % | 38.8 % | 48.6 % | 11.4 % | 35.1 % | 53.5 % | |
| 10.2 % | 34.4 % | 55.4 % | 25 % | 19.3 % | 55.7 % | |
| 11.3 % | 36.2 % | 52.5 % | 25.8 % | 25.1 % | 49.1 % | |
| 2.8 % | 23.6 % | 73.6 % | 4.1 % | 19.7 % | 76.2 % | |
| 3.1 % | 27.8 % | 69.1 % | 3.8 % | 29.9 % | 66.3 % | |
| 39.2 % | 17.7 % | 43 % | 71.4 % | 8 % | 20.6 % | |
| 2.5 % | 27 % | 70.4 % | 4.3 % | 22 % | 73.7 % | |
| 11.3 % | 17.9 % | 70.7 % | 22.2 % | 2.9 % | 74.9 % | |
| 1.8 % | 19.6 % | 78.6 % | 2.8 % | 20.7 % | 76.6 % | |
| 4.7 % | 50.8 % | 44.5 % | 16.6 % | 19.1 % | 64.3 % | |
| 0.7 % | 20 % | 79.3 % | 1.2 % | 18.7 % | 80 % | |
| 9.1 % | 24.7 % | 66.2 % | 45.3 % | 11.4 % | 43.4 % | |
| 21 % | 27.6 % | 51.4 % | 43.4 % | 14.4 % | 42.2 % | |
| 20.8 % | 28.9 % | 50.3 % | 69.6 % | 7 % | 23.4 % | |
| 18.3 % | 14.2 % | 67.5 % | 30.2 % | 13.7 % | 56 % | |
| 49.5 % | 13.2 % | 37.3 % | 60.9 % | 5.7 % | 33.4 % | |
| 2 % | 57.9 % | 40 % | 17.6 % | 19.2 % | 63.2 % | |
| 4.2 % | 15.6 % | 80.1 % | 13.2 % | 14.9 % | 71.9 % | |
| 11.1 % | 28.1 % | 60.8 % | 32.6 % | 18.5 % | 48.9 % | |
| 34.5 % | 6.6 % | 58.9 % | 19 % | 25.5 % | 55.5 % | |
| 13.6 % | 27.9 % | 58.5 % | 30 % | 21.6 % | 48.5 % | |
| 4.2 % | 26.4 % | 69.4 % | 9.5 % | 27.1 % | 63.5 % | |
| 4.4 % | 31.7 % | 63.9 % | 4.5 % | 30.3 % | 65.2 % | |
| 13.9 % | 41.3 % | 44.7 % | 32.9 % | 22.2 % | 44.9 % | |
| 17.5 % | 29.6 % | 52.9 % | 46 % | 24.2 % | 29.8 % | |
| 1 % | 41.4 % | 57.7 % | 5.4 % | 20.4 % | 74.2 % | |
| 10.8 % | 33.8 % | 55.4 % | 18 % | 32.5 % | 49.4 % | |
| 4.7 % | 41.5 % | 53.8 % | 20.3 % | 20.7 % | 59 % | |
| 6.3 % | 22.7 % | 71.1 % | 4.3 % | 18.2 % | 77.5 % | |
| 1.3 % | 21 % | 77.7 % | 1.1 % | 18.2 % | 80.7 % | |
| 2.2 % | 23.5 % | 74.2 % | 3.6 % | 27.2 % | 69.2 % | |
| 7.5 % | 22.8 % | 69.7 % | 18.2 % | 15.1 % | 66.7 % | |
| 4.2 % | 29.6 % | 66.2 % | 2 % | 17.7 % | 80.3 % | |
| 1.1 % | 28.9 % | 70 % | 3.8 % | 26.8 % | 69.4 % | |
| 5 % | 32.5 % | 62.5 % | 18 % | 20.6 % | 61.4 % | |
| 33.3 % | 19.1 % | 47.6 % | 62.6 % | 8.4 % | 29 % | |
| 15.9 % | 28.4 % | 55.6 % | 29.3 % | 20.9 % | 49.8 % | |
| 28.6 % | 29.8 % | 41.5 % | 44.1 % | 19.5 % | 36.4 % | |
| 2.3 % | 38.3 % | 59.4 % | 5.2 % | 25.1 % | 69.7 % | |
| 0.5 % | 51.6 % | 47.9 % | 2.7 % | 27.6 % | 69.8 % | |
| 3.8 % | 16.7 % | 79.5 % | 8.2 % | 22.1 % | 69.7 % | |
| 34.4 % | 12.5 % | 53.1 % | 45.5 % | 11.6 % | 43 % | |
| 2.4 % | 13 % | 84.6 % | 15 % | 17.5 % | 67.6 % | |
| 8.8 % | 29.5 % | 61.7 % | 28.5 % | 26.3 % | 45.3 % | |
| 5.5 % | 36.6 % | 57.8 % | 40.6 % | 19.8 % | 39.6 % | |
| 3.6 % | 29.8 % | 66.5 % | 9.1 % | 25.1 % | 65.9 % | |
| 0.3 % | 12.5 % | 87.2 % | 1.4 % | 10.5 % | 88.1 % | |
| 4.1 % | 22.3 % | 73.6 % | 7.6 % | 23.5 % | 68.9 % | |
| 14.3 % | 29.5 % | 56.2 % | 33.5 % | 20.5 % | 45.9 % | |
| 14.4 % | 14.4 % | 71.2 % | 28.4 % | 31.9 % | 39.6 % | |
| 25.6 % | 15.7 % | 58.7 % | 74.5 % | 9.1 % | 16.4 % | |
| 6.5 % | 10.3 % | 83.3 % | 8.1 % | 23.1 % | 68.8 % | |
| 3.6 % | 32.7 % | 63.6 % | 13.5 % | 25.1 % | 61.4 % | |
| 11.4 % | 26.6 % | 62 % | 16.4 % | 29.6 % | 54 % | |
| 42 % | 19.8 % | 38.3 % | 57.3 % | 14.9 % | 27.8 % | |
| 1.3 % | 15.2 % | 83.5 % | 1.3 % | 22.4 % | 76.3 % | |
| 26.8 % | 34.5 % | 38.8 % | 26.2 % | 14 % | 59.8 % | |
| 9.7 % | 17.4 % | 72.9 % | 7.8 % | 17.6 % | 74.7 % | |
| 14.5 % | 33.8 % | 51.7 % | 28.5 % | 20.3 % | 51.3 % | |
| 25.2 % | 21.6 % | 53.2 % | 75.3 % | 4.1 % | 20.6 % | |
| 27.7 % | 28.6 % | 43.7 % | 40.6 % | 9.6 % | 49.9 % | |
| 3.6 % | 21.7 % | 74.7 % | 7.5 % | 25.4 % | 67.1 % | |
| 29.7 % | 16 % | 54.3 % | 69.9 % | 4.7 % | 25.4 % | |
| 8.5 % | 39.1 % | 52.4 % | 12.5 % | 27.5 % | 60 % | |
| 6.5 % | 31 % | 62.5 % | 30.4 % | 14.7 % | 54.8 % | |
| 39.4 % | 19.2 % | 41.4 % | 62.4 % | 14.4 % | 23.3 % | |
| 20.9 % | 20.4 % | 58.8 % | 27.2 % | 15 % | 57.7 % | |
| 18.2 % | 27.2 % | 54.6 % | 24.9 % | 14.5 % | 60.6 % | |
| 1.8 % | 20.3 % | 77.9 % | 2.3 % | 16.1 % | 81.6 % | |
| 1.7 % | 34.8 % | 63.5 % | 2.2 % | 20.3 % | 77.5 % | |
| 33 % | 15.4 % | 51.7 % | 72.9 % | 10.9 % | 16.2 % | |
| 1.6 % | 52.4 % | 46 % | 5 % | 39.6 % | 55.5 % | |
| 25.1 % | 20.1 % | 54.9 % | 43.4 % | 19.7 % | 36.9 % | |
| 2.9 % | 27.7 % | 69.4 % | 15.3 % | 19.9 % | 64.8 % | |
| 7.8 % | 32.8 % | 59.4 % | 25.6 % | 17.8 % | 56.6 % | |
| 10.3 % | 30.9 % | 58.8 % | 29.2 % | 16.2 % | 54.7 % | |
| 2.5 % | 34.1 % | 63.4 % | 11.3 % | 30.2 % | 58.5 % | |
| 2.4 % | 22.4 % | 75.3 % | 8.3 % | 24 % | 67.7 % | |
| 19.2 % | 29.6 % | 51.2 % | 20.1 % | 19.6 % | 60.4 % | |
| 0.2 % | 58.5 % | 41.3 % | 1.2 % | 54.1 % | 44.6 % | |
| 4.8 % | 34.1 % | 61.2 % | 26.4 % | 29 % | 44.5 % | |
| 4.6 % | 32.8 % | 62.7 % | 6.7 % | 27.2 % | 66.1 % | |
| 30.2 % | 18.3 % | 51.6 % | 75.6 % | 7.1 % | 17.4 % | |
| 2.6 % | 45.1 % | 52.3 % | 6.1 % | 22.7 % | 71.2 % | |
| 39.3 % | 2.6 % | 58.1 % | 33.3 % | 20.3 % | 46.4 % | |
| 16.9 % | 23.8 % | 59.3 % | 52.6 % | 20.4 % | 27 % | |
| 0 % | 26.1 % | 73.8 % | 0.3 % | 17.1 % | 82.6 % | |
| 60.5 % | 4.6 % | 34.9 % | 68.4 % | 6.3 % | 25.2 % | |
| 11.1 % | 26.7 % | 62.2 % | 19 % | 20.2 % | 60.8 % | |
| 8.2 % | 31.4 % | 60.5 % | 19.4 % | 24.5 % | 56.1 % | |
| 12.6 % | 15 % | 72.4 % | 23 % | 13.6 % | 63.4 % | |
| 10.2 % | 28.1 % | 61.7 % | 3.3 % | 22.7 % | 74 % | |
| 3.8 % | 34.5 % | 61.7 % | 3.4 % | 35.2 % | 61.4 % | |
| 2.3 % | 32.6 % | 65.1 % | 9.1 % | 30.6 % | 60.3 % | |
| 1.4 % | 24.5 % | 74.2 % | 1.9 % | 18.6 % | 79.5 % | |
| 10.2 % | 38.1 % | 51.6 % | 22.1 % | 16.9 % | 61 % | |
| 52.4 % | 14.2 % | 33.4 % | 76.5 % | 2.1 % | 21.4 % | |
| 40.7 % | 17.7 % | 40.7 % | 63.1 % | 8.6 % | 28.2 % | |
| 8.7 % | 36.4 % | 54.9 % | 35.3 % | 22.4 % | 42.3 % | |
| 25 % | 28 % | 47.1 % | 57.7 % | 12.9 % | 29.3 % | |
| 17.6 % | 18.8 % | 63.6 % | 49.9 % | 1.8 % | 48.3 % | |
| 20.2 % | 19.4 % | 60.4 % | 33.8 % | 27.9 % | 38.3 % | |
| 0.5 % | 40.4 % | 59 % | 4.2 % | 31.4 % | 64.5 % | |
| 11 % | 27.2 % | 61.8 % | 11.9 % | 29.5 % | 58.6 % | |
| 7.8 % | 31.7 % | 60.5 % | 20.5 % | 27.8 % | 51.7 % | |
| 31.5 % | 26.4 % | 42.2 % | 67.7 % | 6.3 % | 26 % | |
| 26.1 % | 21.8 % | 52.1 % | 72.7 % | 7.2 % | 20.1 % | |
| 14.2 % | 25.6 % | 60.2 % | 15.3 % | 24.7 % | 60.1 % | |
| 7 % | 28.9 % | 64.1 % | 8.8 % | 20.5 % | 70.7 % | |
| 1.1 % | 20 % | 78.9 % | 1.5 % | 17.5 % | 81 % | |
| 18.2 % | 34.5 % | 47.3 % | 30.1 % | 23.8 % | 46.1 % | |
| 7.4 % | 18.2 % | 74.4 % | 22.9 % | 16.4 % | 60.7 % | |
| 18.9 % | 37 % | 44.2 % | 44 % | 22.3 % | 33.7 % | |
| World | 3.8 % | 27.3 % | 68.9 % | 29.5 % | 21.5 % | 48.9 % |
| 9.5 % | 24.3 % | 66.2 % | 5.3 % | 14.5 % | 80.2 % | |
| 9.8 % | 48.1 % | 42.1 % | 27.8 % | 17 % | 55.2 % | |
| 2.3 % | 29.2 % | 68.5 % | 6.2 % | 26.4 % | 67.4 % | |
| 5.3 % | 35.3 % | 59.4 % | 54.9 % | 10.2 % | 34.9 % | |
| 11.6 % | 24.2 % | 64.2 % | 67.1 % | 7.3 % | 25.6 % |
| Country Name | (gdp in %)/(employment in %) ratio in Agriculture | (gdp in %)/(employment in %) ratio in Industry | (gdp in %)/(employment in %) ratio in Services |
|---|---|---|---|
| 35% | 231% | 195% | |
| 54% | 134% | 134% | |
| 19% | 205% | 74% | |
| 286% | 114% | 90% | |
| 55% | 181% | 107% | |
| 93% | 117% | 95% | |
| 25% | 109% | 102% | |
| 19% | 350% | 89% | |
| 44% | 635% | 695% | |
| 67% | 104% | 99% | |
| 58% | 227% | 111% | |
| 42% | 433% | 303% | |
| 36% | 150% | 146% | |
| 70% | 93% | 106% | |
| 30% | 121% | 90% | |
| 24% | 78% | 107% | |
| 41% | 90% | 127% | |
| 76% | 114% | 96% | |
| 94% | 104% | 101% | |
| 43% | 156% | 112% | |
| 34% | 103% | 114% | |
| 52% | 50% | 114% | |
| 183% | 323% | 47% | |
| 30% | 445% | 121% | |
| 9% | 222% | 110% | |
| 58% | 381% | 178% | |
| 20% | 127% | 96% | |
| 45% | 140% | 94% | |
| 30% | 173% | 106% | |
| 45% | 525% | 122% | |
| 26% | 315% | 196% | |
| 31% | 587% | 156% | |
| 17% | 209% | 117% | |
| 48% | 198% | 86% | |
| 36% | 179% | 115% | |
| 44% | 115% | 106% | |
| 51% | 66% | 110% | |
| 96% | 100% | 100% | |
| 43% | 110% | 97% | |
| 36% | 118% | 98% | |
| 42% | 159% | 97% | |
| 111% | 111% | 91% | |
| 41% | 178% | 99% | |
| 44% | 144% | 107% | |
| 68% | 120% | 97% | |
| 82% | 93% | 104% | |
| 55% | 221% | 209% | |
| 58% | 123% | 96% | |
| 51% | 617% | 94% | |
| 64% | 95% | 103% | |
| 28% | 266% | 69% | |
| 58% | 107% | 99% | |
| 20% | 217% | 153% | |
| 48% | 192% | 122% | |
| 30% | 413% | 215% | |
| 61% | 104% | 121% | |
| 81% | 232% | 112% | |
| 11% | 302% | 63% | |
| 32% | 105% | 111% | |
| 34% | 152% | 124% | |
| 182% | 26% | 106% | |
| 45% | 129% | 121% | |
| 44% | 97% | 109% | |
| 98% | 105% | 98% | |
| 42% | 186% | 100% | |
| 38% | 122% | 178% | |
| 19% | 203% | 78% | |
| 60% | 104% | 112% | |
| 23% | 200% | 91% | |
| 147% | 125% | 92% | |
| 118% | 115% | 96% | |
| 61% | 86% | 107% | |
| 41% | 151% | 104% | |
| 210% | 167% | 82% | |
| 29% | 108% | 101% | |
| 28% | 158% | 102% | |
| 53% | 227% | 164% | |
| 54% | 136% | 112% | |
| 65% | 153% | 114% | |
| 44% | 153% | 85% | |
| 19% | 187% | 69% | |
| 46% | 76% | 114% | |
| 76% | 108% | 123% | |
| 16% | 74% | 125% | |
| 31% | 112% | 136% | |
| 14% | 185% | 146% | |
| 40% | 119% | 101% | |
| 21% | 119% | 99% | |
| 54% | 95% | 107% | |
| 43% | 144% | 122% | |
| 51% | 45% | 180% | |
| 34% | 173% | 358% | |
| 80% | 45% | 121% | |
| 27% | 130% | 104% | |
| 70% | 90% | 115% | |
| 73% | 133% | 138% | |
| 100% | 68% | 109% | |
| 102% | 246% | 65% | |
| 124% | 99% | 98% | |
| 51% | 167% | 101% | |
| 33% | 527% | 258% | |
| 68% | 298% | 88% | |
| 48% | 85% | 111% | |
| 42% | 340% | 214% | |
| 68% | 142% | 87% | |
| 21% | 211% | 114% | |
| 63% | 133% | 178% | |
| 77% | 136% | 102% | |
| 73% | 188% | 90% | |
| 78% | 126% | 95% | |
| 77% | 171% | 82% | |
| 45% | 141% | 319% | |
| 32% | 132% | 83% | |
| 58% | 102% | 149% | |
| 19% | 139% | 107% | |
| 30% | 184% | 105% | |
| 35% | 191% | 107% | |
| 22% | 113% | 108% | |
| 29% | 93% | 111% | |
| 96% | 151% | 85% | |
| 17% | 108% | 93% | |
| 18% | 118% | 138% | |
| 69% | 121% | 95% | |
| 40% | 258% | 297% | |
| 43% | 199% | 73% | |
| 118% | 13% | 125% | |
| 32% | 117% | 220% | |
| 0% | 153% | 89% | |
| 88% | 73% | 138% | |
| 58% | 132% | 102% | |
| 42% | 128% | 108% | |
| 55% | 110% | 114% | |
| 309% | 124% | 83% | |
| 112% | 98% | 100% | |
| 25% | 107% | 108% | |
| 74% | 132% | 93% | |
| 46% | 225% | 85% | |
| 68% | 676% | 156% | |
| 65% | 206% | 144% | |
| 25% | 163% | 130% | |
| 43% | 217% | 161% | |
| 35% | 1044% | 132% | |
| 60% | 70% | 158% | |
| 12% | 129% | 91% | |
| 92% | 92% | 105% | |
| 38% | 114% | 117% | |
| 47% | 419% | 162% | |
| 36% | 303% | 259% | |
| 93% | 104% | 100% | |
| 80% | 141% | 91% | |
| 73% | 114% | 97% | |
| 60% | 145% | 103% | |
| 32% | 111% | 123% | |
| 43% | 166% | 131% | |
| World | 13% | 127% | 141% |
| 179% | 168% | 83% | |
| 35% | 283% | 76% | |
| 37% | 111% | 102% | |
| 10% | 346% | 170% | |
| 17% | 332% | 251% |
| Country Name | gdp per person employed ppp (2015) | gdp per person employed ppp (2015) in Agriculture | gdp per person employed ppp (2015) in industry | gdp per person employed ppp (2015) in services |
|---|---|---|---|---|
| 6558 | 2278 | 15170 | 12817 | |
| 31076 | 16824 | 41549 | 41592 | |
| 97631 | 18984 | 200257 | 71822 | |
| 45113 | 128894 | 51323 | 40559 | |
| 19820 | 10836 | 35900 | 21120 | |
| 88412 | 82097 | 103012 | 84313 | |
| 90012 | 22503 | 98418 | 91566 | |
| 35200 | 6576 | 123075 | 31155 | |
| 1651 | 731 | 10478 | 11477 | |
| 102439 | 68293 | 106767 | 101910 | |
| 4948 | 2871 | 11254 | 5505 | |
| 3623 | 1520 | 15675 | 10966 | |
| 7457 | 2694 | 11205 | 10905 | |
| 40164 | 27940 | 37477 | 42770 | |
| 80045 | 24014 | 96959 | 72212 | |
| 41879 | 9919 | 32800 | 44896 | |
| 38478 | 15807 | 34554 | 49020 | |
| 33059 | 25055 | 37767 | 31679 | |
| 18766 | 17586 | 19461 | 18877 | |
| 13634 | 5901 | 21266 | 15205 | |
| 30843 | 10350 | 31843 | 35312 | |
| 32516 | 16819 | 16174 | 37155 | |
| 164315 | 301244 | 530997 | 76639 | |
| 16508 | 4981 | 73520 | 20024 | |
| 34827 | 3166 | 77367 | 38209 | |
| 1540 | 899 | 5873 | 2735 | |
| 100654 | 20131 | 127791 | 97083 | |
| 48269 | 21620 | 67702 | 45400 | |
| 23967 | 7298 | 41361 | 25436 | |
| 9323 | 4156 | 48988 | 11398 | |
| 7184 | 1854 | 22625 | 14070 | |
| 2021 | 628 | 11857 | 3160 | |
| 15157 | 2649 | 31645 | 17660 | |
| 27478 | 13238 | 54306 | 23717 | |
| 14305 | 5174 | 25545 | 16504 | |
| 33868 | 14869 | 38983 | 35846 | |
| 49375 | 25290 | 32430 | 54319 | |
| 63045 | 60620 | 63212 | 63045 | |
| 87477 | 37490 | 95973 | 85129 | |
| 93976 | 33831 | 111107 | 91696 | |
| 34196 | 14372 | 54276 | 33155 | |
| 49446 | 54651 | 54658 | 44917 | |
| 24837 | 10133 | 44269 | 24703 | |
| 34629 | 15167 | 49943 | 37027 | |
| 83358 | 56927 | 99860 | 80514 | |
| 56194 | 45842 | 52247 | 58567 | |
| 3307 | 1816 | 7317 | 6903 | |
| 87730 | 51006 | 107669 | 83802 | |
| 24813 | 12630 | 153156 | 23422 | |
| 92998 | 59784 | 88056 | 95426 | |
| 63902 | 18093 | 169959 | 44225 | |
| 78773 | 45951 | 84249 | 78084 | |
| 17720 | 3560 | 38393 | 27029 | |
| 8815 | 4265 | 16895 | 10737 | |
| 2678 | 800 | 11056 | 5757 | |
| 5382 | 3261 | 5578 | 6487 | |
| 3589 | 2917 | 8311 | 4008 | |
| 55374 | 6293 | 166987 | 35047 | |
| 68470 | 21786 | 71687 | 76279 | |
| 18989 | 6466 | 28843 | 23610 | |
| 18925 | 34364 | 4898 | 20084 | |
| 10555 | 4785 | 13634 | 12731 | |
| 54958 | 24297 | 53538 | 60064 | |
| 58341 | 57045 | 61037 | 57178 | |
| 22644 | 9567 | 42126 | 22543 | |
| 15521 | 5905 | 18984 | 27552 | |
| 142759 | 26437 | 289717 | 111013 | |
| 52886 | 31732 | 55001 | 59309 | |
| 68145 | 15777 | 136619 | 62139 | |
| 75447 | 110539 | 94101 | 69217 | |
| 75934 | 89740 | 87616 | 73111 | |
| 94918 | 58005 | 82006 | 101776 | |
| 18870 | 7776 | 28492 | 19719 | |
| 38885 | 81659 | 65028 | 32057 | |
| 75075 | 21732 | 80958 | 75724 | |
| 46897 | 13027 | 73988 | 47737 | |
| 8199 | 4361 | 18643 | 13458 | |
| 8175 | 4436 | 11109 | 9127 | |
| 5955 | 3862 | 9100 | 6789 | |
| 67808 | 29992 | 103468 | 57788 | |
| 130827 | 24227 | 244590 | 89780 | |
| 39027 | 18086 | 29491 | 44514 | |
| 2320 | 1754 | 2500 | 2865 | |
| 25314 | 4050 | 18805 | 31680 | |
| 30031 | 9273 | 33685 | 40903 | |
| 8693 | 1178 | 16069 | 12688 | |
| 58122 | 22993 | 69005 | 58651 | |
| 204437 | 43808 | 243377 | 202349 | |
| 49741 | 26834 | 47201 | 53134 | |
| 23034 | 9832 | 33146 | 28203 | |
| 12306 | 6240 | 5555 | 22126 | |
| 2777 | 954 | 4791 | 9940 | |
| 22490 | 18048 | 10028 | 27230 | |
| 38507 | 10269 | 50166 | 39887 | |
| 36981 | 25706 | 33233 | 42460 | |
| 6258 | 4587 | 8316 | 8622 | |
| 76638 | 76638 | 52004 | 83870 | |
| 9095 | 9303 | 22413 | 5901 | |
| 46023 | 57234 | 45500 | 44914 | |
| 27642 | 14063 | 46025 | 27858 | |
| 3445 | 1153 | 18149 | 8897 | |
| 13894 | 9479 | 41393 | 12168 | |
| 42292 | 20300 | 36131 | 47082 | |
| 2596 | 1103 | 8837 | 5550 | |
| 54102 | 36789 | 76923 | 47249 | |
| 33146 | 7087 | 69900 | 37803 | |
| 2867 | 1810 | 3823 | 5094 | |
| 18836 | 14473 | 25617 | 19195 | |
| 11540 | 8435 | 21647 | 10397 | |
| 93385 | 73084 | 117746 | 89151 | |
| 124695 | 96355 | 213763 | 102169 | |
| 4239 | 1919 | 5989 | 13528 | |
| 89461 | 28628 | 118378 | 74148 | |
| 14241 | 8236 | 14530 | 21188 | |
| 45874 | 8695 | 63855 | 49130 | |
| 23543 | 7173 | 43383 | 24708 | |
| 16741 | 5905 | 31932 | 17996 | |
| 56240 | 12442 | 63503 | 60951 | |
| 59901 | 17321 | 55908 | 66625 | |
| 18263 | 17445 | 27581 | 15481 | |
| 161066 | 26844 | 174166 | 149149 | |
| 46300 | 8418 | 54442 | 63676 | |
| 48847 | 33537 | 58904 | 46334 | |
| 3398 | 1357 | 8758 | 10077 | |
| 130050 | 55431 | 258381 | 95528 | |
| 17780 | 20984 | 2277 | 22263 | |
| 7883 | 2533 | 9197 | 17313 | |
| 143706 | 0 | 219341 | 128396 | |
| 3524 | 3117 | 2573 | 4880 | |
| 18844 | 11009 | 24908 | 19278 | |
| 29902 | 12639 | 38323 | 32247 | |
| 9964 | 5459 | 10990 | 11378 | |
| 41917 | 129562 | 51888 | 34950 | |
| 63448 | 70912 | 62186 | 63758 | |
| 64868 | 16395 | 69108 | 70032 | |
| 91977 | 67773 | 121153 | 85845 | |
| 32982 | 15222 | 74356 | 27900 | |
| 5787 | 3964 | 39131 | 9032 | |
| 3063 | 1976 | 6304 | 4421 | |
| 26449 | 6519 | 42980 | 34327 | |
| 6707 | 2906 | 14558 | 10782 | |
| 9775 | 3448 | 102094 | 12871 | |
| 13664 | 8166 | 9501 | 21548 | |
| 65021 | 7741 | 83658 | 59477 | |
| 34898 | 32259 | 32177 | 36804 | |
| 58400 | 22220 | 66593 | 68340 | |
| 5741 | 2671 | 24058 | 9318 | |
| 3912 | 1404 | 11845 | 10140 | |
| 15708 | 14579 | 16280 | 15734 | |
| 41998 | 33408 | 59207 | 38077 | |
| 111561 | 81811 | 127498 | 108669 | |
| 14140 | 8550 | 20497 | 14508 | |
| 25364 | 8196 | 28148 | 31089 | |
| 9419 | 4046 | 15628 | 12354 | |
| World | 33761 | 4349 | 42869 | 47569 |
| 23655 | 42400 | 39643 | 19526 | |
| 10752 | 3790 | 30422 | 8200 | |
| 43671 | 16201 | 48303 | 44384 | |
| 9558 | 923 | 33078 | 16268 | |
| 3621 | 626 | 12004 | 9081 |
References
- 1 2 "The World Factbook - Central Intelligence Agency". Central Intelligence Agency. Retrieved 20 September 2017.
- ↑ "World GDP Ranking 2017 | GDP by country | Data and Charts - knoema.com". Knoema. Retrieved 2018-02-19.
- ↑ "Nigerian Gross Domestic Product Report Q2 2015". National Bureau of Statistics. Archived from the original on 15 September 2015. Retrieved 22 September 2015.
- ↑ "UNCTADstat - Table view". unctadstat.unctad.org. Retrieved 2017-11-26.
- ↑ "UNCTADstat - Table view". 2017-10-20. Retrieved 2018-02-12.
- ↑ "A closer look at Nigeria's GDP rebasing". cnbc Africa. 12 February 2015. Retrieved 22 June 2015.
- ↑ "GDP - COMPOSITION BY SECTOR". The World Factbook. Central Intelligence Agency. Missing or empty
|url=(help);|access-date=requires|url=(help) - ↑ "Nigerian Gross Domestic Product Report Q2 2015". National Bureau of Statistics. Archived from the original on 15 September 2015. Retrieved 22 September 2015.
Sources
- GDP (nominal): International Monetary Fund, World Economic Outlook Database, April 2012: Nominal GDP list of countries. Data for the year 2012. - IMF
- GDP Sector composition: Field Listing - GDP composition by sector. - CIA World Factbook
This article is issued from
Wikipedia.
The text is licensed under Creative Commons - Attribution - Sharealike.
Additional terms may apply for the media files.