List of U.S. states by incarceration and correctional supervision rate
This article has lists of U.S. states by adult incarceration and correctional supervision rates according to United States Department of Justice figures. The state incarceration numbers include sentenced and unsentenced inmates in jails and state prisons, but not persons in federal prisons. They are listed separately. The state numbers also do not include youth held in juvenile detention.
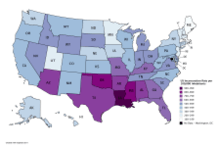
Incarceration rate by state
U.S. states by incarceration rate under state prison or local jail jurisdiction per 100,000 population. Rates are for yearend 2016. Federal prison inmates are not included in the state rates. The table below has all 50 states plus the District of Columbia.
- Note: There are 2 incarceration rate columns: One per 100,000 adults, and one per 100,000 of all ages.[1]
- Note: The rate columns can be sorted in ascending or descending order. The row number column on the left sorts separately. This way the states can be ranked by incarceration rate. Sort the state column to return to alphabetical order.
|
|
Comparison with other countries
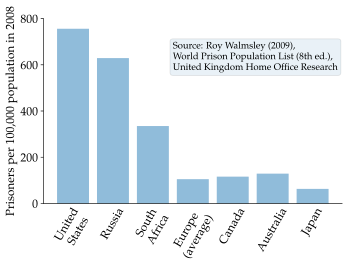
According to the World Prison Brief the United States currently has the largest prison population in the world, and the highest incarceration rate.[3][4][5][6]
On January 1, 2008 more than 1 in 100 adults in the United States were in prison or jail.[7][8] Total US incarceration peaked in 2008.[1]
In addition to the overall highest incarceration rate, the United States also has the highest rate of female incarceration. According to a November 2017 report by the World Prison Brief around 212,000 of the 714,000 female prisoners worldwide (women and girls) are incarcerated in the United States.[9] In the United States in 2015, women made up 10.4% of the incarcerated population in adult prisons and jails.[10] In most countries, the proportion of female inmates to the larger prison population is closer to one in twenty. Australia is the exception where the rate of female imprisonment increased from 9.2 percent in 1991 to 15.3 percent in 1999.[11]
Comparing other English-speaking developed countries,[3] whereas the incarceration rate in the US is 660 per 100,000 population of all ages (as of 2016 table above),[1] the incarceration rate of Canada is 114 per 100,000 (as of 2015),[12] England and Wales is 146 per 100,000 (as of 2016),[13] and Australia is 160 per 100,000 (as of 2016).[14] Comparing other developed countries, the rate of Spain is 133 per 100,000 (as of 2016),[15], France is 110 per 100,000 (as of 2016),[16] Germany is 76 per 100,000 (as of 2016),[17] Norway is 73 per 100,000 (as of 2016),[18] Netherlands is 69 per 100,000 (as of 2014),[19] and Japan is 48 per 100,000 (as of 2014).[20]
In addition, the United States has striking statistics when observing the racial dimension of mass incarceration. According to Michelle Alexander, the United States "imprisons a larger percentage of its black population than South Africa did at the height of apartheid."[21]
Correctional supervision rate by state
Chart below has numbers for people in adult facilities, and for people on probation and on parole.[1] The incarceration numbers in the main part of the chart below are for sentenced and unsentenced inmates in adult facilities in local jails and state prisons, but not for people in federal prisons.
The bottom of the chart has totals and average rates for each column.
Federal prison numbers are added at the end of the chart. So the total number (local, state, and federal) under adult correctional supervision is 6,582,100. That is a correctional supervision rate of 2,630 per 100,000 U.S. adult residents. That rounds off to 2.6% of US adult residents.
| Jurisdiction | Total | Community supervision | Incarcerated | |||
|---|---|---|---|---|---|---|
| Total, 12/31/2016 | Rate per 100,000 adults | Probation or Parole, 12/31/2016 | Rate per 100,000 adults | In prison or jail, 12/31/2016 | Rate per 100,000 adults | |
| Alabama | 99,800 | 2,640 | 60,700 | 1,610 | 40,900 | 1,080 |
| Alaska | 12,900 | 2,320 | 8,400 | 1,520 | 4,400 | 800 |
| Arizona | 137,500 | 2,570 | 84,800 | 1,590 | 55,000 | 1,030 |
| Arkansas | 72,100 | 3,150 | 51,500 | 2,250 | 24,000 | 1,050 |
| California | 536,100 | 1,770 | 333,300 | 1,100 | 202,700 | 670 |
| Colorado | 121,900 | 2,820 | 90,900 | 2,110 | 32,100 | 740 |
| Connecticut | 59,600 | 2,110 | 44,700 | 1,580 | 15,000 | 530 |
| Delaware | 22,400 | 2,980 | 15,800 | 2,100 | 6,600 | 880 |
| District of Columbia | 10,400 | 1,840 | 9,600 | 1,710 | 1,800 | 320 |
| Florida | 366,000 | 2,200 | 218,600 | 1,320 | 149,800 | 900 |
| Georgia | .. | .. | .. | .. | 91,400 | 1,160 |
| Hawaii | 27,500 | 2,450 | 21,900 | 1,950 | 5,600 | 500 |
| Idaho | 48,800 | 3,880 | 37,500 | 2,980 | 11,300 | 900 |
| Illinois | 204,200 | 2,070 | 143,400 | 1,450 | 60,800 | 620 |
| Indiana | 159,900 | 3,150 | 116,700 | 2,300 | 43,200 | 850 |
| Iowa | 46,700 | 1,940 | 35,100 | 1,460 | 13,400 | 560 |
| Kansas | 38,500 | 1,750 | 21,500 | 980 | 17,200 | 780 |
| Kentucky | 97,900 | 2,850 | 63,800 | 1,860 | 34,700 | 1,010 |
| Louisiana | 111,000 | 3,110 | 71,000 | 1,980 | 45,400 | 1,270 |
| Maine | 10,300 | 960 | 6,800 | 630 | 4,100 | 380 |
| Maryland | 99,000 | 2,120 | 82,800 | 1,770 | 28,400 | 610 |
| Massachusetts | 82,900 | 1,520 | 63,600 | 1,170 | 19,400 | 360 |
| Michigan | .. | .. | .. | .. | 56,500 | 730 |
| Minnesota | 119,500 | 2,810 | 103,900 | 2,450 | 16,300 | 380 |
| Mississippi | 65,300 | 2,880 | 37,700 | 1,660 | 28,700 | 1,260 |
| Missouri | 105,900 | 2,240 | 61,600 | 1,300 | 44,300 | 940 |
| Montana | 15,200 | 1,860 | 10,200 | 1,250 | 5,700 | 700 |
| Nebraska | 23,300 | 1,620 | 14,600 | 1,010 | 8,800 | 610 |
| Nevada | 39,200 | 1,720 | 19,000 | 830 | 20,200 | 890 |
| New Hampshire | 10,800 | 1,010 | 6,400 | 590 | 4,500 | 410 |
| New Jersey | 186,300 | 2,670 | 155,700 | 2,230 | 32,000 | 460 |
| New Mexico | 30,200 | 1,900 | 15,500 | 970 | 14,700 | 930 |
| New York | 212,100 | 1,360 | 142,400 | 910 | 74,400 | 480 |
| North Carolina | 149,300 | 1,890 | 95,200 | 1,210 | 54,100 | 680 |
| North Dakota | 10,300 | 1,770 | 7,100 | 1,230 | 3,100 | 540 |
| Ohio | 326,200 | 3,620 | 256,400 | 2,840 | 71,000 | 790 |
| Oklahoma | 74,500 | 2,510 | 35,500 | 1,190 | 39,000 | 1,310 |
| Oregon | 82,000 | 2,520 | 61,400 | 1,890 | 20,700 | 640 |
| Pennsylvania | 368,100 | 3,640 | 291,600 | 2,880 | 82,400 | 810 |
| Rhode Island | 24,300 | 2,850 | 23,200 | 2,730 | 3,100 | 370 |
| South Carolina | 68,800 | 1,770 | 36,700 | 940 | 32,100 | 820 |
| South Dakota | 15,000 | 2,290 | 9,300 | 1,420 | 5,800 | 880 |
| Tennessee | 119,400 | 2,310 | 74,700 | 1,440 | 48,400 | 930 |
| Texas | 681,900 | 3,290 | 482,900 | 2,330 | 218,500 | 1,050 |
| Utah | 25,400 | 1,180 | 15,900 | 740 | 11,700 | 540 |
| Vermont | 7,400 | 1,450 | 5,800 | 1,150 | 1,700 | 340 |
| Virginia | 120,000 | 1,830 | 62,500 | 950 | 57,500 | 880 |
| Washington | 127,000 | 2,230 | 100,600 | 1,760 | 30,400 | 530 |
| West Virginia | 20,100 | 1,380 | 10,100 | 690 | 10,100 | 690 |
| Wisconsin | 100,500 | 2,230 | 64,900 | 1,440 | 35,600 | 790 |
| Wyoming | 9,400 | 2,100 | 5,500 | 1,230 | 3,900 | 870 |
| State | 6,262,000 | 2,500 | 4,405,400 | 1,760 | 1,942,600 | 780 |
| Federal | 320,000 | 130 | 131,700 | 50 | 188,400 | 80 |
| U.S. total | 6,582,100 | 2,630 | 4,537,100 | 1,810 | 2,131,000 | 850 |
Male and female incarceration and correctional supervision numbers
| Community supervision (parole, probation, etc.) | Incarcerated | |||||||||
|---|---|---|---|---|---|---|---|---|---|---|
| Number | Rate per 100,000 U.S. residents of all ages | Number | Rate per 100,000 U.S. residents of all ages | |||||||
| Jurisdiction | Total | Male | Female | Male | Female | Total | Male | Female | Male | Female |
| U.S. total | 4,650,900 | 3,594,300 | 1,056,700 | 2,260 | 640 | 2,145,100 | 1,942,500 | 202,600 | 1,600 | 160 |
| Federal | 132,800 | 109,200 | 23,700 | 70 | 10 | 195,700 | 182,800 | 12,900 | 150 | 10 |
| State | 4,518,100 | 3,485,100 | 1,033,000 | 2,190 | 630 | 1,949,400 | 1,759,700 | 189,800 | 1,450 | 150 |
| Alabama | 64,600 | 50,600 | 14,000 | 2,140 | 560 | 42,900 | 38,600 | 4,300 | 1,640 | 170 |
| Alaska | 8,500 | 6,600 | 1,900 | 1,700 | 550 | 5,400 | 4,800 | 600 | 1,230 | 170 |
| Arizona | 83,300 | 66,700 | 16,700 | 1,950 | 480 | 54,900 | 49,100 | 5,800 | 1,440 | 170 |
| Arkansas | 51,500 | 39,000 | 12,500 | 2,660 | 820 | 24,000 | 21,200 | 2,800 | 1,450 | 180 |
| California | 349,600 | 277,500 | 72,100 | 1,420 | 360 | 201,000 | 186,000 | 15,100 | 950 | 80 |
| Colorado | 89,200 | 66,700 | 22,400 | 2,410 | 820 | 31,800 | 28,000 | 3,800 | 1,010 | 140 |
| Connecticut | 45,300 | 35,700 | 9,500 | 2,040 | 520 | 15,800 | 14,700 | 1,100 | 840 | 60 |
| Delaware | 16,100 | 12,400 | 3,700 | 2,690 | 760 | 6,700 | 6,100 | 500 | 1,330 | 110 |
| District of Columbia | 9,900 | 8,500 | 1,400 | 2,640 | 400 | 1,800 | 1,700 | 100 | 530 | 30 |
| Florida | 225,400 | 167,000 | 58,400 | 1,670 | 560 | 153,000 | 137,900 | 15,100 | 1,380 | 140 |
| Georgia | 451,800 | 353,600 | 98,200 | 7,060 | 1,870 | 88,500 | 79,600 | 8,900 | 1,590 | 170 |
| Hawaii | 22,500 | 17,200 | 5,300 | 2,360 | 740 | 5,900 | 5,200 | 700 | 710 | 100 |
| Idaho | 37,800 | 28,100 | 9,700 | 3,370 | 1,160 | 10,900 | 9,300 | 1,600 | 1,120 | 190 |
| Illinois | 151,300 | 118,200 | 33,100 | 1,870 | 510 | 63,900 | 59,500 | 4,400 | 940 | 70 |
| Indiana | 122,500 | 93,100 | 29,400 | 2,850 | 870 | 43,500 | 38,200 | 5,200 | 1,170 | 160 |
| Iowa | 35,600 | 26,900 | 8,700 | 1,730 | 550 | 12,900 | 11,500 | 1,400 | 740 | 90 |
| Kansas | 20,900 | 16,400 | 4,500 | 1,120 | 310 | 16,600 | 14,800 | 1,800 | 1,010 | 130 |
| Kentucky | 70,600 | 49,400 | 21,300 | 2,260 | 940 | 33,800 | 28,700 | 5,100 | 1,310 | 230 |
| Louisiana | 71,900 | 57,400 | 14,500 | 2,510 | 600 | 49,000 | 45,400 | 3,600 | 1,980 | 150 |
| Maine | 6,700 | 5,400 | 1,400 | 820 | 200 | 4,000 | 3,500 | 500 | 540 | 70 |
| Maryland | 87,400 | 71,800 | 15,600 | 2,460 | 500 | 29,700 | 27,800 | 1,900 | 950 | 60 |
| Massachusetts | 66,900 | 52,600 | 14,300 | 1,590 | 410 | 20,100 | 19,000 | 1,200 | 570 | 30 |
| Michigan | 193,900 | 147,700 | 46,100 | 3,020 | 910 | 57,700 | 53,100 | 4,600 | 1,090 | 90 |
| Minnesota | 105,100 | 81,000 | 24,000 | 2,960 | 870 | 16,500 | 14,800 | 1,600 | 540 | 60 |
| Mississippi | 44,800 | 35,500 | 9,300 | 2,440 | 600 | 28,000 | 25,800 | 2,300 | 1,770 | 150 |
| Missouri | 62,600 | 47,600 | 15,000 | 1,590 | 480 | 43,400 | 38,500 | 4,900 | 1,290 | 160 |
| Montana | 9,700 | 7,400 | 2,300 | 1,430 | 440 | 5,600 | 4,800 | 800 | 930 | 150 |
| Nebraska | 13,700 | 10,000 | 3,700 | 1,050 | 390 | 8,600 | 7,700 | 900 | 810 | 100 |
| Nevada | 19,200 | 15,200 | 4,000 | 1,040 | 270 | 19,100 | 16,800 | 2,300 | 1,150 | 160 |
| New Hampshire | 6,300 | 4,900 | 1,400 | 750 | 210 | 4,600 | 4,100 | 500 | 620 | 80 |
| New Jersey | 151,300 | 117,700 | 33,700 | 2,690 | 730 | 33,900 | 31,700 | 2,200 | 720 | 50 |
| New Mexico | 16,800 | 12,600 | 4,200 | 1,210 | 400 | 15,100 | 13,300 | 1,800 | 1,290 | 170 |
| New York | 145,600 | 120,500 | 25,000 | 1,250 | 250 | 75,900 | 71,100 | 4,800 | 740 | 50 |
| North Carolina | 97,400 | 73,400 | 24,000 | 1,490 | 460 | 53,800 | 48,800 | 5,000 | 990 | 100 |
| North Dakota | 6,900 | 5,100 | 1,800 | 1,300 | 490 | 3,200 | 2,700 | 400 | 690 | 120 |
| Ohio | 262,000 | 189,700 | 72,300 | 3,330 | 1,220 | 70,700 | 62,800 | 7,900 | 1,100 | 130 |
| Oklahoma | 33,400 | 25,700 | 7,700 | 1,320 | 390 | 39,700 | 34,400 | 5,300 | 1,770 | 270 |
| Oregon | 61,900 | 49,600 | 12,300 | 2,470 | 600 | 21,000 | 18,600 | 2,400 | 930 | 120 |
| Pennsylvania | 296,200 | 223,500 | 72,700 | 3,560 | 1,110 | 83,900 | 76,300 | 7,600 | 1,220 | 120 |
| Rhode Island | 24,400 | 20,600 | 3,800 | 4,010 | 690 | 3,200 | 3,100 | 100 | 600 | 30 |
| South Carolina | 38,500 | 30,500 | 8,000 | 1,280 | 320 | 31,600 | 28,900 | 2,800 | 1,210 | 110 |
| South Dakota | 9,800 | 7,500 | 2,300 | 1,720 | 540 | 5,300 | 4,600 | 800 | 1,050 | 180 |
| Tennessee | 75,400 | 57,100 | 18,300 | 1,770 | 540 | 48,000 | 41,600 | 6,500 | 1,290 | 190 |
| Texas | 488,800 | 375,200 | 113,600 | 2,730 | 810 | 214,800 | 192,500 | 22,300 | 1400 | 160 |
| Utah | 15,700 | 12,000 | 3,700 | 790 | 240 | 11,700 | 10,100 | 1,600 | 660 | 110 |
| Vermont | 6,300 | 4,800 | 1,500 | 1,550 | 470 | 1,800 | 1,600 | 200 | 520 | 50 |
| Virginia | 57,000 | 43,700 | 13,300 | 1,060 | 310 | 57,300 | 51,000 | 6,300 | 1,230 | 150 |
| Washington | 104,700 | 81,600 | 23,200 | 2,260 | 640 | 29,700 | 26,300 | 3,400 | 730 | 90 |
| West Virginia | 10,100 | 7,300 | 2,800 | 800 | 300 | 10,100 | 8,700 | 1,400 | 950 | 150 |
| Wisconsin | 65,600 | 52,700 | 12,900 | 1,830 | 440 | 35,000 | 31,800 | 3,100 | 1,110 | 110 |
| Wyoming | 5,900 | 4,300 | 1,600 | 1,450 | 550 | 3,900 | 3,400 | 600 | 1,130 | 200 |
Juvenile detention
See also
References
- 1 2 3 4 5 Correctional Populations in the United States, 2016 (NCJ 251211). Published April 2018 by U.S. Bureau of Justice Statistics (BJS). By Danielle Kaeble and Mary Cowhig, BJS statisticians. See PDF. Appendix table 1 on page 11 has rates and counts by state. See page 1 "highlights" section for the "1 in ..." numbers. See table 4 on page 4 for a timeline of nationwide incarceration rates. See appendix table 3 on page 13, for "Persons held in custody in state or federal prisons or in local jails, 2000, 2010, and 2015–2016". That table also has incarceration rates. See appendix table 2 on page 12 for the number or persons incarcerated in territorial prisons, military facilities, and jails in Indian country.
- ↑ Walmsley, Roy (30 Jan 2009). World Prison Population List (8th Edition). From World Prison Population Lists. By World Prison Brief. "The information is the latest available in early December 2008. … Most figures relate to dates between the beginning of 2006 and the end of November 2008." According to the summary on page one there were 2.29 million U.S. inmates and 9.8 million inmates worldwide. The U.S. held 23.4% of the world's inmates. The U.S. total in this report is for December 31, 2007 (see page 3), and does not include inmates in juvenile detention facilities.
- 1 2 Highest to Lowest. World Prison Brief (WPB). Use dropdown menu to choose lists of countries by region, or the whole world. Use menu to select highest-to-lowest lists of prison population totals, prison population rates, percentage of pre-trial detainees / remand prisoners, percentage of female prisoners, percentage of foreign prisoners, and occupancy rate. Column headings in WPB tables can be clicked to reorder columns lowest to highest, or alphabetically. For detailed information for each country click on any country name in lists. See also the WPB main data page and click on the map links and/or the sidebar links to get to the region and country desired.
- ↑ United States of America. By World Prison Brief.
- ↑ Mahapatra, Lisa (19 March 2014). Incarcerated In America: Why Are So Many People In US Prisons? (CHARTS). International Business Times. Chart showing incarceration rates of 50 most populous countries. Another chart showing what the inmates in the USA are in for (does not indicate reasons for probation and parole violations. Those offenses, such as drug tests, etc. change the breakdown of what inmates are in for).
- ↑ National Research Council. The Growth of Incarceration in the United States: Exploring Causes and Consequences. Washington, DC: The National Academies Press, 2014. Retrieved May 10, 2014: "The U.S. penal population of 2.2 million adults is by far the largest in the world. Just under one-quarter of the world's prisoners are held in American prisons."
- ↑ One in 100: Behind Bars in America 2008. February 28, 2008. The Pew Center on the States.
- ↑ Liptak, Adam (28 Feb 2008). 1 in 100 U.S. Adults Behind Bars, New Study Says. New York Times.
- ↑ World Female Imprisonment List (fourth edition). Nov. 9, 2017. World Prison Brief.
- ↑ Correctional Populations in the United States, 2015. By Danielle Kaeble and Lauren Glaze, BJS Statisticians. Dec. 2016. Bureau of Justice Statistics. See PDF. Appendix table 3 on page 15 says there are 1,942,500 male and 202,600 female inmates in prisons and jails. That is 10.4% female.
- ↑ Carlen, Pat (2004). Analysing Women's Imprisonment. Portland: Willan Publishing. p. 42.
- ↑ Canada. World Prison Brief.
- ↑ United Kingdom: England & Wales. World Prison Brief.
- ↑ Australia. World Prison Brief.
- ↑ Spain. World Prison Brief.
- ↑ France. World Prison Brief.
- ↑ Germany. World Prison Brief.
- ↑ Norway. World Prison Brief.
- ↑ Netherlands. World Prison Brief.
- ↑ Japan. World Prison Brief.
- ↑ Alexander, Michelle (2010). The New Jim Crow: Mass Incarceration in the Age of Colorblindness. New York: The New Press. p. 7.
- ↑ Correctional Populations in the United States, 2015. By Danielle Kaeble and Lauren Glaze, BJS Statisticians. Dec. 2016. Bureau of Justice Statistics. See PDF. Appendix table 3 on page 14 has male and female counts and rates by state. It says there are 1,942,500 male and 202,600 female inmates in prisons and jails. That is 10.4% female.
- ↑ Sickmund, M., Sladky, T.J., Kang, W., & Puzzanchera, C.. "Easy Access to the Census of Juveniles in Residential Placement". Click "National Crosstabs" at the top, and then choose the census years. Click "Show table" to get the total number of juvenile inmates for those years. Or go here for all the years. Office of Juvenile Justice and Delinquency Prevention.
External links
| Demographics | |
|---|---|
| Economy | |
| Environment | |
| Geography | |
| Government |
|
| Health | |
| History | |
| Law | |
| Miscellaneous | |
| |
Rate Per 100,000 and Rank by State of Crime and Imprisionment by US States 1978 - 2012 Crime,Punishment and Ratio of Crime to Punishment Per 100,000 and Rank by Year and between States