List of U.S. states and territories by area
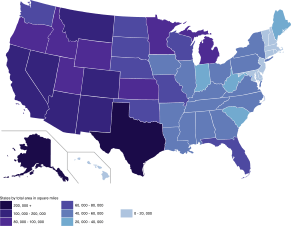
States by area. Alaska is depicted at a smaller scale in the inset.
This is a complete list of the states of the United States and its major territories ordered by total area, land area, and water area. The water area includes inland waters, coastal waters, the Great Lakes, and territorial waters. Glaciers and intermittent bodies of water are counted as land area.[1]
Area by state/territory
| Total area[2] | Land area[2] | Water[2] | |||||||||
|---|---|---|---|---|---|---|---|---|---|---|---|
| State/territory | Rank | sq mi | km² | Rank | sq mi | km² | % land | Rank | sq mi | km² | % water |
| 1 | 665,384.04 | 1,723,337 | 1 | 570,640.95 | 1,477,953 | 85.76% | 1 | 94,743.10 | 245,384 | 14.24% | |
| 2 | 268,596.46 | 695,662 | 2 | 261,231.71 | 676,587 | 97.26% | 8 | 7,364.75 | 19,075 | 2.74% | |
| 3 | 163,696.32 | 423,972 | 3 | 155,779.22 | 403,466 | 95.16% | 6 | 7,915.52 | 20,501 | 4.84% | |
| 4 | 147,039.71 | 380,831 | 4 | 145,545.80 | 376,962 | 98.98% | 26 | 1,493.91 | 3,869 | 1.02% | |
| 5 | 121,590.30 | 314,917 | 5 | 121,298.15 | 314,161 | 99.76% | 49 | 292.15 | 757 | 0.24% | |
| 6 | 113,990.30 | 295,234 | 6 | 113,594.08 | 294,207 | 99.65% | 48 | 396.22 | 1,026 | 0.35% | |
| 7 | 110,571.82 | 286,380 | 7 | 109,781.18 | 284,332 | 99.28% | 36 | 790.65 | 2,048 | 0.72% | |
| 8 | 104,093.67 | 269,601 | 8 | 103,641.89 | 268,431 | 99.57% | 44 | 451.78 | 1,170 | 0.43% | |
| 9 | 98,378.54 | 254,799 | 10 | 95,988.01 | 248,608 | 97.57% | 20 | 2,390.53 | 6,191 | 2.43% | |
| 10 | 97,813.01 | 253,335 | 9 | 97,093.14 | 251,470 | 99.26% | 37 | 719.87 | 1,864 | 0.74% | |
| 11 | 96,713.51 | 250,487 | 22 | 56,538.90 | 146,435 | 58.46% | 2 | 40,174.61 | 104,052 | 41.54% | |
| 12 | 86,935.83 | 225,163 | 14 | 79,626.74 | 206,232 | 91.59% | 9 | 7,309.09 | 18,930 | 8.41% | |
| 13 | 84,896.88 | 219,882 | 12 | 82,169.62 | 212,818 | 96.79% | 17 | 2,727.26 | 7,064 | 3.21% | |
| 14 | 83,568.95 | 216,443 | 11 | 82,643.12 | 214,045 | 98.89% | 33 | 925.83 | 2,398 | 1.11% | |
| 15 | 82,278.36 | 213,100 | 13 | 81,758.72 | 211,754 | 99.37% | 42 | 519.64 | 1,346 | 0.63% | |
| 16 | 77,347.81 | 200,330 | 15 | 76,824.17 | 198,974 | 99.32% | 41 | 523.64 | 1,356 | 0.68% | |
| 17 | 77,115.68 | 199,729 | 16 | 75,811.00 | 196,350 | 98.31% | 29 | 1,304.68 | 3,379 | 1.69% | |
| 18 | 71,297.95 | 184,661 | 20 | 66,455.52 | 172,119 | 93.21% | 11 | 4,842.43 | 12,542 | 6.79% | |
| 19 | 70,698.32 | 183,108 | 17 | 69,000.80 | 178,711 | 97.60% | 24 | 1,697.52 | 4,397 | 2.40% | |
| 20 | 69,898.87 | 181,037 | 19 | 68,594.92 | 177,660 | 98.13% | 30 | 1,303.95 | 3,377 | 1.87% | |
| 21 | 69,706.99 | 180,540 | 18 | 68,741.52 | 178,040 | 98.61% | 32 | 965.47 | 2,501 | 1.39% | |
| 22 | 65,757.70 | 170,312 | 26 | 53,624.76 | 138,887 | 81.55% | 3 | 12,132.94 | 31,424 | 18.45% | |
| 23 | 65,496.38 | 169,635 | 25 | 54,157.80 | 140,268 | 82.69% | 4 | 11,338.57 | 29,367 | 17.31% | |
| 24 | 59,425.15 | 153,910 | 21 | 57,513.49 | 148,959 | 96.78% | 22 | 1,911.66 | 4,951 | 3.22% | |
| 25 | 57,913.55 | 149,995 | 24 | 55,518.93 | 143,793 | 95.87% | 19 | 2,394.62 | 6,202 | 4.13% | |
| 26 | 56,272.81 | 145,746 | 23 | 55,857.13 | 144,669 | 99.26% | 45 | 415.68 | 1,077 | 0.74% | |
| 27 | 54,554.98 | 141,297 | 30 | 47,126.40 | 122,057 | 86.38% | 7 | 7,428.58 | 19,240 | 13.62% | |
| 28 | 53,819.16 | 139,391 | 29 | 48,617.91 | 125,920 | 90.34% | 10 | 5,201.25 | 13,471 | 9.66% | |
| 29 | 53,178.55 | 137,732 | 27 | 52,035.48 | 134,771 | 97.85% | 31 | 1,143.07 | 2,961 | 2.15% | |
| 30 | 52,420.07 | 135,767 | 28 | 50,645.33 | 131,171 | 96.61% | 23 | 1,774.74 | 4,597 | 3.39% | |
| 31 | 52,378.13 | 135,659 | 33 | 43,203.90 | 111,898 | 82.48% | 5 | 9,174.23 | 23,761 | 17.52% | |
| 32 | 48,431.78 | 125,438 | 31 | 46,923.27 | 121,531 | 96.89% | 25 | 1,508.51 | 3,907 | 3.11% | |
| 33 | 46,054.35 | 119,280 | 32 | 44,742.70 | 115,883 | 97.15% | 28 | 1,311.64 | 3,397 | 2.85% | |
| 34 | 44,825.58 | 116,098 | 35 | 40,860.69 | 105,829 | 91.15% | 14 | 3,964.89 | 10,269 | 8.85% | |
| 35 | 42,774.93 | 110,787 | 36 | 39,490.09 | 102,279 | 92.32% | 15 | 3,284.84 | 8,508 | 7.68% | |
| 36 | 42,144.25 | 109,153 | 34 | 41,234.90 | 106,798 | 97.84% | 35 | 909.36 | 2,355 | 2.16% | |
| 37 | 40,407.80 | 104,656 | 37 | 39,486.34 | 102,269 | 97.72% | 34 | 921.46 | 2,387 | 2.28% | |
| 38 | 36,419.55 | 94,326 | 38 | 35,826.11 | 92,789 | 98.37% | 39 | 593.44 | 1,537 | 1.63% | |
| 39 | 35,379.74 | 91,633 | 39 | 30,842.92 | 79,883 | 87.18% | 12 | 4,536.82 | 11,750 | 12.82% | |
| 40 | 32,020.49 | 82,933 | 40 | 30,060.70 | 77,857 | 93.88% | 21 | 1,959.79 | 5,076 | 6.12% | |
| 41 | 24,230.04 | 62,756 | 41 | 24,038.21 | 62,259 | 99.21% | 50 | 191.83 | 497 | 0.79% | |
| 42 | 12,405.93 | 32,131 | 42 | 9,707.24 | 25,142 | 78.25% | 18 | 2,698.69 | 6,990 | 21.75% | |
| 43 | 10,931.72 | 28,313 | 47 | 6,422.63 | 16,635 | 58.75% | 13 | 4,509.09 | 11,678 | 41.25% | |
| 44 | 10,554.39 | 27,336 | 45 | 7,800.06 | 20,202 | 73.90% | 16 | 2,754.33 | 7,134 | 26.10% | |
| 45 | 9,616.36 | 24,906 | 43 | 9,216.66 | 23,871 | 95.84% | 46 | 399.71 | 1,035 | 4.16% | |
| 46 | 9,349.16 | 24,214 | 44 | 8,952.65 | 23,187 | 95.76% | 47 | 396.51 | 1,027 | 4.24% | |
| 47 | 8,722.58 | 22,591 | 46 | 7,354.22 | 19,047 | 84.31% | 27 | 1,368.36 | 3,544 | 15.69% | |
| 48 | 5,543.41 | 14,357 | 48 | 4,842.36 | 12,542 | 87.35% | 38 | 701.06 | 1,816 | 12.65% | |
| 49 | 2,488.72 | 6,446 | 49 | 1,948.54 | 5,047 | 78.29% | 40 | 540.18 | 1,399 | 21.71% | |
| 50 | 1,544.89 | 4,001 | 50 | 1,033.81 | 2,678 | 66.92% | 43 | 511.07 | 1,324 | 33.08% | |
| 68.34 | 177 | 61.05 | 158 | 89.33% | 7.29 | 19 | 10.67% | ||||
| 5,324.84 | 13,791 | 3,423.78 | 8,868 | 64.30% | 1,901.07 | 4,924 | 35.70% | ||||
| 1,975.57 | 5,117 | 182.33 | 472 | 9.23% | 1,793.24 | 4,644 | 90.77% | ||||
| 732.93 | 1,898 | 134.32 | 348 | 18.33% | 598.61 | 1,550 | 81.67% | ||||
| 581.05 | 1,505 | 76.46 | 198 | 13.16% | 504.60 | 1,307 | 86.84% | ||||
| 570.62 | 1,478 | 209.80 | 543 | 36.77% | 360.82 | 935 | 63.23% | ||||
| 16.00 | 41 | 16.00 | 41 | — | — | — | — | ||||
| Total | 3,120,426.47 | 8,081,867 | 2,954,841.42 | 7,653,004 | 94.69% | 165,584.6 | 428,862 | 5.31% | |||
| Total | 3,796,742.23 | 9,833,517 | 3,531,905.43 | 9,147,593 | 93.02% | 264,836.79 | 685,924 | 6.98% | |||
| Total | 3,805,943.26 | 9,857,348 | 3,535,948.12 | 9,158,064 | 92.91% | 269,995.13 | 699,284 | 7.09% | |||
Area by division
All divisions presented below are as configured by the United States Census Bureau.
| Total area[2] | Land area[2] | Water[2] | |||||||||
|---|---|---|---|---|---|---|---|---|---|---|---|
| Division | Rank | sq mi | km² | Rank | sq mi | km² | % land | Rank | sq mi | km² | % water |
| East North Central | 5 | 301,368.57 | 780,541 | 6 | 242,902.44 | 629,114 | 2 | 58,466.13 | 151,427 | ||
| East South Central | 7 | 183,403.89 | 475,014 | 7 | 178,289.83 | 461,769 | 9 | 5,114.60 | 13,247 | ||
| Middle Atlantic | 8 | 109,331.89 | 283,168 | 8 | 99,223.32 | 256,987 | 6 | 10,108.57 | 26,181 | ||
| Mountain | 2 | 863,564.63 | 2,236,622 | 2 | 855,766.98 | 2,216,426 | 8 | 7,797.65 | 20,196 | ||
| New England | 9 | 71,987.96 | 186,448 | 9 | 62,668.46 | 162,311 | 7 | 9,299.50 | 24,086 | ||
| Pacific | 1 | 1,009,687.00 | 2,615,077 | 1 | 895,286.33 | 2,318,781 | 1 | 114,400.67 | 296,296 | ||
| South Atlantic | 6 | 292,990.46 | 758,842 | 5 | 265,061.97 | 686,507 | 3 | 27,928.49 | 72,334 | ||
| West North Central | 3 | 520,355.80 | 1,347,715 | 3 | 507,620.08 | 1,314,730 | 5 | 12,735.72 | 32,985 | ||
| West South Central | 4 | 444,052.01 | 1,150,089 | 4 | 425,066.01 | 1,100,916 | 4 | 18,986.00 | 49,174 | ||
Area by region
All regions presented below are as configured by the United States Census Bureau.
| Total area[2] | Land area[2] | Water[2] | |||||||||
|---|---|---|---|---|---|---|---|---|---|---|---|
| Region | Rank | sq mi | km² | Rank | sq mi | km² | % land | Rank | sq mi | km² | % water |
| Midwest | 3 | 821,724.38 | 2,128,256 | 3 | 750,522.52 | 1,943,844 | 2 | 71,201.86 | 184,412 | ||
| Northeast | 4 | 181,319.85 | 469,616 | 4 | 161,911.78 | 419,350 | 4 | 19,408.07 | 50,267 | ||
| South | 2 | 920,446.37 | 2,383,945 | 2 | 868,417.82 | 2,249,192 | 3 | 52,028.55 | 134,753 | ||
| West | 1 | 1,873,251.63 | 4,851,699 | 1 | 1,751,053.31 | 4,535,207 | 1 | 122,198.32 | 316,492 | ||
- U.S. states by total area
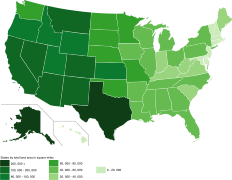 U.S. states by land area
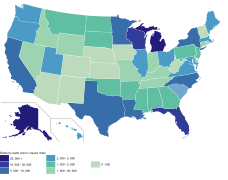 U.S. states by water area
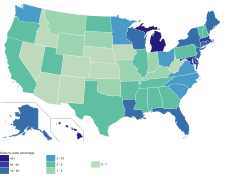 U.S. states by water percentage
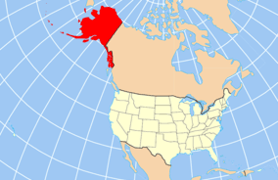
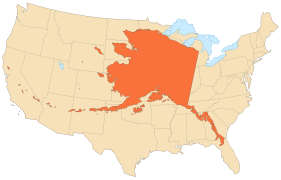 The area of Alaska is 18% of the area of the United States and 21% of the area of the contiguous United States
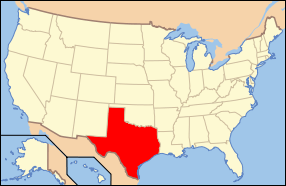 The second largest state, Texas, is only 40% of the total area of the largest state, Alaska
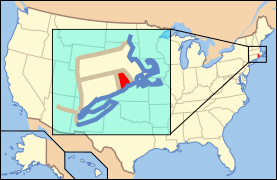 Rhode Island is the smallest state by total area and land area
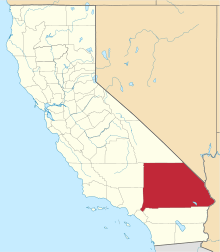 San Bernardino County is the largest county in the contiguous U.S. and is larger than each of the nine smallest states; it is larger than the four smallest states combined.
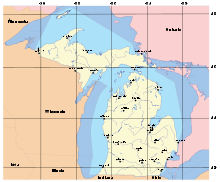 Michigan is second (after Alaska) in water area, and first in water percentage
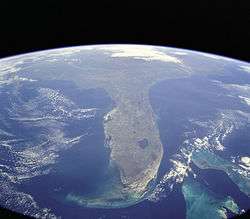 Florida is mostly a peninsula, and has the third largest water area and seventh largest water area percentage
See also
Notes
References
- ↑ "Census 2000 Geographic Terms and Concepts", Census 2000 Geography Glossary, U.S. Census Bureau. Retrieved 2007-07-10.
- 1 2 3 4 5 6 7 8 9 10 "United States Summary: 2010, Population and Housing Unit Counts, 2010 Census of Population and Housing" (PDF). United States Census Bureau. September 2012. pp. V&ndash, 2, 1 & 41 (Tables 1 & 18). Retrieved February 7, 2014.
- ↑ "United States Summary: 2010, Population and Housing Unit Counts, 2000 Census of Population and Housing" (PDF). United States Census Bureau. April 2004. p. 1 (Table 1). Retrieved February 10, 2014.
- ↑ "World Factbook Country Comparison: Area", CIA World Factbook, CIA. Retrieved 2018-08-01.
| Demographics | |
|---|---|
| Economy | |
| Environment | |
| Geography | |
| Government |
|
| Health | |
| History | |
| Law | |
| Miscellaneous | |
| |
This article is issued from
Wikipedia.
The text is licensed under Creative Commons - Attribution - Sharealike.
Additional terms may apply for the media files.