List of Pakistani provinces by gross domestic product
This is a list of provinces of Pakistan by their gross state product (GSP) (the value of the total economy, and goods and services produced in the respective province) in nominal terms. GSP is the provincial-level counterpart of the national gross domestic product (GDP), the most comprehensive measure of a country's economic activity.
Dynamics
Pakistan, as of 2017, had a gross domestic product (GDP) of $304 billion US$.[1] This value can be further divided into the provincial levels (GSP), providing an outlook of how much value each province contributes to the national GDP. Pakistan has traditionally followed a "top-down" approach in its analysis of economic development; that is, authorities have scarcely attempted to break up national GDP statistics into provincial and subnational units and have focused more on the federation as a whole. Thus, many accounts of provincial GDPs that do exist have usually been projected estimates made by economists, based on the likely percentage of contribution of the respective province to the national GDP and some yearly studies.
As of 2010, Punjab had the largest economy in Pakistan (contributing 57.5% to Pakistan's GDP), followed by Sindh (27%), Khyber Pakhtunkhwa (8%) Balochistan (3%) Azad Kashmir(2.3%) and Gilgit-Baltistan (1.5%) respectively. Islamabad, the capital entity, contributes about 1%; while FATA contribute 1.5% according to economist.[2]
Punjab, which is the largest province in terms of population, dominates other provinces in contributing to the national economy. As of 2017, Punjab had a GDP of $173 billion[3] which has steadily continued to grow. It is featured well within the list of country subdivisions with a GDP over $100 billion. Sindh's GDP with 83 billion is to a large extent influenced by the economy of Karachi, its capital and Pakistan's largest city.
Provinces by GDP (nominal)
Figures are derived from statistics in 2017
| Province or territory | GDP (Billions USD) |
GDP per capita USD |
|---|---|---|
| 173.51 | 1,577 | |
| 83.71 | 1,748 | |
| 27.39 | 771 | |
| 9.13 | 740 | |
| 7.00[4] | 1,730 | |
| 4.60 | 1,550[5] | |
| 3.04 | 2,996 | |
| 304.4 |
|---|
Provinces by GDP (PPP)
Figures are derived from statistics in 2017
| Province or territory | GDP (Billions USD) |
GDP per capita USD |
|---|---|---|
| 603.81 | 5,488 | |
| 291.31 | 6,083 | |
| 95.32 | 2,683 | |
| 31.77 | 2,575 | |
| 24.36[4] | 6,020 | |
| 16.00 | 5,394[5] | |
| 10.58 | 10,426 | |
| 1,060 |
|---|
Top cities by GDP (PPP)

The table below lists the top cities by their PPP GDP, based on a 2016 PricewaterhouseCoopers study and is not comparable with the figures listed in the table above.[6]
| Rank | City | Province | 2017 PPP GDP (in USD) |
Population |
|---|---|---|---|---|
| 1 | Karachi | Sindh | $212 billion | 16.05 million |
| 2 | Lahore | Punjab | $127 billion | 11.17 million |
| 3 | Faisalabad | Punjab | $64 billion | 4.375 million |
| Rank | City | Province | 2017 Nominal GDP (in USD) |
Population |
|---|---|---|---|---|
| 1 | Karachi | Sindh | $64 billion | 16.05 million |
| 2 | Lahore | Punjab | $35 billion | 11.17 million |
| 3 | Faisalabad | Punjab | $18 billion | 4.375 million |
Top cities by GDP (Nominal)
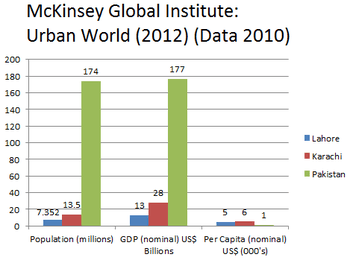
The table below lists the top cities by their Nominal GDP in 2011, based on a study by the McKinsey Global Institute[8]
| Rank | City | Province | 2017 Nominal GDP (in USD) |
Population | Per Capita Income (in USD) |
|---|---|---|---|---|---|
| 1 | Karachi | Sindh | $64 billion | 16.05 million | $6,000 |
| 2 | Lahore | Punjab | $35 billion | 11.7 million | $5,000 |
See also
References
- ↑ Haider, Mehtab. "Size of Pakistan's Economy now 304 Billion". The News International. The News International.
- ↑ "Economics and Extremism". Dawn News. Shahid Javed Barki. Retrieved 10 July 2017.
- ↑ Express Tribune. Express Tribune https://tribune.com.pk/story/1257749/punjabs-gdp-higher-many-countries/. Retrieved 16 July 2017.
|first1=missing|last1=in Authors list (help); Missing or empty|title=(help) - 1 2 "Rejuvenating the economic environment in Jammu & Kashmir" (PDF). CRC. September 2013. Retrieved 21 September 2016.
- 1 2 "Health Budget and Expenditure Analysis (2008-09 to 2010-11)". Technical Resource Facility. May 2012. Retrieved 21 September 2016.
- 1 2 Emerging market city economies set to rise rapidly in global GDP rankings says PricewaterhouseCoopers LLP Archived 2013-05-31 at the Wayback Machine.
- ↑ "Urban world: Cities and the rise of the consuming class". Retrieved 2012-09-02.
- ↑ Urban world: Cities and the rise of the consuming class
| History | |
|---|---|
| Banking and finance | |
| Communications | |
| Transportation | |
| Industry | |
| Infrastructure | |
| Energy | |
| Taxation | |
| Institutions | |
| Society |
|
| Domestic economies | |
| See also | |