List of German states by GRP
This article is about the gross regional product (GRP) of German states in main fiscal years. Most figures are from the Federal Statistical Office of Germany; figures from other sources are otherwise referenced. The GRP of German states are shown in EUR€. For easy comparison, all the GRP figures are converted into US$ according to annual average exchange rates.
2017 List
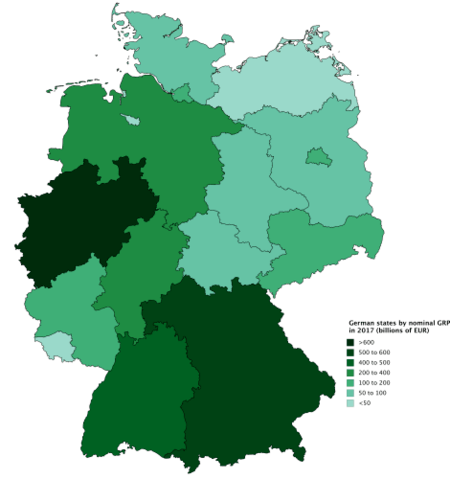
German states by nominal GRP in 2017

German states as European countries with similar Nominal GDP
| States | Rank | GRP (EUR€) | Share of GDP (%) |
Comparable economy |
|---|---|---|---|---|
| — | 3,263.35 | 100 | ||
| 1 | 691.52 | 21.2 | ||
| 2 | 594.45 | 18.2 | ||
| 3 | 493.27 | 15.1 | ||
| 4 | 287.96 | 8.8 | ||
| 5 | 279.09 | 8.6 | ||
| 6 | 144.31 | 4.4 | ||
| 7 | 136.61 | 4.2 | ||
| 8 | 121.74 | 3.8 | ||
| 9 | 117.57 | 3.6 | ||
| 10 | 93.37 | 2.9 | ||
| 11 | 69.13 | 2.1 | ||
| 12 | 61.91 | 1.9 | ||
| 13 | 60.69 | 1.9 | ||
| 14 | 42.78 | 1.3 | ||
| 15 | 35.30 | 1.1 | ||
| 16 | 33.66 | 1.0 |
2016 List
| States | Rank | GRP (EUR€) | Share of GDP (%) |
|---|---|---|---|
| — | 3144.05 | 100 | |
| 1 | 668.91 | 21.3 | |
| 2 | 569.81 | 18.1 | |
| 3 | 476.27 | 15.1 | |
| 4 | 276.27 | 8.8 | |
| 5 | 269.44 | 8.6 | |
| 6 | 138.50 | 4.4 | |
| 7 | 130.54 | 4.2 | |
| 8 | 118.20 | 3.8 | |
| 9 | 112.96 | 3.6 | |
| 10 | 89.82 | 2.9 | |
| 11 | 66.94 | 2.1 | |
| 12 | 59.90 | 1.9 | |
| 13 | 59.08 | 1.9 | |
| 14 | 41.02 | 1.3 | |
| 15 | 34.33 | 1.1 | |
| 16 | 32.06 | 1.0 |
2015 List
| States | Rank | GRP (EUR€) | Share of GDP (%) |
GRP per capita (EUR€) |
|---|---|---|---|---|
| — | 3,025.90 | 100 | 37,099 | |
| 1 | 645.590 | 21.3 | 36,509 | |
| 2 | 549.190 | 18.1 | 43,092 | |
| 3 | 460.687 | 15.2 | 42,745 | |
| Former GDR states and all of Berlin | — | 455.010 | 15.1 | 27,892 |
| 4 | 263.444 | 8.7 | 43,073 | |
| 5 | 258.530 | 8.5 | 32,890 | |
| 6 | 131.951 | 4.4 | 32,814 | |
| 7 | 124.161 | 4.1 | 35,627 | |
| 8 | 112.658 | 3.7 | 27,776 | |
| 9 | 109.271 | 3.6 | 61,729 | |
| 10 | 85.610 | 2.8 | 30,134 | |
| 11 | 65.294 | 2.2 | 26,493 | |
| 12 | 56.811 | 1.9 | 26,364 | |
| 13 | 56.217 | 1.9 | 25,198 | |
| 14 | 39.869 | 1.3 | 24,909 | |
| 15 | 35.028 | 1.2 | 35,409 | |
| 16 | 31.590 | 1.0 | 47,603 |
2013 List
| States | Rank | GRP (EUR€) | GRP (US$) | Share of GDP (%) |
|---|---|---|---|---|
| — | 2,737.600 | 3,635.807 | 100 | |
| 1 | 599.750 | 796.528 | 21.91 | |
| 2 | 487.990 | 648.100 | 17.83 | |
| 3 | 407.240 | 540.855 | 14.88 | |
| 4 | 238.980 | 317.389 | 8.73 | |
| 5 | 235.680 | 313.007 | 8.61 | |
| 6 | 121.580 | 161.470 | 4.44 | |
| 7 | 109.190 | 145.015 | 3.99 | |
| 8 | 99.890 | 132.664 | 3.65 | |
| 9 | 97.730 | 129.795 | 3.57 | |
| 10 | 78.700 | 104.521 | 2.87 | |
| 11 | 59.130 | 78.531 | 2.16 | |
| 12 | 51.030 | 67.773 | 1.86 | |
| 13 | 53.000 | 70.389 | 1.94 | |
| 14 | 37.060 | 49.219 | 1.35 | |
| 15 | 32.060 | 42.579 | 1.17 | |
| 16 | 28.580 | 37.957 | 1.04 |
2012 List
| States | Rank | GRP (EUR€) | GRP (US$) | Share of GDP (%) |
|---|---|---|---|---|
| — | 2,643.900 | 3,396.883 | 100 | |
| 1 | 582.050 | 747.818 | 22.01 | |
| 2 | 465.500 | 598.074 | 17.61 | |
| 3 | 389.490 | 500.417 | 14.73 | |
| 4 | 230.020 | 295.530 | 8.70 | |
| 5 | 229.750 | 295.183 | 8.69 | |
| 6 | 117.660 | 151.170 | 4.45 | |
| 7 | 103.600 | 133.105 | 3.92 | |
| 8 | 96.610 | 124.125 | 3.65 | |
| 9 | 95.820 | 123.110 | 3.62 | |
| 10 | 77.280 | 99.289 | 2.92 | |
| 11 | 57.770 | 74.223 | 2.19 | |
| 13 | 52.810 | 67.850 | 2.00 | |
| 12 | 49.250 | 63.276 | 1.86 | |
| 14 | 36.880 | 47.383 | 1.39 | |
| 15 | 31.710 | 40.741 | 1.20 | |
| 16 | 27.690 | 35.576 | 1.05 |
2011 List
| States | Rank | GRP (EUR€) | GRP (US$) | Share of GDP (%) |
|---|---|---|---|---|
| — | 2,570.8 | 3,578.5 | 100 | |
| 1 | 568.86 | 791.84 | 22.13 | |
| 2 | 446.44 | 621.44 | 17.37 | |
| 3 | 376.29 | 523.79 | 14.64 | |
| 4 | 228.51 | 318.08 | 8.89 | |
| 5 | 224.35 | 312.29 | 8.73 | |
| 6 | 113.22 | 157.60 | 4.40 | |
| 7 | 101.39 | 141.13 | 3.94 | |
| 8 | 95.07 | 132.34 | 3.70 | |
| 9 | 94.43 | 131.44 | 3.67 | |
| 10 | 73.63 | 102.49 | 2.86 | |
| 11 | 55.09 | 76.68 | 2.14 | |
| 13 | 51.88 | 72.22 | 2.02 | |
| 12 | 48.12 | 66.98 | 1.87 | |
| 14 | 34.99 | 48.71 | 1.36 | |
| 15 | 30.50 | 42.46 | 1.19 | |
| 16 | 28.03 | 39.02 | 1.09 |
2010 List
| States | Rank | GRP (EUR€) | GRP (US$) | Share of GDP (%) |
|---|---|---|---|---|
| — | 2,498.800 | 3,312.740 | 100 | |
| 1 | 543.030 | 719.910 | 21.73 | |
| 2 | 442.390 | 586.490 | 17.70 | |
| 3 | 361.750 | 479.580 | 14.48 | |
| 4 | 224.980 | 298.260 | 9.0 | |
| 5 | 213.971 | 283.679 | 8.56 | |
| 6 | 107.634 | 142.698 | 4.31 | |
| 7 | 94.990 | 125.930 | 3.8 | |
| 8 | 94.720 | 125.570 | 3.79 | |
| 9 | 88.310 | 117.087 | 3.5 | |
| 10 | 75.631 | 100.273 | 3.0 | |
| 11 | 55.827 | 74.002 | 2.2 | |
| 12 | 52.168 | 69.155 | 2.0 | |
| 13 | 49.870 | 66,112 | 2.0 | |
| 14 | 35.788 | 47.431 | 1.4 | |
| 15 | 30.065 | 39.850 | 1.2 | |
| 16 | 27.738 | 36.763 | 1.1 |
2009 List
| States | Rank | GRP (EUR€) | GRP (US$) | Share of GDP (%) |
|---|---|---|---|---|
| — | 2,397.10 | 3,343.48 | 100 | |
| 1 | 522.92 | 729.37 | 21.81 | |
| 2 | 423.84 | 591.17 | 17.68 | |
| 3 | 341.23 | 475.95 | 14.24 | |
| 4 | 215.29 | 300.29 | 8.98 | |
| 5 | 205.72 | 286.94 | 8.58 | |
| 6 | 102.08 | 142.38 | 4.26 | |
| 7 | 92.81 | 129.45 | 3.87 | |
| 8 | 91.84 | 128.10 | 3.83 | |
| 9 | 84.53 | 117.90 | 3.53 | |
| 10 | 73.49 | 102.50 | 3.07 | |
| 11 | 54.22 | 75.63 | 2.26 | |
| 12 | 50.44 | 70.35 | 2.10 | |
| 13 | 48.11 | 67.10 | 2.01 | |
| 14 | 35.38 | 49.35 | 1.48 | |
| 15 | 28.47 | 39.71 | 1.19 | |
| 16 | 26.73 | 37.28 | 1.12 |
2008 List
| States | Rank | GRP (EUR€) | GRP (US$) | Share of GDP (%) |
|---|---|---|---|---|
| — | 2,495.80 | 3,655.85 | 100 | |
| 1 | 547.54 | 802.04 | 21.94 | |
| 2 | 444.81 | 651.56 | 17.82 | |
| 3 | 365.06 | 534.74 | 14.63 | |
| 4 | 221.35 | 324.23 | 8.87 | |
| 5 | 213.09 | 312.13 | 8.54 | |
| 6 | 106.37 | 155.81 | 4.26 | |
| 7 | 94.92 | 139.04 | 3.80 | |
| 8 | 88.58 | 129.75 | 3.55 | |
| 9 | 87.48 | 128.14 | 3.51 | |
| 10 | 73.94 | 108.31 | 2.96 | |
| 11 | 54.37 | 79.64 | 2.18 | |
| 12 | 53.72 | 78.69 | 2.15 | |
| 13 | 50.38 | 73.80 | 2.02 | |
| 14 | 35.70 | 52.29 | 1.43 | |
| 15 | 31.05 | 45.48 | 1.24 | |
| 16 | 27.43 | 40.18 | 1.10 |
See also
References
Notes
- Federal Statistical Office of Germany
- Annual average exchange rates: GDP (in US$), according to UN Countries GDP list
- Annual exchange rates (as of 31 Dec) from OFX:
- 2008: 1 EUR = 1.4714
- 2009: 1 EUR = 1.3945
- 2010: 1 EUR = 1.3274
- 2011: 1 EUR = 1.3927
- 2012: 1 EUR = 1.2857
- 2013: 1 EUR = 1.3285
- 2014: 1 EUR = 1.3292
- 2015: 1 EUR = 1.1097
- 2016: 1 EUR = 1.1066
- 2017: 1 EUR = 1.1301
This article is issued from
Wikipedia.
The text is licensed under Creative Commons - Attribution - Sharealike.
Additional terms may apply for the media files.