List of U.S. states and territories by African-American population
The following is a list of U.S. states, territories, and the District of Columbia ranked by the proportion of African Americans in the population.
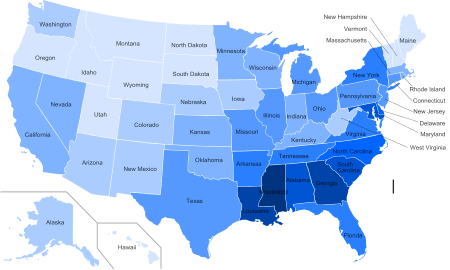
Percentage of population self-reported as African American by state in 2010:
|
less than 2%
2–5%
5–10%
10–15%
15–20%
|
20–25%
25–30%
30–35%
35–40%
|
By 2010 census results
| % African- American |
Rank | State or territory | African-American Alone Population (2010)[1] |
|---|---|---|---|
| 76.0%[2] | 1 | 80,868 | |
| 50.08% | 2 | 305,074 | |
| 37.30% | 3 | 1,974,777 | |
| 32.4% | 4 | 1,506,534 | |
| 31.4% | 5 | 3,150,435 | |
| 30.1% | 6 | 1,798,593 | |
| 28.48% | 7 | 1,290,684 | |
| 26.38% | 8 | 1,251,311 | |
| 21.60% | 9 | 2,048,628 | |
| 20.95% | 10 | 191,814 | |
| 19.91% | 11 | 1,551,399 | |
| 16.78% | 12 | 1,055,689 | |
| 15.91% | 13 | 2,999,862 | |
| 15.76% | 14 | 449,895 | |
| 15.18% | 15 | 3,073,800 | |
| 14.88% | 16 | 1,866,414 | |
| 14.46% | 17 | 1,204,826 | |
| 14.24% | 18 | 1,400,362 | |
| 12.4%[3] | 19 | 461,998 | |
| 12.04% | 20 | 1,407,681 | |
| 11.91% | 21 | 2,979,598 | |
| 11.49% | 22 | 704,043 | |
| 10.79% | 23 | 1,377,689 | |
| 10.34% | 24 | 362,296 | |
| 9.07% | 25 | 591,397 | |
| 9.0% | 26 | 255,633 | |
| 8.2% | 27 | 361,273 | |
| 8.1% | 28 | 528,761 | |
| 7.96% | 29 | 277,644 | |
| 7.5% | 30 | 79,719 | |
| 6.67% | 31 | 2,299,072 | |
| 6.15% | 32 | 167,864 | |
| 6.07% | 33 | 359,148 | |
| 4.57% | 34 | 274,412 | |
| 4.50% | 35 | 82,885 | |
| 4.28% | 36 | 201,737 | |
| 4.27% | 37 | 23,263 | |
| 4.16% | 38 | 259,008 | |
| 3.74% | 39 | 240,042 | |
| 3.58% | 40 | 63,124 | |
| 3.08% | 41 | 21,424 | |
| 2.97% | 42 | 42,550 | |
| 2.68% | 43 | 89,148 | |
| 2.01% | 44 | 69,206 | |
| 1.29% | 45 | 4,748 | |
| 1.27% | 46 | 29,287 | |
| 1.22% | 47 | 15,035 | |
| 1.14% | 48 | 10,207 | |
| 1.08% | 49 | 7,960 | |
| 1.03% | 50 | 15,707 | |
| 0.95% | 51 | 9,810 | |
| 0.87% | 52 | 6,277 | |
| 0.67% | 53 | 4,027 | |
| <2.5%[n 1] | — | <1,345 | |
| <0.6%[n 2] | — | <956 | |
| <1.2%[n 3] | — | <667 | |
African-American proportion of state populations (1790–2010)
| State/Territory | 1790 | 1800 | 1810 | 1820 | 1830 | 1840 | 1850 | 1860 | 1870 | 1880 | 1890 | 1900 | 1910 | 1920 | 1930 | 1940 | 1950 | 1960 | 1970 | 1980 | 1990 | 2000 | 2010 |
|---|---|---|---|---|---|---|---|---|---|---|---|---|---|---|---|---|---|---|---|---|---|---|---|
| 19.3% | 18.9% | 19.0% | 18.4% | 18.1% | 16.8% | 15.7% | 14.1% | 12.7% | 13.1% | 11.9% | 11.6% | 10.7% | 9.9% | 9.7% | 9.8% | 10.0% | 10.5% | 11.1% | 11.7% | 12.1% | 12.3% | 12.6% | |
| 41.4% | 29.0% | 33.2% | 38.5% | 43.3% | 44.7% | 45.4% | 47.7% | 47.5% | 44.8% | 45.2% | 42.5% | 38.4% | 35.7% | 34.7% | 32.0% | 30.0% | 26.2% | 25.6% | 25.3% | 26.0% | 26.2% | ||
| 0.3% | 0.3% | 0.2% | 0.2% | 0.2% | 3.0% | 3.0% | 3.4% | 4.1% | 3.5% | 3.3% | |||||||||||||
| 0.3% | 0.3% | 0.4% | 1.5% | 1.5% | 1.0% | 2.4% | 2.5% | 3.0% | 3.5% | 3.3% | 3.0% | 2.8% | 3.0% | 3.1% | 4.1% | ||||||||
| 13.0% | 11.7% | 15.5% | 20.9% | 22.7% | 25.6% | 25.2% | 26.3% | 27.4% | 28.0% | 28.1% | 27.0% | 25.8% | 24.8% | 22.3% | 21.8% | 18.3% | 16.3% | 15.9% | 15.7% | 15.4% | |||
| 1.0% | 1.1% | 0.8% | 0.7% | 0.9% | 0.7% | 0.9% | 1.1% | 1.4% | 1.8% | 4.4% | 5.6% | 7.0% | 7.7% | 7.4% | 6.7% | 6.2% | |||||||
| 0.1% | 1.1% | 1.3% | 1.5% | 1.6% | 1.4% | 1.2% | 1.1% | 1.1% | 1.5% | 2.3% | 3.0% | 3.5% | 4.0% | 3.8% | 4.0% | ||||||||
| 2.3% | 2.5% | 2.6% | 2.9% | 2.7% | 2.6% | 2.1% | 1.9% | 1.8% | 1.9% | 1.6% | 1.7% | 1.4% | 1.5% | 1.8% | 1.9% | 2.7% | 4.2% | 6.0% | 7.0% | 8.3% | 9.1% | 10.1% | |
| 21.6% | 22.4% | 23.8% | 24.0% | 24.9% | 25.0% | 22.2% | 19.3% | 18.2% | 18.0% | 16.8% | 16.6% | 15.4% | 13.6% | 13.7% | 13.5% | 13.7% | 13.6% | 14.3% | 16.1% | 16.9% | 19.2% | 21.4% | |
| 30.4% | 33.1% | 31.2% | 30.1% | 29.1% | 26.6% | 19.1% | 33.0% | 33.6% | 32.8% | 31.1% | 28.5% | 25.1% | 27.1% | 28.2% | 35.0% | 53.9% | 71.1% | 70.3% | 65.8% | 60.0% | 50.7% | ||
| 47.1% | 48.7% | 46.0% | 44.6% | 48.8% | 47.0% | 42.5% | 43.7% | 41.0% | 34.0% | 29.4% | 27.1% | 21.8% | 17.8% | 15.3% | 13.8% | 13.6% | 14.6% | 16.0% | |||||
| 35.9% | 37.1% | 42.5% | 44.4% | 42.6% | 41.0% | 42.4% | 44.0% | 46.0% | 47.0% | 46.7% | 46.7% | 45.1% | 41.7% | 36.8% | 34.7% | 30.9% | 28.5% | 25.9% | 26.8% | 27.0% | 28.7% | 30.5% | |
| 0.2% | 0.4% | 0.1% | 0.2% | 0.1% | 0.5% | 0.8% | 1.0% | 1.8% | 2.5% | 1.8% | 1.6% | ||||||||||||
| 0.4% | 0.2% | 0.2% | 0.2% | 0.2% | 0.2% | 0.2% | 0.1% | 0.2% | 0.2% | 0.3% | 0.3% | 0.3% | 0.4% | 0.6% | |||||||||
| 7.4% | 6.4% | 2.5% | 1.5% | 0.8% | 0.6% | 0.4% | 1.1% | 1.5% | 1.5% | 1.8% | 1.9% | 2.8% | 4.3% | 4.9% | 7.4% | 10.3% | 12.8% | 14.7% | 14.8% | 15.1% | 14.5% | ||
| 4.4% | 2.6% | 1.0% | 1.1% | 1.0% | 1.1% | 0.8% | 1.5% | 2.0% | 2.1% | 2.3% | 2.2% | 2.8% | 3.5% | 3.6% | 4.4% | 5.8% | 6.9% | 7.6% | 7.8% | 8.4% | 9.1% | ||
| 0.4% | 0.2% | 0.2% | 0.5% | 0.6% | 0.6% | 0.6% | 0.7% | 0.8% | 0.7% | 0.7% | 0.8% | 0.9% | 1.2% | 1.4% | 1.7% | 2.1% | 2.9% | ||||||
| 0.6% | 4.7% | 4.3% | 3.5% | 3.5% | 3.2% | 3.3% | 3.5% | 3.6% | 3.8% | 4.2% | 4.8% | 5.3% | 5.8% | 5.7% | 5.9% | ||||||||
| 17.0% | 18.6% | 20.2% | 22.9% | 24.7% | 24.3% | 22.5% | 20.4% | 16.8% | 16.5% | 14.4% | 13.3% | 11.4% | 9.8% | 8.6% | 7.5% | 6.9% | 7.1% | 7.2% | 7.1% | 7.1% | 7.3% | 7.8% | |
| 55.2% | 51.8% | 58.5% | 55.0% | 50.7% | 49.5% | 50.1% | 51.5% | 50.0% | 47.1% | 43.1% | 38.9% | 36.9% | 35.9% | 32.9% | 31.9% | 29.8% | 29.4% | 30.8% | 32.5% | 32.0% | |||
| 0.6% | 0.5% | 0.4% | 0.3% | 0.3% | 0.3% | 0.2% | 0.2% | 0.3% | 0.2% | 0.2% | 0.2% | 0.2% | 0.2% | 0.1% | 0.2% | 0.1% | 0.3% | 0.3% | 0.3% | 0.4% | 0.5% | 1.2% | |
| 34.7% | 36.7% | 38.2% | 36.1% | 34.9% | 32.3% | 28.3% | 24.9% | 22.5% | 22.5% | 20.7% | 19.8% | 17.9% | 16.9% | 16.9% | 16.6% | 16.5% | 16.7% | 17.8% | 22.7% | 24.9% | 27.9% | 29.4% | |
| 1.4% | 1.5% | 1.4% | 1.3% | 1.2% | 1.2% | 0.9% | 0.8% | 1.0% | 1.0% | 1.0% | 1.1% | 1.1% | 1.2% | 1.2% | 1.3% | 1.6% | 2.2% | 3.1% | 3.9% | 5.0% | 5.4% | 7.9% | |
| 3.7% | 3.0% | 2.1% | 0.8% | 0.3% | 0.6% | 0.9% | 1.0% | 0.9% | 0.7% | 0.7% | 0.6% | 1.6% | 3.5% | 4.0% | 6.9% | 9.2% | 11.2% | 12.9% | 13.9% | 14.2% | 14.2% | ||
| 0.6% | 0.2% | 0.2% | 0.2% | 0.3% | 0.3% | 0.3% | 0.4% | 0.4% | 0.4% | 0.5% | 0.7% | 0.9% | 1.3% | 2.2% | 3.5% | 5.2% | |||||||
| 41.5% | 47.0% | 44.1% | 48.4% | 52.3% | 51.2% | 55.3% | 53.7% | 57.5% | 57.6% | 58.5% | 56.2% | 52.2% | 50.2% | 49.2% | 45.3% | 42.0% | 36.8% | 35.2% | 35.6% | 36.3% | 37.0% | ||
| 17.6% | 15.9% | 18.3% | 15.6% | 13.2% | 10.0% | 6.9% | 6.7% | 5.6% | 5.2% | 4.8% | 5.2% | 6.2% | 6.5% | 7.5% | 9.0% | 10.3% | 10.5% | 10.7% | 11.2% | 11.6% | |||
| 0.9% | 0.9% | 1.0% | 0.6% | 0.2% | 0.3% | 0.2% | 0.2% | 0.2% | 0.2% | 0.3% | 0.2% | 0.3% | 0.3% | 0.4% | |||||||||
| 0.3% | 0.6% | 0.5% | 0.8% | 0.6% | 0.6% | 1.0% | 1.0% | 1.1% | 1.5% | 2.1% | 2.7% | 3.1% | 3.6% | 4.0% | 4.5% | ||||||||
| 0.7% | 0.8% | 0.8% | 0.5% | 0.3% | 0.6% | 0.4% | 0.6% | 0.6% | 2.7% | 4.7% | 5.7% | 6.4% | 6.6% | 6.8% | 8.1% | ||||||||
| 0.6% | 0.5% | 0.5% | 0.3% | 0.2% | 0.2% | 0.2% | 0.2% | 0.2% | 0.2% | 0.2% | 0.2% | 0.1% | 0.1% | 0.2% | 0.1% | 0.1% | 0.3% | 0.3% | 0.4% | 0.6% | 0.7% | 1.1% | |
| 7.7% | 8.0% | 7.6% | 7.2% | 6.4% | 5.8% | 4.9% | 3.8% | 3.4% | 3.4% | 3.3% | 3.7% | 3.5% | 3.7% | 5.2% | 5.5% | 6.6% | 8.5% | 10.7% | 12.6% | 13.4% | 13.6% | 13.7% | |
| 0.0% | 0.1% | 0.2% | 0.8% | 1.2% | 0.8% | 0.5% | 1.6% | 0.7% | 0.9% | 1.2% | 1.8% | 1.9% | 1.8% | 2.0% | 1.9% | 2.1% | |||||||
| 7.6% | 5.3% | 4.2% | 2.9% | 2.3% | 2.1% | 1.6% | 1.3% | 1.2% | 1.3% | 1.2% | 1.4% | 1.5% | 1.9% | 3.3% | 4.2% | 6.2% | 8.4% | 11.9% | 13.7% | 15.9% | 15.9% | 17.5% | |
| 26.8% | 29.4% | 32.2% | 34.4% | 35.9% | 35.6% | 36.4% | 36.4% | 36.6% | 38.0% | 34.7% | 33.0% | 31.6% | 29.8% | 29.0% | 27.5% | 25.8% | 24.5% | 22.2% | 22.4% | 22.0% | 21.6% | 21.5% | |
| 1.0% | 0.3% | 0.2% | 0.1% | 0.1% | 0.1% | 0.1% | 0.0% | 0.0% | 0.1% | 0.4% | 0.4% | 0.6% | 0.6% | 1.2% | |||||||||
| 0.5% | 0.8% | 0.8% | 1.0% | 1.1% | 1.3% | 1.6% | 2.4% | 2.5% | 2.4% | 2.3% | 2.3% | 3.2% | 4.7% | 4.9% | 6.5% | 8.1% | 9.1% | 10.0% | 10.6% | 11.5% | 12.2% | ||
| 8.4% | 7.0% | 8.3% | 7.4% | 7.2% | 7.2% | 6.5% | 6.6% | 6.7% | 6.8% | 7.4% | 7.6% | 7.4% | |||||||||||
| 0.5% | 0.2% | 0.4% | 0.3% | 0.4% | 0.3% | 0.2% | 0.3% | 0.2% | 0.2% | 0.8% | 1.0% | 1.3% | 1.4% | 1.6% | 1.6% | 1.8% | |||||||
| 2.4% | 2.7% | 2.9% | 2.9% | 2.8% | 2.8% | 2.3% | 2.0% | 1.9% | 2.0% | 2.0% | 2.5% | 2.5% | 3.3% | 4.5% | 4.7% | 6.1% | 7.5% | 8.6% | 8.8% | 9.2% | 10.0% | 10.8% | |
| 8.0% | 12.4% | ||||||||||||||||||||||
| 6.3% | 5.3% | 4.8% | 4.3% | 3.7% | 3.0% | 2.5% | 2.3% | 2.3% | 2.3% | 2.1% | 2.1% | 1.8% | 1.7% | 1.4% | 1.5% | 1.8% | 2.1% | 2.7% | 2.9% | 3.9% | 4.5% | 5.7% | |
| 43.7% | 43.2% | 48.4% | 52.8% | 55.6% | 56.4% | 58.9% | 58.6% | 58.9% | 60.7% | 59.8% | 58.4% | 55.2% | 51.4% | 45.6% | 42.9% | 38.8% | 34.8% | 30.5% | 30.4% | 29.8% | 29.5% | 27.9% | |
| 0.0% | 0.6% | 0.3% | 0.2% | 0.1% | 0.1% | 0.1% | 0.1% | 0.1% | 0.1% | 0.2% | 0.2% | 0.3% | 0.5% | 0.6% | 1.3% | ||||||||
| 10.6% | 13.2% | 17.5% | 19.6% | 21.4% | 22.7% | 24.5% | 25.5% | 25.6% | 26.1% | 24.4% | 23.8% | 21.7% | 19.3% | 18.3% | 17.4% | 16.1% | 16.5% | 15.8% | 15.8% | 16.0% | 16.4% | 16.7% | |
| 27.5% | 30.3% | 31.0% | 24.7% | 21.8% | 20.4% | 17.7% | 15.9% | 14.7% | 14.4% | 12.7% | 12.4% | 12.5% | 12.0% | 11.9% | 11.5% | 11.8% | |||||||
| 0.4% | 0.1% | 0.1% | 0.2% | 0.3% | 0.2% | 0.3% | 0.3% | 0.2% | 0.2% | 0.4% | 0.5% | 0.6% | 0.6% | 0.7% | 0.8% | 1.1% | |||||||
| 0.3% | 0.4% | 0.3% | 0.4% | 0.3% | 0.3% | 0.2% | 0.2% | 0.3% | 0.3% | 0.3% | 0.2% | 0.5% | 0.2% | 0.2% | 0.1% | 0.1% | 0.1% | 0.2% | 0.2% | 0.3% | 0.5% | 1.0% | |
| 76.0% | |||||||||||||||||||||||
| 43.4% | 44.6% | 47.1% | 47.8% | 47.9% | 46.9% | 45.0% | 43.3% | 41.9% | 41.8% | 38.4% | 35.6% | 32.6% | 29.9% | 26.8% | 24.7% | 22.1% | 20.6% | 18.5% | 18.9% | 18.8% | 19.6% | 19.4% | |
| 12.7% | 0.3% | 0.9% | 0.4% | 0.4% | 0.5% | 0.5% | 0.5% | 0.4% | 0.4% | 1.3% | 1.7% | 2.1% | 2.6% | 3.1% | 3.2% | 3.6% | |||||||
| 9.5% | 9.8% | 11.5% | 12.1% | 11.2% | 9.6% | 7.8% | 5.6% | 4.1% | 4.2% | 4.3% | 4.5% | 5.3% | 5.9% | 6.6% | 6.2% | 5.7% | 4.8% | 3.9% | 3.3% | 3.1% | 3.2% | 3.4% | |
| 1.2% | 1.8% | 0.6% | 0.2% | 0.2% | 0.2% | 0.2% | 0.1% | 0.1% | 0.1% | 0.2% | 0.4% | 0.4% | 0.8% | 1.9% | 2.9% | 3.9% | 5.0% | 5.7% | 6.3% | ||||
| 2.0% | 1.4% | 1.5% | 1.0% | 1.5% | 0.7% | 0.6% | 0.4% | 0.9% | 0.7% | 0.8% | 0.7% | 0.8% | 0.8% | 0.8% | |||||||||
Free Blacks as a percentage out of the total Black population by U.S. region and U.S. state between 1790 and 1860
In 1865, all enslaved Blacks (African-Americans) in the United States were emancipated as a result of the Thirteenth Amendment. However, some U.S. states had previously emancipated some or all of their Black population. The table below shows the percentage of free Blacks as a percentage of the total Black population in various U.S. regions and U.S. states between 1790 and 1860 (the blank areas on the chart below mean that there is no data for those specific regions or states in those specific years).
| State/territory | 1790 | 1800 | 1810 | 1820 | 1830 | 1840 | 1850 | 1860 |
|---|---|---|---|---|---|---|---|---|
| 7.9% | 10.8% | 13.5% | 13.2% | 13.7% | 13.4% | 11.9% | 11.0% | |
| Northeast | 40.1% | 56.2% | 73.5% | 83.7% | 97.8% | 99.5% | 99.8% | 100.0% |
| Midwest | 78.7% | 52.4% | 38.0% | 37.7% | 34.4% | 35.5% | 37.6% | |
| South | 4.7% | 6.7% | 8.5% | 8.2% | 8.4% | 8.1% | 7.0% | 6.3% |
| West | 97.9% | 99.4% | ||||||
| 4.4% | 2.2% | 1.3% | 1.3% | 0.8% | 0.7% | 0.6% | ||
| 100.0% | ||||||||
| 1.4% | 3.5% | 3.0% | 2.3% | 1.3% | 0.1% | |||
| 100.0% | 100.0% | |||||||
| 100.0% | ||||||||
| 50.4% | 84.9% | 95.4% | 98.8% | 99.7% | 99.8% | 100.0% | 100.0% | |
| 30.5% | 57.3% | 75.9% | 74.2% | 82.8% | 86.7% | 88.8% | 91.7% | |
| 16.2% | 30.7% | 37.9% | 50.5% | 66.2% | 73.2% | 77.8% | ||
| 5.2% | 3.1% | 2.3% | 1.5% | |||||
| 1.3% | 1.7% | 1.7% | 1.2% | 1.1% | 1.0% | 0.8% | 0.8% | |
| 41.5% | 78.5% | 33.3% | 68.7% | 91.6% | 100.0% | 100.0% | ||
| 75.7% | 62.4% | 86.6% | 99.9% | 100.0% | 100.0% | 100.0% | ||
| 91.5% | 100.0% | 100.0% | ||||||
| 99.7% | ||||||||
| 0.9% | 1.8% | 2.1% | 2.1% | 2.9% | 3.9% | 4.5% | 4.5% | |
| 18.0% | 13.2% | 13.2% | 13.1% | 6.7% | 5.3% | |||
| 100.0% | 100.0% | 100.0% | 100.0% | 99.8% | 100.0% | 100.0% | 100.0% | |
| 7.2% | 15.6% | 23.3% | 27.0% | 33.9% | 40.9% | 45.3% | 49.1% | |
| 100.0% | 100.0% | 100.0% | 100.0% | 100.0% | 100.0% | 100.0% | 100.0% | |
| 100.0% | 83.3% | 100.0% | 99.6% | 100.0% | 100.0% | 100.0% | ||
| 100.0% | 100.0% | |||||||
| 5.0% | 1.2% | 1.4% | 0.8% | 0.7% | 0.3% | 0.2% | ||
| 17.4% | 3.3% | 2.2% | 2.6% | 2.9% | 3.0% | |||
| 81.7% | ||||||||
| 100.0% | ||||||||
| 79.9% | 100.0% | 100.0% | 100.0% | 99.5% | 99.8% | 100.0% | 100.0% | |
| 19.5% | 26.2% | 42.0% | 62.2% | 89.0% | 96.9% | 99.0% | 99.9% | |
| 100.0% | 100.0% | |||||||
| 17.9% | 33.3% | 62.8% | 74.4% | 99.8% | 100.0% | 100.0% | 100.0% | |
| 4.7% | 5.0% | 5.7% | 6.7% | 7.4% | 8.5% | 8.7% | 8.4% | |
| 100.0% | 100.0% | 100.0% | 99.9% | 100.0% | 100.0% | 100.0% | ||
| 100.0% | 100.0% | |||||||
| 63.6% | 89.5% | 96.6% | 99.3% | 98.9% | 99.9% | 100.0% | 100.0% | |
| 78.2% | 89.7% | 97.1% | 98.7% | 99.5% | 99.8% | 100.0% | 100.0% | |
| 1.7% | 2.1% | 2.3% | 2.6% | 2.4% | 2.5% | 2.3% | 2.4% | |
| N/A[a] | ||||||||
| 9.6% | 2.2% | 2.9% | 3.3% | 3.1% | 2.9% | 2.6% | 2.6% | |
| 0.7% | 0.2% | |||||||
| 48.0% | 50.8% | |||||||
| 100.0% | 100.0% | 100.0% | 100.0% | 100.0% | 100.0% | 100.0% | 100.0% | |
| 4.1% | 5.6% | 7.3% | 8.2% | 9.3% | 10.1% | 10.2% | 10.5% | |
| 100.0% | 100.0% | |||||||
| 11.6% | 6.8% | 10.5% | 8.5% | 10.9% | 14.1% | 13.1% | 13.1% | |
| 100.0% | 51.6% | 94.4% | 100.0% | 100.0% | ||||
a^ There were no Blacks at all--either free or enslaved--in South Dakota in 1860.[10]
See also
Notes
- ↑ African-Americans are not recorded as an individual group in the Northern Mariana Islands demographics. The Northern Mariana Islands in 2010 was 50% Asian, 34.9% Pacific Islander, 12.7% two or more races, and 2.5% other.[4]
- ↑ African-Americans are not recorded as an individual group in Guam's demographics. Guam in 2010 was 49.3% Pacific Islander, 33.6% Asian, 7.1% white, 9.4% mixed, and 0.6% other.[5]
- ↑ African-Americans are not recorded as an individual group in American Samoa's demographics. American Samoa in 2010 was 92.6% Pacific Islander, 3.6% Asian, 2.7% mixed, and 1.2% other.[6]
References
- ↑ U.S. Census Bureau (2011). "2010 Census Interactive Population Search". Retrieved 2011-06-24.
- ↑ https://www.indexmundi.com/virgin_islands/demographics_profile.html Indexmundi.com. U.S. Virgin Islands. Retrieved October 8, 2018.
- ↑ https://www.indexmundi.com/puerto_rico/demographics_profile.html Indexmundi.com. Puerto Rico. Retrieved October 8, 2018.
- ↑ https://www.indexmundi.com/northern_mariana_islands/demographics_profile.html Indexmundi.com. Northern Mariana Islands. Retrieved October 8, 2018.
- ↑ https://www.indexmundi.com/guam/demographics_profile.html Indexmundi.com. Guam. Retrieved October 8, 2018.
- ↑ https://www.indexmundi.com/american_samoa/demographics_profile.html Indexmundi.com. American Samoa. Retrieved October 8, 2018.
- ↑ "Historical Census Statistics on Population Totals By Race, 1790 to 1990, and By Hispanic Origin, 1970 to 1990, For The United States, Regions, Divisions, and States". Census.gov. Archived from the original on July 25, 2008. Retrieved September 15, 2012.
- ↑ "Powered by Google Docs". Docs.google.com. Retrieved September 15, 2012.
- ↑ "Powered by Google Docs". Docs.google.com. Retrieved September 15, 2012.
- 1 2 "Population Division Working Paper No. 56" (PDF). Retrieved 2018-08-17.
| Demographics | |
|---|---|
| Economy | |
| Environment | |
| Geography | |
| Government |
|
| Health | |
| History | |
| Law | |
| Miscellaneous | |
| |
This article is issued from
Wikipedia.
The text is licensed under Creative Commons - Attribution - Sharealike.
Additional terms may apply for the media files.