European Parliament election, 1989 (West Germany)
|
| |||||||||||||||||||||||||||||||||||||||||||||||||||||||||||||
| |||||||||||||||||||||||||||||||||||||||||||||||||||||||||||||
All 81 German seats in the European Parliament | |||||||||||||||||||||||||||||||||||||||||||||||||||||||||||||
|---|---|---|---|---|---|---|---|---|---|---|---|---|---|---|---|---|---|---|---|---|---|---|---|---|---|---|---|---|---|---|---|---|---|---|---|---|---|---|---|---|---|---|---|---|---|---|---|---|---|---|---|---|---|---|---|---|---|---|---|---|---|
| Turnout | 62.3% | ||||||||||||||||||||||||||||||||||||||||||||||||||||||||||||
| |||||||||||||||||||||||||||||||||||||||||||||||||||||||||||||
The European Parliament election of 1989 in West Germany was the election of the delegation from West Germany to the European Parliament in 1989.
Results
| Party | Votes | % | Seats
(3 from Berlin) | |
|---|---|---|---|---|
| Social Democratic Party of Germany | 10,525,728 | 37.3% | 30+1 | |
| Christian Democratic Union of Germany | 8,332,846 | 29.5% | 24+1 | |
| The Greens | 2,382,102 | 8.4% | 7+1 | |
| Christian Social Union of Bavaria | 2,326,277 | 8.2% | 7 | |
| The Republicans | 2,008,629 | 7.1% | 6 | |
| Free Democratic Party | 1,576,715 | 5.6% | 4 | |
| Others | 1,054,393 | 3.9% | - | |
| Total | 28,206,690 | 100.0% | 81 |
(Source: Wahlergebnisse - Europawahl (German))
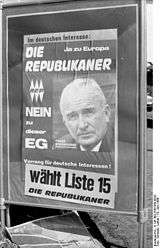
Poster campaign of the Republicans for the 1989 European election, featuring Franz Schönhuber.
References
- 1 2 "Wahl zum 3. Europäischen Parlament am 18. Juni 1989" (in German). Bundeswahlleiter. Retrieved 2012-05-05.
| Parliamentary elections | |
|---|---|
| Presidential elections | |
| European elections | |
| Referendums | |
| |
This article is issued from
Wikipedia.
The text is licensed under Creative Commons - Attribution - Sharealike.
Additional terms may apply for the media files.