European Parliament election, 2009 (Netherlands)
|
| ||||||||||||||||||||||||||||||||||||||||||||||||||||||||||||||||||||||||||||||||||||||||||||||||||||||||||||
| ||||||||||||||||||||||||||||||||||||||||||||||||||||||||||||||||||||||||||||||||||||||||||||||||||||||||||||
25 seats to the European Parliament | ||||||||||||||||||||||||||||||||||||||||||||||||||||||||||||||||||||||||||||||||||||||||||||||||||||||||||||
|---|---|---|---|---|---|---|---|---|---|---|---|---|---|---|---|---|---|---|---|---|---|---|---|---|---|---|---|---|---|---|---|---|---|---|---|---|---|---|---|---|---|---|---|---|---|---|---|---|---|---|---|---|---|---|---|---|---|---|---|---|---|---|---|---|---|---|---|---|---|---|---|---|---|---|---|---|---|---|---|---|---|---|---|---|---|---|---|---|---|---|---|---|---|---|---|---|---|---|---|---|---|---|---|---|---|---|---|---|
| Turnout | 36.75% | |||||||||||||||||||||||||||||||||||||||||||||||||||||||||||||||||||||||||||||||||||||||||||||||||||||||||||
| ||||||||||||||||||||||||||||||||||||||||||||||||||||||||||||||||||||||||||||||||||||||||||||||||||||||||||||
Elections, candidates and members of the European Parliament for the Netherlands | |
|---|---|
| (1952-58) | ECSC delegation |
| (1958-79) | EP delegation |
| (1979-84) | (1st election - candidates - members) |
| (1984-89) | (2nd election - candidates - members) |
| (1989-94) | (3rd election - candidates - members) |
| (1994-99) | (4th election - candidates - members) |
| (1999-04) | (5th election - candidates - members) |
| (2004-09) | (6th election - candidates - members) |
| (2009-14) | (7th election - candidates - members) |
| (2014-19) | (8th election - candidates - members) |
| (2019-24) | (9th election - candidates - members) |
The European Parliament election of 2009 in the Netherlands took place on 4 June 2009. Seventeen parties competed in a D'Hondt type election for the available 25 seats (down from 27). For the first time, all Dutch residents of the Netherlands Antilles and Aruba were also entitled to vote in the election.
Background
Political co-operation
The Christian Union and SGP formed a common list Christian Union-SGP for the European Parliament election. Moreover, several parties formed an electoral alliance:
- CDA/European People's Party and Christian Union-SGP, with 1,223,773 votes
- VVD/European Liberal-Democrats and Democrats 66, with 1,034,065 votes
- PvdA/European Social-Democrats and GreenLeft, with 952,711 votes
All three alliances would be eligible for a remainder seat, because all the parties involved won a seat in the European Parliament. Without the alliance between the Dutch Labour Party and Greenleft, GreenLeft would have only two seats and PVV would have five seats. The other electoral alliances had no effect on the overall seats awarded.[1]
New electorate
The Netherlands Antilles and Aruba were granted the right to vote in the European Parliament election by a verdict of the Council of State which stated that it is illegal to differentiate in law between people with Dutch nationality in Europe and outside. The government granted all persons of Dutch nationality voting rights for European elections. Before the verdict, only people who had lived in the Netherlands for 10 years or longer were allowed to vote. This ruling increased the number of people entitled to vote by 210,000. Only 20,944 people registered to vote from the islands in this election. The turnout of registered voters in the Netherlands Antilles and Aruba was 77% (rest of the world 66%.)[1] This new voting right does not change the position of the Netherlands Antilles and Aruba. They are not considered to be part of the European Union and they do not need to adopt European law.[2]
Before this election, people placed under a guardian were not allowed to vote. Usually a person has the status of guardian because the ward is incapable of caring for their own interests. A ruling of the Council of State decided that this was not allowed under the International Covenant on Civil and Political Rights. It is not known how many people this affected, as there is no central register for individuals under guardianship.[3]
Treaty of Lisbon
Under the Treaty of Lisbon, the Netherlands was to get a 26th seat in the European Parliament. Because this treaty had not yet been ratified by all member states at the time of the elections, this seat could not be given to a party at that time. The State Secretary for the Interior, Ank Bijleveld-Schouten, made a proposal for allocating it if the Lisbon treaty were to be ratified by all member states, but this had not been accepted by parliament at the time of the election. According to the proposal made by the government, the seat would be awarded to the Party for Freedom.
The Party for the Animals contested this proposal, claiming that the minister ignored part of the Electoral Council's opinion. They raised their objection after the official results came in. Under the Electoral Council's opinion, the Party for the Animals should have gained the seat.[4]
Several parties in the States-General had already stated that this changed the election rules after the elections, and, if the rules were to be changed, the opposition had missed their chance by not contesting them before the elections. They had thus de facto agreed to the proposal.[5][6] Advice had been requested from the Council of State on the matter. If the election had been for 26 seats rather than 25 from the start, the 26th seat would have been awarded to the Party for Freedom.[1] On 9 October, the Dutch cabinet announced that the 26th seat would be awarded to the Party for Freedom. This would give them a total of 5 seats when the Lisbon treaty came into effect.[7]
Treaty of Nice
At present, the exact number of seats allocated to each country is determined by the Treaty of Nice, and is adjusted by the accession treaty of each new member. This last adjustment occurred with the enlargement in 2007. Hence no change to the seats occurs without ratification by all member states. According to the treaties, the maximum number of members in the Parliament is 732. However, allocation does not take into account any enlargements to the European Union expected during the Parliamentary term. Hence, when Romania and Bulgaria joined the union in 2007, the number of seats temporarily rose to 785, but later dropped back to 736 at time of the 2009 election. Because of this, the Netherlands had 27 seats in 2004 but only 25 in 2009.
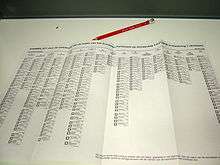
Numbering of the candidates list
The official order and names of candidate lists:
| ||||||
| Lists | ||||||
|---|---|---|---|---|---|---|
| List | English translation | List name (Dutch) | ||||
| 1 | list | CDA - European People's Party | CDA – Europese Volkspartij | |||
| 2 | list | P.v.d.A./European Social Democrats | P.v.d.A./Europese Sociaaldemocraten | |||
| 3 | list | VVD - European Liberal-Democrats | VVD – Europese Liberaal-Democraten | |||
| 4 | list | GreenLeft | Groenlinks | |||
| 5 | list | SP (Socialist Party) | SP (Socialistische Partij) | |||
| 6 | list | Christian Union-SGP | ChristenUnie–SGP | |||
| 7 | list | Democrats 66 (D66) | Democraten 66 (D66) | |||
| 8 | list | Newropeans | ||||
| 9 | list | Europe Cheap! & Sustainable | Europa Voordelig! & Duurzaam | |||
| 10 | list | Solidara | ||||
| 11 | list | Party for the Animals | Partij voor de Dieren | |||
| 12 | list | European Whistleblower Party (EKP) | Europese Klokkenluiders Partij (EKP) | |||
| 13 | list | The Greens | De Groenen | |||
| 14 | list | PVV (Party for Freedom) | PVV (Partij voor de Vrijheid) | |||
| 15 | list | Liberal Democratic Party | Liberaal Democratische Partij | |||
| 16 | list | Party for European politics (PEP) | Partij voor Europese Politiek (PEP) | |||
| 17 | list | Libertas | ||||
Results
Turnout
The voter turnout was 36.75%, a little lower than turnout in 2004 (39.26%.) A total of 12,445,497 people were entitled to vote. Of these 4,573,743 did so.
Highest turnouts in municipalities:
- Rozendaal: 65.7%
- Schiermonnikoog: 58.2%
- Bloemendaal: 55.9%
- Abcoude: 54.9%
- Haren: 54.8%
Lowest turnouts in municipalities:
- Rucphen: 22.3%
- Reiderland: 26.2%
- Reusel-De Mierden: 27.4%
- Den Helder: 27.5%
- Spijkenisse: 27.9%
Seat assignment
Electoral quota
The electoral quota is the number of votes needed for one seat.
It is the total valid number of votes divided by the number of seats.
For this election it was 4,553,864 valid votes, divided by 25 seats.
The electoral quota was established as: 182,154
Electoral alliances
The results of the electoral alliances. Both parties of both alliances reached the electoral quota and are eligible for remainder seats.
| Electoral alliance | List | Number of votes |
|---|---|---|
A |
List 1: CDA – European People's Party | 913,233 |
| List 6: Christian Union-SGP | 310,540 | |
| Total | 1,223,773 | |
| Electoral alliance | List | Number of votes |
|---|---|---|
B |
List 2: P.v.d.A./European Social Democrats | 548,691 |
| List 4: GreenLeft | 404,020 | |
| Total | 952,711 | |
| Electoral alliance | List | Number of votes |
|---|---|---|
C |
List 3: VVD - European Liberal-Democrats | 518,643 |
| List 7: Democrats 66 (D66) | 515,422 | |
| Total | 1,034,065 | |
Assigning full seats
Full seats are assigned by number of votes divided by the electoral quota. Electoral alliances are marked as a letter, instead of a number. Any seats left over are not yet assigned to a specific party.
| List | Party's | Number of votes | Electoral quota | Seats |
|---|---|---|---|---|
| A (list 1+6) | Christian Democratic Appeal + Christian Union-SGP | 1,223,773 | 182,154 | 6 |
| B (list 2+4) | Labour Party + GreenLeft | 952,711 | 182,154 | 5 |
| C (list 3+7) | People's Party for Freedom and Democracy + Democrats 66 | 1,034,065 | 182,154 | 5 |
| 5 | Socialist Party | 323,269 | 182,154 | 1 |
| 8 | Newropeans | 19,840 | 182,154 | 0 |
| 9 | Europe Cheap! & Sustainable | 4,431 | 182,154 | 0 |
| 10 | Solidara | 7,533 | 182,154 | 0 |
| 11 | Party for the Animals | 157,735 | 182,154 | 0 |
| 12 | European Whistleblower Party (EKP) | 21,448 | 182,154 | 0 |
| 13 | The Greens | 8,517 | 182,154 | 0 |
| 14 | Party for Freedom | 772,746 | 182,154 | 4 |
| 15 | Liberal Democratic Party | 10,757 | 182,154 | 0 |
| 16 | Party for European politics (PEP) | 2,427 | 182,154 | 0 |
| 17 | Libertas | 14,612 | 182,154 | 0 |
| Total | 4,553,864 | 21 | ||
| Total seats | 25 | |||
| Remaining seats | 4 | |||
Remainder seats
The remaining, or left over, seats are awarded sequentially to the lists with the highest average number of votes per seat. Only lists that reached the electoral quota are eligible.
| List | Remainder seat 1 | Remainder seat 2 | Remainder seat 3 | Remainder seat 4 | When NL gets 26 seats | Total |
|---|---|---|---|---|---|---|
| A (list 1+6) | 174,824 | 152,971 | 152,971 | 152,971 | 152,971 | 1 |
| B (list 2+4) | 158,785 | 158,785 | 158,785 | 158,785 | 136,101 | 1 |
| C (list 3+7) | 172,344 | 172,344 | 147,723 | 147,723 | 147,723 | 1 |
| 5 | 161,634 | 161,634 | 161,634 | 107,756 | 107,756 | 1 |
| 14 | 154,549 | 154,549 | 154,549 | 154,549 | 154,549 | 0 (+1) |
| Assigned to | A | C | 5 | B | 14 |
- CDA – European People's Party and Christian Union-SGP electoral alliance is awarded 1 seat.
- P.v.d.A./European Social Democrats and GreenLeft electoral alliance is awarded 1 seat.
- VVD - European Liberal-Democrats and Democrats 66 (D66) electoral alliance is awarded 1 seat.
- SP (Socialist Party) is awarded 1 seat.
- PVV (Party for Freedom) is not awarded any seat, but will get remainder seat 5 when the Treaty of Lisbon is ratified by all EU member states.
Awarding seats within electoral alliances
To decide the seats per party for electoral alliances, the combination quota is first determined. Combination quota for electoral alliances are determined by the total number valid votes divided by the awarded seats. The party with the most votes left after the full seats are assigned gets the seat remaining.
List A
For list A, there were 1,223,773 votes divided by 7 seats.
The combination quota was established as: 174,824 votes
| Electoral alliance | List | Number of votes | Combination quota | Full seats | Remainder votes | Remainder seat | Total |
|---|---|---|---|---|---|---|---|
A |
List 1: CDA – European People's Party | 913,233 | 174,824 | 5 | 39,109 | 0 | 5 |
| List 6: Christian Union-SGP | 310,540 | 174,824 | 1 | 135,715 | 1 | 2 | |
| Total | 1,223,773 | 7 | |||||
List B
For list B, there were 952,711 votes divided by 6 seats.
The combination quota was established as: 158,785 votes
| Electoral alliance | List | Number of votes | Combination quota | Full seats | Remainder votes | Remainder seat | Total |
|---|---|---|---|---|---|---|---|
B |
List 2: P.v.d.A./European Social Democrats | 548,691 | 158,785 | 3 | 72,335 | 0 | 3 |
| List 4: GreenLeft | 404,020 | 158,785 | 2 | 86,449 | 1 | 3 | |
| Total | 952,711 | 6 | |||||
List C
For list C, there were 1,034,065 votes divided by 6 seats.
The combination quota was established as: 172,344 votes
| Electoral alliance | List | Number of votes | Combination quota | Full seats | Remainder votes | Remainder seat | Total |
|---|---|---|---|---|---|---|---|
C |
List 3: VVD - European Liberal-Democrats | 518,643 | 172,344 | 3 | 1,610 | 0 | 3 |
| List 7: Democrats 66 (D66) | 515,422 | 172,344 | 2 | 170,733 | 1 | 3 | |
| Total | 1,034,065 | 6 | |||||
Summary:
- The CDA – European People's Party list was awarded 5 seats.
- The Christian Union-SGP list was awarded 2 seats.
- The P.v.d.A./European Social Democrats list was awarded 3 seats.
- The GreenLeft list was awarded 3 seats.
- The VVD - European Liberal-Democrats list was awarded 3 seats.
- The Democrats 66 (D66) list was awarded 3 seats.
Final results
The Christian Democratic Appeal (CDA) remained the biggest party (5 seats), despite losing 2 seats.
The biggest winners were the Party for Freedom (up 4 seats) and Democrats 66 (up 2). The biggest loser was the Labour Party, which lost more than half its seats (down 4).
| |||||||||||||
| Lists | Votes | % | Change | Seats | Change | ||||||||
|---|---|---|---|---|---|---|---|---|---|---|---|---|---|
| List | English translation | List name (Dutch) | EU Party | EP Group | |||||||||
| list | CDA - European People's Party | CDA – Europese Volkspartij | EPP | EPP | 913,233 | 20.05 | 4.33 |
5 / 25 |
2 | ||||
| list | PVV (Party for Freedom) | PVV (Partij voor de Vrijheid) | none | NI | 772,746 | 16.97 | new | 4 / 25 |
4(+1) [8] | ||||
| list | P.v.d.A./European Social Democrats | P.v.d.A./Europese Sociaaldemocraten | PES | S&D | 548,691 | 12.05 | 11.60 |
3 / 25 |
4 | ||||
| list | VVD - European Liberal-Democrats | VVD – Europese Liberaal-Democraten | ELDR | ALDE | 518,643 | 11.39 | 1.81 |
3 / 25 |
1 | ||||
| list | Democrats 66 (D66) | Democraten 66 (D66) | ELDR | ALDE | 515,422 | 11.32 | 7.08 |
3 / 25 |
2 | ||||
| list | GreenLeft | GroenLinks | EGP | Greens-EFA | 404,020 | 8.87 | 1.53 |
3 / 25 |
1 | ||||
| list | SP (Socialist Party) | SP (Socialistische Partij) | none | EUL/NGL | 323,269 | 7.10 | 0.13 |
2 / 25 |
0 | ||||
| list | Christian Union-SGP | ChristenUnie–SGP | ECPM / none | ECR / EFD | 310,540 | 6.82 | 0.91 |
2 / 25 |
0 | ||||
| list | Party for the Animals | Partij voor de Dieren | none | 157,735 | 3.46 | 0.32 |
0 / 25 |
0 | |||||
| list | European Whistleblower Party (EKP) | Europese Klokkenluiders Partij (EKP) | none | 21,448 | 0.47 | new | 0 / 25 |
0 | |||||
| list | Newropeans | Newropeans | none | 19,840 | 0.44 | new | 0 / 25 |
0 | |||||
| list | Libertas | Libertas | Libertas.eu | EFD | 14,612 | 0.32 | new | 0 / 25 |
0 | ||||
| list | Liberal Democratic Party | Liberaal Democratische Partij | none | 10,757 | 0.24 | new | 0 / 25 |
0 | |||||
| list | The Greens | De Groenen | EGP | Greens-EFA | 8,517 | 0.19 | new | 0 / 25 |
0 | ||||
| list | Solidara | none | 7,533 | 0.17 | new | 0 / 25 |
0 | ||||||
| list | Europe Cheap! & Sustainable | Europa Voordelig! & Duurzaam | none | 4,431 | 0.10 | new | 0 / 25 |
0 | |||||
| list | Party for European politics (PEP) | Partij voor Europese Politiek (PEP) | none | 2,427 | 0.05 | new | 0 / 25 |
0 | |||||
| Valid votes | 4,553,864 | 99.56 | 0.20 |
||||||||||
| Blank votes | 10,013 | 0.22 | |||||||||||
| Invalid votes | 9,866 | 0.22 | |||||||||||
| Totals | 4,573,743 | 100.00 | 25 | 2 | |||||||||
| Electorate (eligible voters) and voter turnout | 12,445,497 | 36.75 | 2.51 |
||||||||||
| Source: [9][10] | |||||||||||||
European groups
The Alliance of Liberals and Democrats for Europe became the biggest group in the Netherlands, after an electoral loss for the parties in European People's Party–European Democrats and European Socialists group.
The European Greens–European Free Alliance lost a seat, despite GreenLeft winning a seat. This was because Europe Transparent, which sat in the European Greens-EFA group, did not take part in this election. Newcomer Party for Freedom is not part of a European group and is under Non-Inscrits. The Christian Union-SGP was in the Independence/Democracy group, but this group did not meet the requirements to be a group in the European Parliament and was dissolved. The Christian Union and SGP entered talks with the European Conservatives after the elections. The SGP was asked to change their stance on women's issues, but declined. After that the Christian Union joined the European Conservatives on its own. After 25 years of co-operation, the Christian Union and Reformed Political Party split into two groups in the European parliament.
| |||||||||||
| European group | Seats 2004 | Seats 2009 | Change | ||||||||
|---|---|---|---|---|---|---|---|---|---|---|---|
| Alliance of Liberals and Democrats for Europe | ALDE | 5 | 6 | 1 | |||||||
| European People's Party | EPP | 7 | 5 | 2 | |||||||
| Progressive Alliance of Socialists and Democrats | S&D | 7 | 3 | 4 | |||||||
| The Greens–European Free Alliance | Greens-EFA | 4 | 3 | 1 | |||||||
| European United Left–Nordic Green Left | EUL-NGL | 2 | 2 | 0 | |||||||
| European Conservatives and Reformists | ECR | 0 | 1 | 1 | |||||||
| Europe of Freedom and Democracy | EFD | 2 | 1 | 1 | |||||||
| Non-Inscrits | NI | 0 | 4(+1) | 4(+1) | |||||||
| 27 | 25(+1) | 2(+1) | |||||||||
Elected members
Twenty members were elected by preference vote. Twenty-four people got this amount[1], but not all could be appointed because either the party did not get enough seats or they got no seats.
Below are all the elected members of European parliament for the Netherlands. Members elected by preference votes are in bold. The following 25 MEPs were officially announced by the Central Electoral Commission on 11 June 2009:[1]
- Wim van de Camp, 579,775 votes (top candidate)
- Ria Oomen-Ruijten, 70,388 votes
- Corien Wortmann-Kool, 48,270 votes
- Esther de Lange, 43,406 votes
- Lambert van Nistelrooij, 41,846 votes
- Barry Madlener, 372,060 votes (top candidate)
- Geert Wilders, 334,846 votes (has announced that he will not claim his seat)[11]
- Louis Bontes, 6,751 votes
- Daniël van der Stoep, 5,650 votes
- Thijs Berman, 372,060 votes (top candidate)
- Emine Bozkurt, 66,385 votes
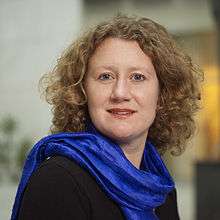
- Judith Merkies, 18,553 votes
People's Party for Freedom and Democracy
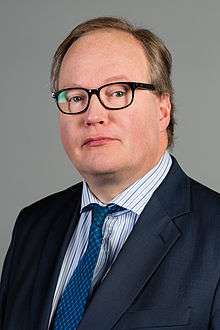
- Hans van Baalen, 367,796 votes (top candidate)
- Jeanine Hennis-Plasschaert, 52,184 votes
- Toine Manders, 34,973 votes
- Sophie in 't Veld, 433,957 votes (top candidate)
- Marietje Schaake, 18,662 votes
- Gerben-Jan Gerbrandy, 18,107 votes
- Judith Sargentini, 321,744 votes (top candidate)
- Bas Eickhout, 13,782 votes
- Marije Cornelissen, 14,486 votes
- Dennis de Jong, 194,359 votes (top candidate)
- Kartika Liotard, 32,426 votes
ChristianUnion – Reformed Political Party
- Peter van Dalen (ChristianUnion), 209,947 votes (top candidate)
- Bastiaan Belder (Reformed Political Party), 53,450 votes
Members not elected, but enough preference votes:
- Christian Democratic Appeal – Maria Martens 38,781 votes. (party did not win enough seats)
- Socialist Party – Nicole van Gemert 23,662 votes. (party did not win enough seats)
- Party for Animals – Natasja Oerlemans 115,472 votes and Marianne Thieme 18,314 votes (party did not win any seat)
MEPs in 2009–2014
Below is a list of members of the European Parliament for the period 2009–2014 as a result of this election.
| |||||||||||
| Name | Sex | National party | EP Group | Period | Preference vote | ||||||
|---|---|---|---|---|---|---|---|---|---|---|---|
| Hans van Baalen | Male | People's Party for Freedom and Democracy | ALDE | 14 July 2009 – | 367,796 | ||||||
| Bas Belder | Male | Reformed Political Party | EFD | 20 July 1999 – | 53,450 | ||||||
| Thijs Berman | Male | Labour Party | S&D | 20 July 2004 – 1 July 2014 | 372,060 | ||||||
| Louis Bontes [12] | Male | Party for Freedom | NI | 14 July 2009 – 17 June 2010 | 6,751 | ||||||
| Emine Bozkurt | Female | Labour Party | S&D | 20 July 2004 – 1 July 2014 | 66,385 | ||||||
| Wim van de Camp | Male | Christian Democratic Appeal | EPP | 14 July 2009 – | 579,775 | ||||||
| Marije Cornelissen | Female | GreenLeft | G–EFA | 14 July 2009 – 1 July 2014 | 14,486 | ||||||
| Peter van Dalen | Male | Christian Union | ECR | 14 July 2009 – | 209,947 | ||||||
| Bas Eickhout | Male | GreenLeft | G–EFA | 14 July 2009 – | 13,782 | ||||||
| Gerben-Jan Gerbrandy | Male | Democrats 66 | ALDE | 14 July 2009 – | 18,107 | ||||||
| Lucas Hartong | Male | Party for Freedom | NI | 22 June 2010 - 1 July 2014 | 2,571 | ||||||
| Jeanine Hennis-Plasschaert [13] | Female | People's Party for Freedom and Democracy | ALDE | 20 July 2004 – 17 June 2010 | 52,184 | ||||||
| Dennis de Jong | Male | Socialist Party | EUL–NGL | 14 July 2009 – | 194,359 | ||||||
| Patricia van der Kammen | Female | Party for Freedom | NI | 27 September 2012 - 1 July 2014 | 12,409 | ||||||
| Esther de Lange | Female | Christian Democratic Appeal | EPP | 12 April 2007 – | 43,406 | ||||||
| Kartika Liotard [14] | Female | Socialist Party (2009–2010) / Independent | EUL–NGL | 20 July 2004 – 1 July 2014 | 32,426 | ||||||
| Barry Madlener [15] | Male | Party for Freedom | NI | 14 July 2009 – 20 September 2012 | 372,060 | ||||||
| Toine Manders [16] | Male | People's Party for Freedom and Democracy (2009–2013) / Independent | ALDE | 20 July 1999 – 1 July 2014 | 34,973 | ||||||
| Judith Merkies | Female | Labour Party | S&D | 14 July 2009 – 1 July 2014 | 18,553 | ||||||
| Jan Mulder | Male | People's Party for Freedom and Democracy | ALDE | 19 July 1994 – 14 July 2009 22 June 2010 – 1 July 2014 |
12,884 | ||||||
| Lambert van Nistelrooij | Male | Christian Democratic Appeal | EPP | 20 July 2004 – | 41,846 | ||||||
| Ria Oomen-Ruijten | Female | Christian Democratic Appeal | EPP | 25 July 1989 – 1 July 2014 | 70,388 | ||||||
| Judith Sargentini | Female | GreenLeft | G–EFA | 14 July 2009 – | 321,744 | ||||||
| Marietje Schaake | Female | Democrats 66 | ALDE | 14 July 2009 – | 18,662 | ||||||
| Laurence Stassen [17] [18] | Female | Party for Freedom (2009–2014) / Independent | NI | 14 July 2009 – 1 July 2014 | 17,880 | ||||||
| Daniël van der Stoep [19] | Male | Party for Freedom (2009–2011) / Independent | NI | 14 July 2009 – 1 September 2011 15 December 2011 - 1 July 2014 |
5,650 | ||||||
| Sophie in 't Veld | Female | Democrats 66 | ALDE | 20 July 2004 – | 433,957 | ||||||
| Corien Wortmann-Kool | Female | Christian Democratic Appeal | EPP | 20 July 2004 – 1 July 2014 | 48,270 | ||||||
| Auke Zijlstra | Male | Party for Freedom | NI | 13 September 2011 - 1 July 2014 7 September 2015 - |
3,617 | ||||||
References
- 1 2 3 4 5 Uitslag verkiezing van de leden van het Europees Parlement van 4 juni 2009 Archived 14 June 2009 at the Wayback Machine. Turnout in Netherlands Antilles and Aruba
- ↑ Europees kiesrecht in Aruba en Nederlandse Antillen Dutch allowed to vote on the Netherlands Antilles and Aruba
- ↑ Core data for 2009 elections Archived 21 July 2011 at the Wayback Machine.
- ↑ Dutch parliament asks advice from Council of State in NRC
- ↑ Dutch labour party wants remainder seat for Party for Freedom in Telegraaf
- ↑ Junior minister says: remainder seat "de facto" for Party for Freedom in Trouw
- ↑ PVV krijgt vijfde zetel in Europarlement on Nu.nl
- ↑ After ratification of the Treaty of Lisbon by all member states. http://www.volkskrant.nl/politiek/extra-zetel-europees-parlement-naar-pvv~a365575/
- ↑ Verkiezingsuitslagen van de kiesraad
- ↑ Minutes Dutch EP election 2009 in .pdf and Dutch
- ↑ Laurenca Stassen replaces Geert Wilders in EP Archived 11 June 2011 at the Wayback Machine. TcTubantia (in Dutch)
- ↑ Resigned in 2010, became a member of the Dutch Parliament (House of Representatives) after the 2010 election. Replaced by Lucas Hartong on 22 June 2010.
- ↑ Resigned in 2010, became a member of the Dutch Parliament (House of Representatives) after the 2010 election. Replaced by Jan Mulder on 22 June 2010.
- ↑ Withdrew her membership of the Socialist Party on 1 June 2010 after internal conflicts in the Socialist Party. Sits as an independent while still part of the EUL-NGL.
- ↑ Resigned in 2012, became a member of the Dutch Parliament (House of Representatives) after the 2012 election. Replaced by Patricia van der Kammen on 27 September 2012.
- ↑ Withdrew his membership of the People's Party for Freedom and Democracy on 17 October 2013 to run as party leader of 50PLUS in the European Parliament election, 2014. Sits as an independent, while still part of the ALDE.
- ↑ Geert Wilders, as "party list pusher" was chosen on the number of preferences votes, however he declined to join the European Parliament. Stassen took up his seat.
- ↑ Withdrew her membership of the Party for Freedom on 21 March 2014 after allegedly discriminatory remarks by party leader Wilders. Sits as an independent.
- ↑ Resigned in 2011 because he caused a car crash while drunk driving. Replaced by Auke Zijlstra on 13 September 2011. Van der Stoep returned to the Parliament in December 2011 because of seat increases provided for by the Treaty of Lisbon. As the first candidate on the Party for Freedom election list who did not have a seat in the European Parliament he was allowed to return to the Parliament. However, the Party for Freedom did not allow him to rejoin their delegation, and he currently sits as an independent.



_(cropped).jpg)