Bury St Edmunds (UK Parliament constituency)
| Bury St Edmunds | |
|---|---|
|
County constituency for the House of Commons | |
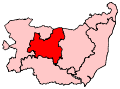 Boundary of Bury St Edmunds in Suffolk. | |
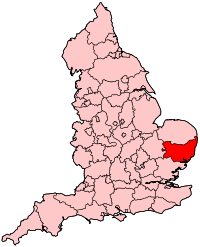 Location of Suffolk within England. | |
| County | Suffolk |
| Population | 113,678 (2011 census)[1] |
| Electorate | 85,933 (December 2010)[2] |
| Current constituency | |
| Created | 1918 |
| Member of parliament | Jo Churchill (Conservative) |
| Number of members | One |
| 1614–1918 | |
| Number of members |
1614–1885: Two 1885–1918: One |
| Type of constituency | Borough constituency |
| Overlaps | |
| European Parliament constituency | East of England |
Bury St Edmunds is a constituency in Suffolk centred on the town of Bury St Edmunds that elects a member of parliament (MP) to the House of Commons of the Parliament of the United Kingdom. The electorate has elected Conservative Party candidates at the general elections and two by-elections since a Liberal victory in 1880, the closest contest since that year was in 1997 when the Labour Party candidate fell 368 votes, less than 1%, short of winning the seat in 1997 during Tony Blair's first landslide result.
In terms of election expenses and type of returning officer it has been a county constituency since 1918, before which it was a borough constituency that was created in 1614, returning two MPs to the House of Commons of England until 1707, then to the House of Commons of Great Britain until 1800, and from 1800 to the House of Commons of the United Kingdom. Its representation was reduced to one seat under the Redistribution of Seats Act 1885; it was extended and its type was switched under the Representation of the People Act 1918.
Boundaries
1918–1950: The Municipal Borough of Bury St Edmunds, the Urban District of Newmarket, the Rural Districts of Brandon, Mildenhall, and Thedwastre, and parts of the Rural Districts of Moulton and Thingoe.
1950–1983: The Municipal Borough of Bury St Edmunds, the Urban Districts of Haverhill and Newmarket, and the Rural Districts of Clare, Mildenhall, Thedwastre, and Thingoe.
1983–1997: The Borough of St Edmundsbury wards of Abbeygate, Barningham, Barrow, Chevington, Eastgate, Fornham, Great Barton, Honington, Horringer, Ixworth, Northgate, Pakenham, Risby, Risbygate, Rougham, St Olave's, Sextons, Southgate, Stanton, Westgate, and Whelnetham, and the District of Forest Heath.
1997–2010: The Borough of St Edmundsbury wards of Abbeygate, Eastgate, Fornham, Great Barton, Horringer Court, Northgate, Pakenham, Risbygate, Rougham, St Olave's, Sextons, Southgate, Westgate, and Whelnetham, and the District of Mid Suffolk wards of Badwell Ash, Elmswell, Gislingham, Haughley and Wetherden, Needham Market, Norton, Onehouse, Rattlesden, Rickinghall, Ringshall, Stowmarket Central, Stowmarket North, Stowmarket South, Stowupland, Thurston, Walsham-le-Willows, and Woolpit.
2010–present: The Borough of St Edmundsbury wards of Abbeygate, Eastgate, Fornham, Great Barton, Horringer and Whelnetham, Minden, Moreton Hall, Northgate, Pakenham, Risbygate, Rougham, St Olave's, Southgate, and Westgate, and the District of Mid Suffolk wards of Bacton and Old Newton, Badwell Ash, Elmswell and Norton, Gislingham, Haughley and Wetherden, Needham Market, Onehouse, Rattlesden, Rickinghall and Walsham, Ringshall, Stowmarket Central, Stowmarket North, Stowmarket South, Stowupland, Thurston and Hessett, and Woolpit.
The constituency contains the towns of Bury St Edmunds, Stowmarket and Needham Market. Its boundaries do not match those of the borough of St Edmundsbury, which includes Haverhill (part of West Suffolk constituency), and excludes Stowmarket and Needham Market.
Members of Parliament
MPs 1614–1660
| Parliament | First member | Second member |
|---|---|---|
| 1614 | Sir Thomas Jermyn | Sir Robert Crane, 1st Baronet |
| 1621 | Sir Thomas Jermyn | John Woodford |
| 1624 | Sir Thomas Jermyn | Anthony Crofts |
| 1625 | Sir Thomas Jermyn | Sir William Spring |
| 1626 | Sir Thomas Jermyn | Emanuel Gifford |
| 1628 | Sir Thomas Jermyn | Sir William Hervey |
| 1629–1640 | No Parliaments summoned | |
| 1640 April | Sir Thomas Jermyn | John Godbolt |
| 1640 November | Thomas Jermyn, disabled on 14 February 1644 | Henry Jermyn, ennobled 6 September 1643[3] |
| 1645 | Sir Thomas Barnardiston | Sir William Spring, excluded in Pride's Purge in 1648 |
| 1653 | Bury St Edmunds not represented in Barebones Parliament | |
| 1654 | Samuel Moody | John Clarke |
| 1656 | Samuel Moody | John Clarke |
| 1659 | John Clarke | Thomas Chaplin[4] |
| 1659 Restored Rump Parliament | Sir Thomas Barnardiston | Sir William Spring, 1st Baronet (died 1654) |
MPs 1660–1885
Two Members
MPs since 1885
Elections
Elections in the 2010s
| Party | Candidate | Votes | % | ± | |
|---|---|---|---|---|---|
| Conservative | Jo Churchill[20] | 36,794 | 59.2 | +5.6 | |
| Labour | William Edwards | 18,353 | 29.5 | +11.8 | |
| Liberal Democrat | Helen Korfanty[20] | 3,565 | 5.7 | -0.3 | |
| Green | Helen Geake[20] | 2,596 | 4.2 | -3.7 | |
| Independent | Liam Byrne[20] | 852 | 1.4 | +1.4 | |
| Majority | 18,441 | 29.7 | -6.2 | ||
| Turnout | 62,160 | 70.8 | +1.8 | ||
| Conservative hold | Swing | -3.1 | |||
Note: Independent St. Edmundsbury Borough councillor Paul Hopfensperger [21] submitted a valid nomination but this was subsequently withdrawn. Because of the timing of the withdrawal, his name appears in the Statement of Persons Nominated[22] for this election.
| Party | Candidate | Votes | % | ± | |
|---|---|---|---|---|---|
| Conservative | Jo Churchill[25] | 31,815 | 53.6 | +6.1 | |
| Labour | William Edwards[26] | 10,514 | 17.7 | +1.1 | |
| UKIP | John Howlett | 8,739 | 14.7 | +9.6 | |
| Green | Helen Geake[27] | 4,692 | 7.9 | +3.6 | |
| Liberal Democrat | David Chappell | 3,581 | 6.0 | -20.4 | |
| Majority | 21,301 | 35.9 | +14.8 | ||
| Turnout | 59,341 | 69.0 | -0.3 | ||
| Conservative hold | Swing | +2.5 | |||
| Party | Candidate | Votes | % | ± | |
|---|---|---|---|---|---|
| Conservative | David Ruffley | 27,899 | 47.5 | +1.2 | |
| Liberal Democrat | David Chappell | 15,519 | 26.4 | +6.7 | |
| Labour | Kevin Hind | 9,776 | 16.7 | −10.7 | |
| UKIP | John Howlett | 3,003 | 5.1 | +1.6 | |
| Green | Mark Ereira-Guyer | 2,521 | 4.3 | +1.3 | |
| Majority | 12,380 | 21.1 | +2.2 | ||
| Turnout | 58,718 | 69.3 | +2.5 | ||
| Conservative hold | Swing | −2.8 | |||
Elections in the 2000s
| Party | Candidate | Votes | % | ± | |
|---|---|---|---|---|---|
| Conservative | David Ruffley | 24,332 | 46.2 | +2.7 | |
| Labour | David Monaghan | 14,402 | 27.4 | −11.1 | |
| Liberal Democrat | David Chappell | 10,423 | 19.8 | +5.9 | |
| UKIP | John Howlett | 1,859 | 3.5 | +1.8 | |
| Green | Graham Manning | 1,603 | 3.0 | N/A | |
| Majority | 9,930 | 18.9 | +13.9 | ||
| Turnout | 52,619 | 66.1 | +0.1 | ||
| Conservative hold | Swing | +6.9 | |||
| Party | Candidate | Votes | % | ± | |
|---|---|---|---|---|---|
| Conservative | David Ruffley | 21,850 | 43.5 | +5.1 | |
| Labour | Mark Ereira-Guyer | 19,347 | 38.5 | +0.8 | |
| Liberal Democrat | Richard Williams | 6,998 | 13.9 | −4.3 | |
| UKIP | John Howlett | 831 | 1.7 | N/A | |
| Independent | Michael Brundle | 651 | 1.3 | N/A | |
| Socialist Labour | Michael Benwell | 580 | 1.2 | N/A | |
| Majority | 2,503 | 5.0 | +4.3 | ||
| Turnout | 50,257 | 66 | −9.0 | ||
| Conservative hold | Swing | +2.1 | |||
Elections in the 1990s
| Party | Candidate | Votes | % | ± | |
|---|---|---|---|---|---|
| Conservative | David Ruffley | 21,290 | 38.3 | −7.6 | |
| Labour | Mark Ereira-Guyer | 20,922 | 37.7 | +11.7 | |
| Liberal Democrat | David A. Cooper | 10,102 | 18.2 | −8.7 | |
| Referendum | Ian C.H. McWhirter | 2,939 | 5.3 | N/A | |
| Natural Law | Joanna B. Lillis | 272 | 0.5 | −0.4 | |
| Majority | 368 | 0.7 | −29.3 | ||
| Turnout | 55,525 | 75.0 | +0.6 | ||
| Conservative hold | Swing | −14.6 | |||
| Party | Candidate | Votes | % | ± | |
|---|---|---|---|---|---|
| Conservative | Richard Spring | 33,554 | 53.5 | −5.8 | |
| Labour | Tommy Sheppard | 14,767 | 23.6 | +6.3 | |
| Liberal Democrat | John B. Williams | 13,814 | 22.0 | −0.5 | |
| Natural Law | Joanna B. Lillis | 550 | 0.9 | N/A | |
| Majority | 18,787 | 30.0 | −7.8 | ||
| Turnout | 62,685 | 78.9 | +4.8 | ||
| Conservative hold | Swing | −6.1 | |||
Elections in the 1980s
| Party | Candidate | Votes | % | ± | |
|---|---|---|---|---|---|
| Conservative | Eldon Griffiths | 33,672 | 59.3 | +0.3 | |
| Social Democratic | Reginald Harland | 12,214 | 21.5 | −6.9 | |
| Labour | Christopher Greene | 9,841 | 17.3 | +4.8 | |
| Green | Ida Wakelam | 1,057 | 1.9 | N/A | |
| Majority | 21,458 | 37.8 | +7.2 | ||
| Turnout | 56,784 | 74.1 | +1.8 | ||
| Conservative hold | Swing | +3.6 | |||
| Party | Candidate | Votes | % | ± | |
|---|---|---|---|---|---|
| Conservative | Eldon Griffiths | 31,081 | 59.0 | −2.0 | |
| Social Democratic | Reginald Harland | 14,959 | 28.4 | N/A | |
| Labour | W. Mosczynski | 6,666 | 12.7 | −16.3 | |
| Majority | 16,122 | 30.6 | |||
| Turnout | 52,706 | 72.3 | −4.0 | ||
| Conservative hold | Swing | ||||
Elections in the 1970s
| Party | Candidate | Votes | % | ± | |
|---|---|---|---|---|---|
| Conservative | Eldon Griffiths | 41,426 | 57.0 | +6.6 | |
| Labour | A. Gibson | 21,167 | 29.0 | −4.0 | |
| Liberal | G. Jones | 10,836 | 14.2 | −2.4 | |
| Majority | 20,259 | 27.8 | +10.5 | ||
| Turnout | 73,429 | 76.3 | +3.1 | ||
| Conservative hold | Swing | +5.3 | |||
| Party | Candidate | Votes | % | ± | |
|---|---|---|---|---|---|
| Conservative | Eldon Griffiths | 32,179 | 50.4 | +2.9 | |
| Labour | J.K Stephenson | 21,097 | 33.0 | +4.3 | |
| Liberal | G Jones | 10,631 | 16.6 | −7.2 | |
| Majority | 11,082 | 17.3 | −1.5 | ||
| Turnout | 63,907 | 73.2 | −8.1 | ||
| Conservative hold | Swing | −0.7 | |||
| Party | Candidate | Votes | % | ± | |
|---|---|---|---|---|---|
| Conservative | Eldon Griffiths | 33,424 | 47.5 | −14.2 | |
| Labour | J.K Stephenson | 20,171 | 28.7 | 0.0 | |
| Liberal | B. Boulton | 16,772 | 23.8 | N/A | |
| Majority | 13,253 | 18.8 | −3.6 | ||
| Turnout | 70,367 | 81.3 | +4.1 | ||
| Conservative hold | Swing | −7.2 | |||
| Party | Candidate | Votes | % | ± | |
|---|---|---|---|---|---|
| Conservative | Eldon Griffiths | 36,688 | 61.2 | +7.1 | |
| Labour | Colin J.V. Seager | 23,286 | 38.8 | -7.1 | |
| Majority | 13,402 | 22.4 | +13.3 | ||
| Turnout | 59,974 | 77.2 | −1.6 | ||
| Conservative hold | Swing | N/A | |||
Elections in the 1960s
| Party | Candidate | Votes | % | ± | |
|---|---|---|---|---|---|
| Conservative | Eldon Griffiths | 27,782 | 54.6 | +4.4 | |
| Labour | Colin J.V. Seager | 23,140 | 45.4 | +5.2 | |
| Majority | 4,462 | 9.1 | -0.8 | ||
| Turnout | 50,922 | 78.8 | -3.4 | ||
| Conservative hold | Swing | -0.8 | |||
| Party | Candidate | Votes | % | ± | |
|---|---|---|---|---|---|
| Conservative | Eldon Griffiths | 25,206 | 50.2 | -8.6 | |
| Labour | Noel James Insley | 20,216 | 40.2 | -1.1 | |
| Liberal | Richard L. Afton | 4,840 | 9.6 | N/A | |
| Majority | 4,990 | 9.9 | -7.6 | ||
| Turnout | 50,262 | 82.2 | +3.6 | ||
| Conservative hold | Swing | -7.5 | |||
| Party | Candidate | Votes | % | ± | |
|---|---|---|---|---|---|
| Conservative | Eldon Griffiths | 22,141 | 49.0 | -9.8 | |
| Labour | Noel James Insley | 19,682 | 43.5 | +2.2 | |
| Liberal | Richard L. Afton | 3,387 | 7.5 | N/A | |
| Majority | 2,459 | 5.5 | -12.0 | ||
| Turnout | 45,210 | ||||
| Conservative hold | Swing | ||||
Elections in the 1950s
| Party | Candidate | Votes | % | ± | |
|---|---|---|---|---|---|
| Conservative | William Aitken | 26,730 | 58.8 | +3.7 | |
| Labour | Alison Margaret A. Walter | 18,768 | 41.3 | -3.6 | |
| Majority | 7,962 | 17.5 | +7.2 | ||
| Turnout | 45,498 | 78.6 | +0.3 | ||
| Conservative hold | Swing | +3.6 | |||
| Party | Candidate | Votes | % | ± | |
|---|---|---|---|---|---|
| Conservative | William Aitken | 24,532 | 55.1 | +0.7 | |
| Labour | Neville Stanley | 19,962 | 44.9 | -0.7 | |
| Majority | 4,570 | 10.3 | +1.5 | ||
| Turnout | 44,494 | 78.3 | -1.5 | ||
| Conservative hold | Swing | +0.7 | |||
| Party | Candidate | Votes | % | ± | |
|---|---|---|---|---|---|
| Conservative | William Aitken | 24,679 | 54.4 | +5.1 | |
| Labour | Neville Stanley | 20,690 | 45.6 | +5.3 | |
| Majority | 3,989 | 8.8 | -0.2 | ||
| Turnout | 45,369 | 79.8 | -2.7 | ||
| Conservative hold | Swing | -0.1 | |||
| Party | Candidate | Votes | % | ± | |
|---|---|---|---|---|---|
| Conservative | William Aitken | 22,559 | 49.3 | +0.6 | |
| Labour | Cecily Alicia McCall | 18,430 | 40.3 | +10.5 | |
| Liberal | Henry William Sparham | 4,780 | 10.4 | -8.6 | |
| Majority | 4,129 | 9.0 | -9.9 | ||
| Turnout | 45,769 | 82.5 | +14.7 | ||
| Conservative hold | Swing | -4.9 | |||
Elections in the 1940s
| Party | Candidate | Votes | % | ± | |
|---|---|---|---|---|---|
| Conservative | Geoffrey Clifton-Brown | 15,013 | 48.7 | -7.5 | |
| Labour | Cecily Alicia McCall | 9,195 | 29.8 | N/A | |
| Liberal | Harold Charles Drayton | 5,863 | 19.0 | N/A | |
| Common Wealth | Eric Gordon England | 750 | 2.4 | N/A | |
| Majority | 5,818 | 18.9 | -6.5 | ||
| Turnout | 30,821 | 67.8 | +17.0 | ||
| Conservative hold | Swing | N/A | |||
Following the death of Frank Heilgers on 16 January 1944 a by-election was held on 29 February 1944.
| Party | Candidate | Votes | % | ± | |
|---|---|---|---|---|---|
| Conservative | Edgar Keatinge | 11,705 | 56.2 | N/A | |
| Independent Liberal | Margery Corbett Ashby | 9,121 | 43.8 | N/A | |
| Majority | 2,584 | 12.4 | N/A | ||
| Turnout | 20,828 | 50.8 | N/A | ||
| Conservative hold | Swing | N/A | |||
Elections in the 1930s
| Party | Candidate | Votes | % | ± | |
|---|---|---|---|---|---|
| Conservative | Frank Heilgers | Unopposed | N/A | N/A | |
| Conservative hold | Swing | N/A | |||
| Party | Candidate | Votes | % | ± | |
|---|---|---|---|---|---|
| Conservative | Frank Heilgers | Unopposed | N/A | N/A | |
| Conservative hold | Swing | N/A | |||
Elections in the 1920s
| Party | Candidate | Votes | % | ± | |
|---|---|---|---|---|---|
| Unionist | Walter Guinness | 16,462 | 54.4 | −8.7 | |
| Liberal | Dar Lyon | 11,344 | 37.4 | +0.5 | |
| Labour | Percy Astins | 2,490 | 8.2 | N/A | |
| Majority | 5,118 | 17.0 | −9.2 | ||
| Turnout | 30,296 | 77.8 | −4.0 | ||
| Registered electors | 38,938 | ||||
| Unionist hold | Swing | −4.6 | |||
On Guinness's nomination as Minister of Agriculture a by-election in 1925 was required under the electoral law of the time, which he won.
| Party | Candidate | Votes | % | ± | |
|---|---|---|---|---|---|
| Unionist | Walter Guinness | 14,700 | 62.8 | −0.3 | |
| Liberal | George Nicholls | 8,703 | 37.2 | +0.3 | |
| Majority | 5,997 | 25.6 | −0.6 | ||
| Turnout | 23,403 | 73.9 | −7.9 | ||
| Registered electors | 31,648 | ||||
| Unionist hold | Swing | −0.3 | |||
| Party | Candidate | Votes | % | ± | |
|---|---|---|---|---|---|
| Unionist | Walter Guinness | 16,073 | 63.1 | N/A | |
| Liberal | John Adam Day | 9,392 | 36.9 | N/A | |
| Majority | 6,681 | 26.2 | N/A | ||
| Turnout | 25,465 | 81.8 | N/A | ||
| Registered electors | 31,138 | ||||
| Unionist hold | Swing | N/A | |||
| Party | Candidate | Votes | % | ± | |
|---|---|---|---|---|---|
| Unionist | Walter Guinness | Unopposed | |||
| Unionist hold | |||||
| Party | Candidate | Votes | % | ± | |
|---|---|---|---|---|---|
| Unionist | Walter Guinness | Unopposed | |||
| Unionist hold | |||||
Elections in the 1910s
| Party | Candidate | Votes | % | ± | |
|---|---|---|---|---|---|
| C | Unionist | Walter Guinness | Unopposed | ||
| Unionist hold | |||||
| C indicates candidate endorsed by the coalition government. | |||||
General Election 1914/15:
Another General Election was required to take place before the end of 1915. The political parties had been making preparations for an election to take place and by the July 1914, the following candidates had been selected;
- Unionist: Walter Guinness
- Liberal:
| Party | Candidate | Votes | % | ± | |
|---|---|---|---|---|---|
| Conservative | Walter Guinness | Unopposed | |||
| Conservative hold | |||||
| Party | Candidate | Votes | % | ± | |
|---|---|---|---|---|---|
| Conservative | Walter Guinness | Unopposed | |||
| Conservative hold | |||||
Elections in the 1900s
| Party | Candidate | Votes | % | ± | |
|---|---|---|---|---|---|
| Conservative | Walter Guinness | 1,631 | 68.8 | +10.2 | |
| Liberal | Walter Baldwyn Yates | 741 | 31.2 | −10.2 | |
| Majority | 890 | 37.6 | +20.4 | ||
| Turnout | 2,372 | 86.6 | −4.1 | ||
| Registered electors | 2,740 | ||||
| Conservative hold | Swing | +10.2 | |||
| Party | Candidate | Votes | % | ± | |
|---|---|---|---|---|---|
| Conservative | Frederick Hervey | 1,481 | 58.6 | N/A | |
| Liberal | Walter Baldwyn Yates | 1,047 | 41.4 | N/A | |
| Majority | 434 | 17.2 | N/A | ||
| Turnout | 2,528 | 90.7 | N/A | ||
| Registered electors | 2,788 | ||||
| Conservative hold | Swing | N/A | |||
| Party | Candidate | Votes | % | ± | |
|---|---|---|---|---|---|
| Conservative | Edward Greene | Unopposed | |||
| Conservative hold | |||||
Elections in the 1890s
| Party | Candidate | Votes | % | ± | |
|---|---|---|---|---|---|
| Conservative | Henry Cadogan | Unopposed | |||
| Conservative hold | |||||
| Party | Candidate | Votes | % | ± | |
|---|---|---|---|---|---|
| Conservative | Henry Cadogan | Unopposed | |||
| Conservative hold | |||||
| Party | Candidate | Votes | % | ± | |
|---|---|---|---|---|---|
| Conservative | Francis Hervey | 1,267 | 59.5 | +0.8 | |
| Liberal | John Eustace Jameson | 863 | 40.5 | −0.8 | |
| Majority | 404 | 19.0 | +1.6 | ||
| Turnout | 2,130 | 84.7 | +0.3 | ||
| Registered electors | 2,515 | ||||
| Conservative hold | Swing | +0.8 | |||
Elections in the 1880s
| Party | Candidate | Votes | % | ± | |
|---|---|---|---|---|---|
| Conservative | Francis Hervey | 1,135 | 58.7 | +4.7 | |
| Liberal | Frederick Goodwin | 800 | 41.3 | -4.7 | |
| Majority | 335 | 17.4 | +9.4 | ||
| Turnout | 1,935 | 84.4 | -6.3 | ||
| Registered electors | 2,292 | ||||
| Conservative hold | Swing | +4.7 | |||
| Party | Candidate | Votes | % | ± | |
|---|---|---|---|---|---|
| Conservative | Francis Hervey | 1,122 | 54.0 | −5.9 | |
| Liberal | Joseph Hardcastle | 956 | 46.0 | +5.8 | |
| Majority | 166 | 8.0 | N/A | ||
| Turnout | 2,078 | 90.7 | −1.7 (est) | ||
| Registered electors | 2,292 | ||||
| Conservative win | |||||
| Party | Candidate | Votes | % | ± | |
|---|---|---|---|---|---|
| Liberal | Joseph Hardcastle | 1,110 | 40.2 | −0.8 | |
| Conservative | Edward Greene | 850 | 30.8 | −0.1 | |
| Conservative | Francis Hervey | 803 | 29.1 | +1.0 | |
| Majority | 260 | 9.4 | N/A | ||
| Turnout | 1,960 (est) | 92.4 (est) | +7.6 | ||
| Registered electors | 2,122 | ||||
| Liberal gain from Conservative | Swing | −0.7 | |||
| Conservative hold | Swing | N/A | |||
Elections in the 1870s
| Party | Candidate | Votes | % | ± | |
|---|---|---|---|---|---|
| Conservative | Edward Greene | 1,004 | 30.9 | +13.1 | |
| Conservative | Francis Hervey | 914 | 28.1 | +10.3 | |
| Liberal | Joseph Hardcastle | 707 | 21.7 | −13.3 | |
| Liberal | Charles Lamport[40] | 628 | 19.3 | −10.2 | |
| Majority | 207 | 6.4 | +5.9 | ||
| Turnout | 1,627 (est) | 84.8 (est) | −5.7 | ||
| Registered electors | 1,919 | ||||
| Conservative hold | Swing | +11.7 | |||
| Conservative gain from Liberal | Swing | +11.8 | |||
Elections in the 1860s
| Party | Candidate | Votes | % | ± | |
|---|---|---|---|---|---|
| Conservative | Edward Greene | 714 | 35.5 | +2.1 | |
| Liberal | Joseph Hardcastle | 703 | 35.0 | −1.9 | |
| Liberal | Edward Bunbury | 593 | 29.5 | N/A | |
| Majority | 11 | 0.5 | N/A | ||
| Turnout | 1,362 (est) | 90.5 (est) | +4.5 | ||
| Registered electors | 1,505 | ||||
| Conservative hold | Swing | N/A | |||
| Liberal hold | Swing | N/A | |||
| Party | Candidate | Votes | % | ± | |
|---|---|---|---|---|---|
| Liberal | Joseph Hardcastle | 331 | 36.9 | +6.5 | |
| Conservative | Edward Greene | 300 | 33.4 | +5.3 | |
| Liberal-Conservative | Alfred Hervey[41] | 266 | 29.7 | −11.7 | |
| Majority | 31 | 3.5 | +1.2 | ||
| Turnout | 582 (est) | 86.0 (est) | +13.4 | ||
| Registered electors | 676 | ||||
| Liberal hold | Swing | +6.2 | |||
| Conservative hold | Swing | +5.6 | |||
Elections in the 1850s
| Party | Candidate | Votes | % | ± | |
|---|---|---|---|---|---|
| Peelite | Alfred Hervey | 418 | 41.4 | +4.4 | |
| Liberal | Joseph Hardcastle | 307 | 30.4 | −4.0 | |
| Conservative | Robert Buxton | 284 | 28.1 | −0.5 | |
| Turnout | 505 (est) | 72.6 (est) | +6.4 | ||
| Registered electors | 695 | ||||
| Majority | 111 | 11.0 | N/A | ||
| Peelite gain from Conservative | Swing | +2.3 | |||
| Majority | 23 | 2.3 | −3.5 | ||
| Liberal hold | Swing | −1.9 | |||
| Party | Candidate | Votes | % | ± | |
|---|---|---|---|---|---|
| Peelite | Alfred Hervey | Unopposed | |||
| Peelite gain from Conservative | |||||
- Caused by Hervey's succession to the peerage, becoming 2nd Marquess of Bristol
| Party | Candidate | Votes | % | ± | |
|---|---|---|---|---|---|
| Conservative | Frederick Hervey | 344 | 37.0 | −6.2 | |
| Whig | Joseph Hardcastle | 320 | 34.4 | +6.4 | |
| Conservative | James Oakes | 266 | 28.6 | −0.2 | |
| Turnout | 465 (est) | 66.2 (est) | −10.7 | ||
| Registered electors | 702 | ||||
| Majority | 24 | 2.6 | +1.8 | ||
| Conservative hold | Swing | −4.7 | |||
| Majority | 54 | 5.8 | N/A | ||
| Whig gain from Conservative | Swing | +6.4 | |||
| Party | Candidate | Votes | % | ± | |
|---|---|---|---|---|---|
| Conservative | James Oakes | 324 | 50.6 | −21.4 | |
| Whig | Joseph Hardcastle | 316 | 49.4 | +21.4 | |
| Majority | 8 | 1.3 | +0.5 | ||
| Turnout | 640 | 89.8 | +12.9 | ||
| Registered electors | 713 | ||||
| Conservative hold | Swing | −21.4 | |||
- Caused by Stuart's resignation after being appointed a Vice-Chancellor of the Court of Chancery.
| Party | Candidate | Votes | % | ± | |
|---|---|---|---|---|---|
| Conservative | Frederick Hervey | 493 | 43.2 | ||
| Conservative | John Stuart | 328 | 28.8 | ||
| Whig | Edward Bunbury | 319 | 28.0 | ||
| Majority | 9 | 0.8 | |||
| Turnout | 570 (est) | 76.9 (est) | |||
| Registered electors | 741 | ||||
| Conservative hold | Swing | ||||
| Conservative gain from Whig | Swing | ||||
See also
Notes and references
- References
- ↑ "Bury St Edmunds: Usual Resident Population, 2011". Neighbourhood Statistics. Office for National Statistics. Retrieved 7 February 2015.
- ↑ "Electorate Figures – Boundary Commission for England". 2011 Electorate Figures. Boundary Commission for England. 4 March 2011. Archived from the original on 6 November 2010. Retrieved 13 March 2011.
- ↑ "General Index to the Twenty-three Volumes of The Parliamentary Or Constitutional History of England". Printed; and sold by Thomas Osborne, ... and William Sandby. 12 October 2017 – via Google Books.
- ↑ Hervey, Arthur Charles (12 October 2017). "A Paper Read Before the Archaeological Institute of Suffolk, at Their Meeting Held at Ickworth, October 2nd, 1856". S. Tymms – via Google Books.
- 1 2 3 Leigh Rayment's Historical List of MPs – Constituencies beginning with "B" (part 6)
- ↑ A double return was made, Thomas Chaplin and John Clarke were subsequently declared not duly elected.
- ↑ At the general election in May 1705, Davers was also returned for Suffolk, for which he chose to sit.
- ↑ Hon. Augustus John Hervey was also declared elected in April 1754, he and his uncle Felton having an equal number of votes. This election was declared void. At the subsequent by-election held on 9 December 1754, Felton Hervey was returned.
- ↑ Ollivier, John (1841). "Alphabetical List of the House of Commons". Ollivier's parliamentary and political director. p. 38. Retrieved 21 April 2018.
- ↑ "Political". Norfolk News. 10 July 1847. p. 3. Retrieved 21 April 2018 – via British Newspaper Archive. (Subscription required (help)).
- ↑ "Reference: D/B 5 Pb1/1". Essex Record Office. Retrieved 21 April 2018.
- ↑ "Neighbouring Counties". Norfolk News. 7 August 1847. p. 3. Retrieved 21 April 2018 – via British Newspaper Archive. (Subscription required (help)).
- ↑ Gardeners Chronicle & New Horticulturist, Volume 7. Haymarket Publishing. 1847. p. 233. Retrieved 21 April 2018.
- ↑ "Bury St Edmunds". Beacon and Christian Times. 13 April 1859. p. 4. Retrieved 21 April 2018.
- ↑ Gash, Norman (2013). Politics in the Age of Peel: A Study in the Technique of Parliamentary Representation, 1830–1850. Faber & Faber. p. 386. ISBN 9780571302901. Retrieved 21 April 2018.
- ↑ "207 Lord Alfred Hervey". Clarke Chronicler's Politicians. 13 July 2013. Retrieved 21 April 2018.
- ↑ https://archive.org/stream/publicgeneralac01walegoog#page/n131/mode/2up Redistribution of Seats Act 1885, Second Schedule; Statutes of the Realm, Eyre & Spottiswoode (1884, London) at p. 123
- ↑ "Bury St Edmunds 1660-". Hansard 1803–2005. UK Parliament. Retrieved 7 February 2015.
- ↑ "Bury St Edmunds parliamentary constituency – Election 2017". BBC.
- 1 2 3 4 Geater, Paul. "Election 2017: Find out who is standing in the general election in Suffolk and north Essex".
- ↑ "Councillor details – Councillor Paul Hopfensperger". 12 October 2017.
- ↑ http://www.westsuffolk.gov.uk/Council/Voting_and_Elections/upload/Statement-of-Persons-Nominated-Notice-of-Poll-and-Situation-of-Polling-Stations-Bury-St-Edmunds-constituency.pdf
- ↑ "Election Data 2015". Electoral Calculus. Archived from the original on 17 October 2015. Retrieved 17 October 2015.
- ↑ "Bury St Edmunds". BBC News. 8 May 2015. Retrieved 8 May 2015.
- ↑ "Jo Churchill selected as Bury St Edmunds candidate for next election". ITN. 5 November 2014. Retrieved 5 November 2014.
- ↑ http://www.labour.org.uk/candidates
- ↑ "Director selected as Tory candidate". BBC. 4 November 2014.
- ↑ "UK > England > Eastern > Bury St Edmunds". BBC News. Retrieved 8 May 2010.
- ↑ "UK General Election results April 1992". Richard Kimber's Political Science Resources. Politics Resources. 9 April 1992. Retrieved 6 December 2010.
- 1 2 F W S Craig, British Parliamentary Election Results 1918–1949; Political Reference Publications, Glasgow 1949
- 1 2 3 4 British parliamentary election results 1918–1949, Craig, F. W. S.
- 1 2 3 4 5 6 7 8 9 British Parliamentary Election Results 1885–1918, FWS Craig
- 1 2 Debrett's House of Commons & Judicial Bench, 1916
- 1 2 3 "The Bury St Edmunds Election". Grantham Journal. 31 August 1907. Retrieved 5 October 2016 – via British Newspaper Archive. (Subscription required (help)).
- 1 2 3 Craig, FWS, ed. (1974). British Parliamentary Election Results: 1885–1918. London: Macmillan Press. ISBN 9781349022984.
- 1 2 3 4 5 6 7 The Liberal Year Book, 1907
- 1 2 Debrett's House of Commons & Judicial Bench, 1901
- ↑ Debrett's House of Commons & Judicial Bench, 1886
- 1 2 3 4 5 6 7 8 9 Craig, F. W. S., ed. (1977). British Parliamentary Election Results 1832–1885 (e-book)
|format=requires|url=(help) (1st ed.). London: Macmillan Press. ISBN 978-1-349-02349-3. - ↑ "Bury St. Edmunds". Diss Express. 4 June 1875. p. 5. Retrieved 28 December 2017 – via British Newspaper Archive. (Subscription required (help)).
- ↑ "Bury St. Edmunds". Evening Mail. 14 July 1865. pp. 1–2. Retrieved 31 January 2018 – via British Newspaper Archive. (Subscription required (help)).
- Sources
- Craig, F. W. S. (1989) [1977]. British parliamentary election results 1832–1885 (2nd ed.). Chichester: Parliamentary Research Services. ISBN 0-900178-26-4.
- Craig, F. W. S. (1989) [1974]. British parliamentary election results 1885–1918 (2nd ed.). Chichester: Parliamentary Research Services. ISBN 0-900178-27-2.
- Craig, F. W. S. (1983) [1969]. British parliamentary election results 1918–1949 (3rd ed.). Chichester: Parliamentary Research Services. ISBN 0-900178-06-X.
External links
- nomis Constituency Profile for Bury St Edmunds – presenting data from the ONS annual population survey and other official statistics.