Demographics of Uganda
This article is about the demographic features of the population of Uganda, including population density, ethnicity, education level, health of the populace, economic status, religious affiliations and other aspects of the population.
 | |
| Languages | |
|---|---|
| English and Regional languages | |
| Religion | |
| Christianity |
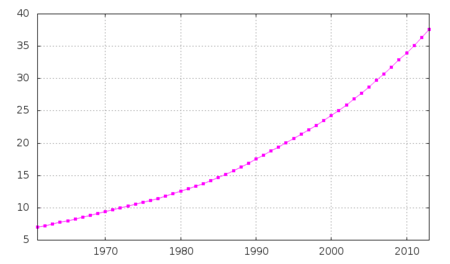
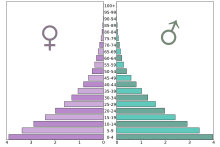
Population
According to the 2019 revision of the World Population Prospects[1][2] the total population was 42,729,036 in 2018, compared to only 5,158,000 in 1950. The proportion of children below the age of 15 in 2015 was 48.1 percent, 49.4 percent was between 15 and 65 years of age, while 2.5 percent was 65 years or older.[3]
| Total population (x 1000) | Population aged 0–14 (%) | Population aged 15–64 (%) | Population aged 65+ (%) | |
|---|---|---|---|---|
| 1950 | 5,158 | 43.1 | 54.0 | 3.0 |
| 1955 | 5,899 | 45.1 | 52.1 | 2.8 |
| 1960 | 6,788 | 45.9 | 51.5 | 2.6 |
| 1965 | 8,014 | 46.6 | 50.9 | 2.6 |
| 1970 | 9,446 | 46.9 | 50.5 | 2.6 |
| 1975 | 10,827 | 47.3 | 50.0 | 2.6 |
| 1980 | 12,548 | 47.6 | 49.7 | 2.6 |
| 1985 | 14,631 | 47.8 | 49.6 | 2.7 |
| 1990 | 17,384 | 48.0 | 49.3 | 2.7 |
| 1995 | 20,413 | 48.5 | 48.8 | 2.7 |
| 2000 | 23,758 | 48.7 | 48.6 | 2.7 |
| 2005 | 28,042 | 48.8 | 48.7 | 2.5 |
| 2010 | 33,149 | 49.1 | 48.5 | 2.5 |
| 2014 Census Results | 34,856 | 47.9 | 49.2 | 2.7 |
United Nations population projections
Numbers are in thousands.
| UN medium var | 2050 | 101,873 |
Refugee population
According to the UNHCR, Uganda hosts over 1.1 million refugees on its soil as of November 2018.[4] Most come from neighbouring countries in the African Great Lakes region, particularly South Sudan (68.0 percent) and Democratic Republic of the Congo (24.6%).[4]
Vital statistics
Registration of births and deaths in Uganda is not yet complete. The Population Division of the United Nations Department of Economic and Social Affairs prepared the following estimates. [3]
| Period | Live births per year | Deaths per year | Natural change per year | CBR* | CDR* | NC* | TFR* | IMR* |
|---|---|---|---|---|---|---|---|---|
| 1950–1955 | 283 000 | 135 000 | 148 000 | 51.3 | 24.5 | 26.8 | 6.90 | 160 |
| 1955–1960 | 317 000 | 139 000 | 178 000 | 50.0 | 22.0 | 28.0 | 6.95 | 145 |
| 1960–1965 | 365 000 | 144 000 | 220 000 | 49.3 | 19.5 | 29.8 | 7.05 | 130 |
| 1965–1970 | 428 000 | 152 000 | 276 000 | 49.0 | 17.4 | 31.6 | 7.12 | 117 |
| 1970–1975 | 494 000 | 156 000 | 338 000 | 48.7 | 16.7 | 33.3 | 7.10 | 112 |
| 1975–1980 | 573 000 | 187 000 | 386 000 | 48.9 | 16.6 | 32.8 | 7.10 | 111 |
| 1980–1985 | 673 000 | 222 000 | 451 000 | 49.3 | 16.9 | 32.8 | 7.10 | 113 |
| 1985–1990 | 802 000 | 269 000 | 533 000 | 49.6 | 18.1 | 32.8 | 7.10 | 116 |
| 1990–1995 | 955 000 | 353 000 | 602 000 | 49.8 | 19.0 | 31.3 | 7.06 | 110 |
| 1995–2000 | 1 096 000 | 399 000 | 686 000 | 48.8 | 18.1 | 30.4 | 6.95 | 98 |
| 2000–2005 | 1 261 000 | 381 000 | 845 000 | 47.8 | 14.7 | 32.1 | 6.75 | 81 |
| 2005–2010 | 1 411 000 | 363 000 | 1 026 000 | 46.1 | 11.9 | 33.2 | 6.38 | 70 |
| 2010–2015 | 1 576 000 | 370 000 | 1 207 000 | 43.7 | 10.2 | 33.2 | 6.38 | 61 |
| * CBR = crude birth rate (per 1000); CDR = crude death rate (per 1000); NC = natural change (per 1000); IMR = infant mortality rate per 1000 births; TFR = total fertility rate (number of children per woman) | ||||||||
Fertility and births
Total Fertility Rate (TFR)(Wanted Fertility Rate) and Crude Birth Rate (CBR):[5][6][7]
| Year | CBR (Total) | TFR (Total) | CBR (Urban) | TFR (Urban) | CBR (Rural) | TFR (Rural) |
|---|---|---|---|---|---|---|
| 1982-1984 | 7.4 | 6.1 | 7.6 | |||
| 1985-1988 | 7.4 | 5.7 | 7.6 | |||
| 1995 | 47.8 | 6.86 (5.6) | 47.7 | 4.97 (3.8) | 47.8 | 7.17 (5.9) |
| 2000-2001 | 47.3 | 6.9 (5.3) | 41.3 | 4.0 (3.2) | 48.0 | 7.4 (5.7) |
| 2006 | 44.8 | 6.7 | 41.0 | 4.4 | 45.3 | 7.1 |
| 2011 | 42.1 | 6.2 (5.1) | 40.3 | 3.8 (3.6) | 42.4 | 6.8 (5.5) |
| 2014 census[8] | 5.8 | |||||
| 2016 | 38.7 | 5.4 (4.3) | 37.0 | 4.0 (3.4) | 39.3 | 5.9 (4.6) |
| 2018-19 | 5.0 | |||||
Fertility data as of 2011 and 2016 (DHS Program):[9]
| Region | Total fertility rate (Wanted fertility rate) 2011 | Percentage of women age 15-49 currently pregnant 2011 | Mean number of children ever born to women age 40-49 2011 |
|---|---|---|---|
| Kampala | 3.3 (2.9) | 8.3 | 5.0 |
| Central 1 | 5.6 (4.2) | 9.9 | 7.2 |
| Central 2 | 6.3 (4.6) | 9.6 | 7.1 |
| East Central | 6.9 (4.4) | 13.7 | 7.9 |
| Eastern | 7.5 (5.3) | 12.5 | 7.5 |
| Karamoja | 6.4 (5.8) | 18.7 | 7.5 |
| North | 6.3 (4.3) | 12.4 | 7.3 |
| West Nile | 6.8 (5.1) | 10.4 | 7.4 |
| Western | 6.4 (4.7) | 13.2 | 7.4 |
| Southwest | 6.2 (4.4) | 11.3 | 7.2 |
| Region | Total fertility rate (Wanted fertility rate) 2016 | Percentage of women age 15-49 currently pregnant 2016 | Mean number of children ever born to women age 40-49 2016 |
|---|---|---|---|
| Kampala | 3.5 (3.1) | 6.6 | 4.7 |
| Karamoja | 7.9 (7.4) | 15.1 | 7.8 |
| West Nile | 6.0 (5.0) | 8.9 | 6.7 |
| South Central | 4.7 (3.9) | 8.5 | 6.4 |
| North Central | 5.4 (4.3) | 10.3 | 6.9 |
| Busoga | 6.1 (4.5) | 12.4 | 7.5 |
| Bukedi | 6.1 (4.3) | 13.7 | 7.4 |
| Bugisu | 5.6 (4.3) | 9.3 | 6.8 |
| Teso | 6.0 (4.8) | 10.4 | 7.8 |
| Lango | 5.1 (3.9) | 10.4 | 7.1 |
| Acholi | 5.5 (3.8) | 9.6 | 7.1 |
| Bunyoro | 6.0 (4.4) | 8.5 | 6.8 |
| Tooro | 5.4 (4.4) | 10.6 | 7.0 |
| Kigezi | 4.6 (3.8) | 9.7 | 6.1 |
| Ankole | 4.9 (4.2) | 8.8 | 6.4 |
Life expectancy at birth
| Period | Life expectancy in Years[10] |
|---|---|
| 1950–1955 | 40.00 |
| 1955–1960 | |
| 1960–1965 | |
| 1965–1970 | |
| 1970–1975 | |
| 1975–1980 | |
| 1980–1985 | |
| 1985–1990 | |
| 1990–1995 | |
| 1995–2000 | |
| 2000–2005 | |
| 2005–2010 | |
| 2010–2015 |
South Asians, Europeans and Arabs
During the Uganda Protectorate period, the British colonialists used South Asian immigrants as intermediaries. Following independence they constituted the largest non-indigenous ethnic group in Uganda, at around 80,000 people, and they dominated trade, industry, and the professions. This caused resentment among the native African majority, which was exploited by post-Independence leaders.
After Idi Amin came to power in 1971, he declared "economic war" on the Indians, culminating in the Expulsion of Asians in Uganda in 1972. Since Amin's overthrow in 1979 some Asians have returned. There are between 15,000 and 25,000 in Uganda today, nearly all in the capital Kampala.
There are also about 10,000 Europeans, mostly of native English origin, and 3,000 Arabs of various national origins in Uganda.
CIA World Factbook demographic statistics
The following demographic statistics are from the CIA World Factbook, unless otherwise indicated.[11]
Population
44,279,563 (June 2018 estimate)
Population growth rate
- 3.2% (2017 est.)
Birth rate
- 42.9 births/1,000 population (2017 est.)
Death rate
- 10.2 deaths/1,000 population (2017 est.)
Net migration rate
- -0.7 migrants/1,000 population (2017 est.)
Urbanization
- urban population: 23.8% of total population (2018)
- rate of urbanization: 5.7% annual rate of change (2015-20 est.)
Sex ratio
at birth:
1.03 male(s)/female
under 15 years:
1.01 male(s)/female
15-64 years:
1.01 male(s)/female
65 years and over:
0.7 male(s)/female
total population:
1.01 male(s)/female (2009 estimate)
Life expectancy at birth
total population:
63.3 years
male:
62.2 years
female:
64.2 years (2014 population census Ubos)
Nationality
noun:
Ugandan
adjective:
Ugandan
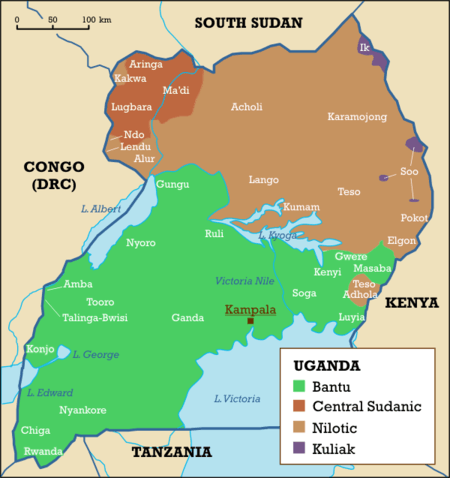
Ethnic groups
Religions
Uganda is a religiously diverse nation with Christianity being the most widely professed religion. According to the 2014 census, over 84 percent of the population was Christian while about 14 percent of the population adhered to Islam, making it the largest minority religion.[13] In 2009, the northern and west Nile regions were dominated by Roman Catholics, and Iganga District in the east of Uganda had the highest percentage of Muslims.[14][12]
- Roman Catholic 39.3%,
- Protestant 45.1%
- Anglican 32%
- Pentecostal 11.1%
- Seventh-Day Adventist 1.7%
- Baptist 0.3%
- Islam 13.7%
- Other 1.6%
- None 0.2%
Languages
English (official national language, taught in grade schools, used in courts of law and by most newspapers and some radio broadcasts), Swahili (recently made second official language, important regionally but spoken by very few people in Uganda), Luganda (most widely used of the Niger–Congo languages, preferred for native language publications in the capital and may be taught in school), other Bantu languages, Nilo-Saharan languages and Arabic.
See also
References
| Wikimedia Commons has media related to Demographics of Uganda. |
- ""World Population prospects – Population division"". population.un.org. United Nations Department of Economic and Social Affairs, Population Division. Retrieved November 9, 2019.
- ""Overall total population" – World Population Prospects: The 2019 Revision" (xslx). population.un.org (custom data acquired via website). United Nations Department of Economic and Social Affairs, Population Division. Retrieved November 9, 2019.
- Population Division of the Department of Economic and Social Affairs of the United Nations Secretariat, World Population Prospects: The 2015 Revision Archived May 6, 2011, at the Wayback Machine
- "Uganda Comprehensive Refugee Response Portal". Operational Data Portal. UNHCR. Retrieved 22 November 2018.
- "MEASURE DHS: Demographic and Health Surveys". microdata.worldbank.org. Retrieved 3 October 2017.
- "The DHS Program - Uganda: Standard DHS, 2011". Dhsprogram.com. Retrieved 3 October 2017.
- "The DHS Program - Uganda: Standard DHS, 2016". Dhsprogram.com. Retrieved 3 October 2017.
- "National Population and Housing Census 2014" (PDF). Ubos.org. Retrieved 3 October 2017.
- "Uganda : Demographic and Health Survey 2011" (PDF). Dhsprogram.com. Retrieved 3 October 2017.
- "World Population Prospects - Population Division - United Nations". esa.un.org. Retrieved 2018-08-26.
- "The World Factbook — Central Intelligence Agency". Cia.gov. Retrieved 3 October 2017.
- "Africa :: UGANDA". CIA The World Factbook.
- Census 2014 Final Results
- United States Department of State (2009-10-26). "Uganda". International Religious Freedom Report 2009. Archived from the original on 2009-11-30. Retrieved 2010-06-05.
| History |  | ||||
|---|---|---|---|---|---|
| Geography |
| ||||
| Politics |
| ||||
| Economy | |||||
| Society |
| ||||