Demographics of the Comoros
The Comorians (Arabic: القمري) inhabiting Grande Comore, Anjouan, and Mohéli (86% of the population) share African-Arab origins. Islam is the dominant religion, and Quranic schools for children reinforce its influence. Although Islamic culture is firmly established throughout, a small minority are Christian.
The most common language is Comorian, related to Swahili. French and Arabic also are spoken. About 89% of the population is literate.
The Comoros have had seven censuses since World War II:[1][2]
- 1951
- 1956
- 1958-09-07: 183,133
- 1966-07-06[3]
- Note: in 1974 Mayotte was removed from the Comoros
- 1980-09-15: 335,150
- 1991-09-15: 446,817
- 2003-09-15: 575,660
Population density figures conceal a great disparity between the republic's most crowded island, Nzwani, which had a density of 470 persons per square kilometer in 1991; Ngazidja, which had a density of 250 persons per square kilometer in 1991; and Mwali, where the 1991 population density figure was 120 persons per square kilometer. Overall population density increased to about 285 persons per square kilometer by 1994. By comparison, estimates of the population density per square kilometer of the Indian Ocean's other island microstates ranged from 241 (Seychelles) to 690 (Maldives) in 1993. Given the rugged terrain of Ngazidja and Nzwani, and the dedication of extensive tracts to agriculture on all three islands, population pressures on the Comoros are becoming increasingly critical.
The age structure of the population of the Comoros is similar to that of many developing countries, in that the republic has a very large proportion of young people. In 1989, 46.4 percent of the population was under fifteen years of age, an above-average proportion even for sub-Saharan Africa. The population's rate of growth was a relatively high 3.5 percent per annum in the mid 1980s, up substantially from 2.0 percent in the mid-1970s and 2.1 percent in the mid-1960s.
In 1983 the Abdallah regime borrowed US$2.85 million from the International Development Association to devise a national family planning program. However, Islamic reservations about contraception made forthright advocacy and implementation of birth control programs politically hazardous, and consequently little was done in the way of public policy.
The Comorian population has become increasingly urbanized in recent years. In 1991 the percentage of Comorians residing in cities and towns of more than 5,000 persons was about 30 percent, up from 25 percent in 1985 and 23 percent in 1980. The Comoros' largest cities were the capital, Moroni, with about 30,000 people, and the port city of Mutsamudu, on the island of Nzwani, with about 20,000 people.
Migration among the various islands is important. Natives of Nzwani have settled in significant numbers on less crowded Mwali, causing some social tensions, and many Nzwani also migrate to Maore. In 1977 Maore expelled peasants from Ngazidja and Nzwani who had recently settled in large numbers on the island. Some were allowed to reenter starting in 1981 but solely as migrant labor.
The number of Comorians living abroad has been estimated at between 80,000 and 100,000; during the colonial period, most of them lived in Tanzania, Madagascar, and other parts of Southeast Africa. The number of Comorians residing in Madagascar was drastically reduced after anti-Comorian rioting in December 1976 in Mahajanga, in which at least 1,400 Comorians were killed. As many as 17,000 Comorians left Madagascar to seek refuge in their native land in 1977 alone. About 100,000 Comorians live in France; many of them had gone there for a university education and never returned. Small numbers of Indians, Malagasy, South Africans, and Europeans (mostly French) live on the islands and play an important role in the economy. Most French left after independence in 1975.
Some Persian Gulf countries started buying Comorian citizenship for their stateless bidoon residents and deporting them to Comoros.[4][5][6]
90% of the people living in the Comoros are black, and 10% are mixed race, mostly black and white.
Population
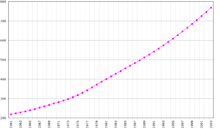
UN population projections
UN medium variant projections.[7]
| Population | |
|---|---|
| 2010 | 734,750 |
| 2015 | 832,400 |
| 2020 | 933,330 |
| 2025 | 1,041,150 |
| 2030 | 1,160,260 |
| 2035 | 1,290,200 |
| 2040 | 1,425,970 |
| 2045 | 1,562,910 |
| 2050 | 1,700,130 |
Vital statistics
Statistics as of 2010:[8]
| Period | Live births per year | Deaths per year | Natural change per year | CBR* | CDR* | NC* | TFR* | IMR* |
|---|---|---|---|---|---|---|---|---|
| 1950–1955 | 8 000 | 4 000 | 4 000 | 46.8 | 24.0 | 22.8 | 6.00 | 178 |
| 1955–1960 | 9 000 | 4 000 | 5 000 | 48.9 | 22.9 | 26.0 | 6.60 | 167 |
| 1960–1965 | 10 000 | 4 000 | 6 000 | 48.0 | 20.8 | 27.2 | 6.91 | 154 |
| 1965–1970 | 11 000 | 4 000 | 6 000 | 46.8 | 18.9 | 27.9 | 7.05 | 141 |
| 1970–1975 | 12 000 | 4 000 | 8 000 | 46.8 | 16.9 | 29.8 | 7.05 | 127 |
| 1975–1980 | 14 000 | 5 000 | 10 000 | 47.9 | 15.6 | 32.3 | 7.05 | 116 |
| 1980–1985 | 17 000 | 5 000 | 12 000 | 48.6 | 14.3 | 34.4 | 7.05 | 106 |
| 1985–1990 | 16 000 | 5 000 | 11 000 | 39.6 | 12.1 | 27.5 | 6.00 | 95 |
| 1990–1995 | 17 000 | 5 000 | 12 000 | 36.6 | 11.0 | 25.6 | 5.30 | 89 |
| 1995–2000 | 20 000 | 6 000 | 15 000 | 38.6 | 10.6 | 28.0 | 5.30 | 83 |
| 2000–2005 | 24 000 | 6 000 | 18 000 | 40.2 | 10.1 | 30.0 | 5.30 | 78 |
| 2005–2010 | 27 000 | 7 000 | 20 000 | 39.0 | 9.4 | 29.5 | 5.08 | 72 |
| * CBR = crude birth rate (per 1000); CDR = crude death rate (per 1000); NC = natural change (per 1000); IMR = infant mortality rate per 1000 births; TFR = total fertility rate (number of children per woman) | ||||||||
Fertility and Births
Total Fertility Rate (TFR) (Wanted Fertility Rate) and Crude Birth Rate (CBR):[9]
| Year | CBR (Total) | TFR (Total) | CBR (Urban) | TFR (Urban) | CBR (Rural) | TFR (Rural) |
|---|---|---|---|---|---|---|
| 1996 | 33.9 | 5.1 (3.7) | 28.9 | 4.1 (3.1) | 35.8 | 5.5 (4.0) |
| 2012 | 32.3 | 4.3 (3.2) | 27.7 | 3.5 (2.5) | 34.5 | 4.8 (3.5) |
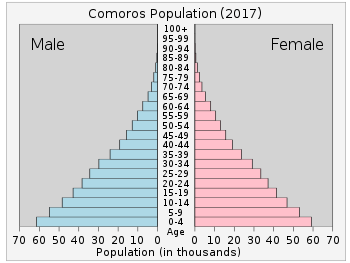
Structure of the population (DHS 2012) (Males 11 088, Females 12 284 = 23 373) :
| Age Group | Male (%) | Female (%) | Total (%) |
|---|---|---|---|
| 0–4 | 15.5 | 13.6 | 14.5 |
| 5–9 | 15.0 | 13.8 | 14.4 |
| 10–14 | 13.9 | 11.8 | 12.8 |
| 15–19 | 10.1 | 11.2 | 10.7 |
| 20–24 | 6.8 | 8.6 | 7.8 |
| 25–29 | 5.4 | 7.8 | 6.7 |
| 30–34 | 5.8 | 6.5 | 6.2 |
| 35–39 | 6.0 | 5.4 | 5.7 |
| 40–44 | 4.5 | 4.0 | 4.2 |
| 45–49 | 3.2 | 2.5 | 2.9 |
| 50–54 | 2.9 | 4.9 | 3.9 |
| 55–59 | 1.7 | 2.2 | 2.0 |
| 60–64 | 3.3 | 2.6 | 2.9 |
| 65–69 | 1.5 | 1.3 | 1.4 |
| 70–74 | 2.3 | 1.7 | 2.0 |
| 75–79 | 0.8 | 0.8 | 0.8 |
| 80+ | 1.2 | 1.3 | 1.3 |
| Unknown | 0.1 | 0.1 | 0.1 |
| Age group | Male (%) | Female (%) | Total (%) |
|---|---|---|---|
| 0–14 | 44.4 | 39.2 | 41.7 |
| 15–64 | 49.7 | 55.6 | 52.7 |
| 65+ | 5.8 | 5.1 | 5.5 |
Fertility data as of 2012 (DHS Program):[10]
| Region | Total fertility rate | Percentage of women age 15-49 currently pregnant | Mean number of children ever born to women age 40-49 |
|---|---|---|---|
| Mohéli | 5.0 | 6.8 | 6.3 |
| Anjouan | 5.2 | 6.7 | 5.8 |
| Grande Comore | 3.5 | 6.5 | 4.6 |
Other demographic statistics
Demographic statistics according to the World Population Review in 2019.[11]
- One birth every 20 minutes
- One death every 85 minutes
- One net migrant every 288 minutes
- Net gain of one person every 28 minutes
The following demographic statistics are from the CIA World Factbook.[12]
Population
- 821,164 (July 2018 est.)
- 690,948 (July 2006 est.)
Age structure
- 0-14 years: 38.54% (male 157,764 /female 158,676)
- 15-24 years: 19.89% (male 79,133 /female 84,181)
- 25-54 years: 33.25% (male 129,645 /female 143,408)
- 55-64 years: 4.34% (male 15,957 /female 19,690)
- 65 years and over: 3.98% (male 14,881 /female 17,829) (2018 est.)
- 0–14 years: 42.7% (male 148,009/female 147,038)
- 15–64 years: 54.3% (male 185,107/female 190,139)
- 65 years and over: 3% (male 9,672/female 10,983) (2006 est.)
Median age
- total: 20.2 years. Country comparison to the world: 188th
- male: 19.5 years
- female: 20.8 years (2018 est.)
- Total: 18.6 years
- Male: 18.4 years
- Female: 18.9 years (2006 est.)
Population growth rate
- 1.57% (2018 est.) Country comparison to the world: 66th
- 2.87% (2006 est.)
Birth rate
- 25.3 births/1,000 population (2018 est.) Country comparison to the world: 49th
Death rate
- 7.1 deaths/1,000 population (2018 est.) Country comparison to the world: 125th
Net migration rate
- -2.4 migrant(s)/1,000 population (2017 est.) Country comparison to the world: 168th
Total fertility rate
- 3.21 children born/woman (2018 est.) Country comparison to the world: 46th
Mother's mean age at first birth
- 24.6 years (2012 est.)
- note: median age at first birth among women 25-29
Contraceptive prevalence rate
- 19.4% (2012)
Dependency ratios
total dependency ratio: 75.5 (2015 est.) youth dependency ratio: 70.5 (2015 est.) elderly dependency ratio: 5.1 (2015 est.) potential support ratio: 19.7 (2015 est.)
Urbanization
- urban population: 29% of total population (2018)
- rate of urbanization: 2.87% annual rate of change (2015-20 est.)
Sex ratio
- At birth: 1.03 male(s)/female
- Under 15 years: 1.01 male(s)/female
- 15–64 years: 0.97 male(s)/female
- 65 years and over: 0.88 male(s)/female
- Total population: 0.99 male(s)/female (2006 est.)
Life expectancy at birth
- Total population: 62.33 years
- Male: 60 years
- Female: 64.72 years (2006 est.)
HIV/AIDS
- Adult prevalence rate: 0.12% (2001 est.)
- People living with HIV/AIDS: NA
- Deaths: NA
Nationality
- Noun: Comorian(s)
- Adjective: Comorian
Religions
- Sunni Islam 98%, Roman Catholic 2%[13]
Literacy
- Definition: age 15 and over who can read and write
- total population: 77.8% (2015 est.)
- male: 81.8% (2015 est.)
- female: 73.7% (2015 est.)
- Total population: 56.5%
- Male: 63.6%
- Female: 49.3% (2003 est.)
School life expectancy (primary to tertiary education)
- total: 11 years (2014)
- male: 11 years (2014)
- female: 11 years (2014)
References
| Wikimedia Commons has media related to Demographics of Comoros. |
- "Comoros population statistics". GeoHive. Archived from the original on 10 June 2011.
- Population census of the Comoro Islands, 1951, 1956 and 1958 (mircofilm)
|format=requires|url=(help). New Haven, Connecticut: Research Publications. 1977. OCLC 3659638. - Institut national de la statistique et des études économiques (1966). Recensement de la population des Comores 1966: résultats par village, sexe et groupe d'âge. Paris: Institut national de la statistique et des études économiques. OCLC 13015378.
- http://icfuae.org.uk/research-and-publications/stateless-and-sale-gulf
- https://stepfeed.com/kuwait-trying-to-sell-its-bidoon-population-to-comoros-3979
- https://www.theguardian.com/world/2015/nov/11/the-bizarre-scheme-to-transform-a-remote-island-into-new-dubai-comoros
- "World Population Prospects, the 2010 Revision". Esa.un.org. 2011-06-28. Retrieved 2011-12-21.
- World Population Prospects: The 2010 Revision Archived May 6, 2011, at the Wayback Machine
- "MEASURE DHS: Demographic and Health Surveys". microdata.worldbank.org.
- "Enquête Démographique et de Santé et à Indicateurs Multiples (EDSC-MICS II) 2012" (PDF). Dhsprogram.com. Retrieved 7 November 2017.
- "Comoros Population 2019", World Population Review
- "The World FactBook - Comoros", The World Factbook, July 12, 2018

- "Africa :: COMOROS". CIA The World Factbook.
![]()
![]()
| History |  | ||
|---|---|---|---|
| Geography | |||
| Politics | |||
| Economy | |||
| Society | |||