Demographics of Madagascar
This article is about the demographic features of the population of Madagascar, including population density, ethnicity, education level, health of the populace, economic status, religious affiliations and other aspects of the population.
Madagascar's population is predominantly of mixed Austronesian and East African origin.
Population
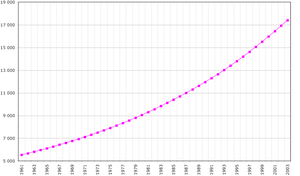
The problem with population estimation in Madagascar is that data is very old and limited. The last population census was carried out in 1993, after an initial 1975 census. There was an attempt at a census in 2009, but this attempt ultimately failed due to political instability. Therefore, the demographic situation is inferred but reliability of any estimates from any source has a large margin of error. According to the 2017 revision of the World Population Prospects[1] the total population was 24,894,551 in 2016, compared to only 4,084,000 in 1950. The proportion of children below the age of 15 in 2010 was 43.1%, 53.8% was between 15 and 65 years of age, while 3.1% was 65 years or older .[2]
| Total population (thousands) | Population aged 0–14 (%) | Population aged 15–64 (%) | Population aged 65+ (%) | |
|---|---|---|---|---|
| 1950 | 4,084 | 38.2 | 58.6 | 3.2 |
| 1955 | 4,548 | 40.2 | 56.6 | 3.2 |
| 1960 | 5,104 | 42.6 | 54.1 | 3.3 |
| 1965 | 5,764 | 44.6 | 52.0 | 3.4 |
| 1970 | 6,549 | 45.1 | 51.3 | 3.6 |
| 1975 | 7,502 | 45.6 | 50.6 | 3.8 |
| 1980 | 8,609 | 45.9 | 50.5 | 3.6 |
| 1985 | 9,785 | 45.1 | 51.6 | 3.3 |
| 1990 | 11,281 | 44.7 | 52.1 | 3.2 |
| 1995 | 13,129 | 44.5 | 52.4 | 3.1 |
| 2000 | 15,364 | 45.3 | 51.6 | 3.1 |
| 2005 | 17,886 | 44.6 | 52.3 | 3.1 |
| 2010 | 20,714 | 43.1 | 53.8 | 3.1 |
Structure of the population (DHS 2013) (males 18,875, females 19,483, total 38,358):
| Age group | Male (%) | Female (%) | Total (%) |
|---|---|---|---|
| 0–4 | 16.6 | 15.9 | 16.2 |
| 5–9 | 15.8 | 15.4 | 15.6 |
| 10–14 | 15.1 | 14.8 | 15.0 |
| 15–19 | 10.7 | 9.4 | 10.1 |
| 20–24 | 7.4 | 7.4 | 7.4 |
| 25–29 | 5.6 | 6.6 | 6.1 |
| 30–34 | 5.7 | 6.5 | 6.1 |
| 35–39 | 4.5 | 5.0 | 4.8 |
| 40–44 | 4.4 | 4.5 | 4.5 |
| 45–49 | 3.2 | 3.1 | 3.2 |
| 50–54 | 3.4 | 3.8 | 3.6 |
| 55–59 | 2.2 | 2.2 | 2.2 |
| 60–64 | 2.1 | 2.1 | 2.1 |
| 65–69 | 1.1 | 1.1 | 1.1 |
| 70–74 | 0.9 | 0.8 | 0.9 |
| 75–79 | 0.5 | 0.5 | 0.5 |
| 80+ | 0.6 | 0.7 | 0.6 |
| unknown | 0.2 | 0.1 | 0.1 |
| Age group | Male (%) | Female (%) | Total (%) |
|---|---|---|---|
| 0–14 | 47.5 | 46.1 | 46.8 |
| 15–64 | 49.2 | 50.7 | 50.0 |
| 65+ | 3.1 | 3.1 | 3.1 |
UN population projections
UN medium variant projections:[2]
| Year | Projected population (thousands) |
|---|---|
| 2015 | 23,852 |
| 2020 | 27,365 |
| 2025 | 31,217 |
| 2030 | 35,333 |
| 2035 | 39,643 |
| 2040 | 44,132 |
| 2045 | 48,782 |
| 2050 | 53,561 |
Vital statistics
Registration of vital events in Madagascar is not complete. The Population Department of the United Nations prepared the following estimates. [2]
| Period | Live births per year | Deaths per year | Natural change per year | CBR* | CDR* | NC* | TFR* | IMR* |
|---|---|---|---|---|---|---|---|---|
| 1950–1955 | 212,000 | 119,000 | 93,000 | 49.0 | 27.5 | 21.5 | 7.30 | 181 |
| 1955–1960 | 236,000 | 125,000 | 111,000 | 48.8 | 25.8 | 23.0 | 7.30 | 167 |
| 1960–1965 | 262,000 | 130,000 | 132,000 | 48.3 | 24.0 | 24.3 | 7.30 | 155 |
| 1965–1970 | 295,000 | 136,000 | 159,000 | 47.9 | 22.1 | 25.7 | 7.30 | 143 |
| 1970–1975 | 339,000 | 145,000 | 194,000 | 48.3 | 20.6 | 27.7 | 7.30 | 132 |
| 1975–1980 | 379,000 | 152,000 | 227,000 | 47.0 | 18.8 | 28.2 | 7.00 | 122 |
| 1980–1985 | 388,000 | 152,000 | 237,000 | 42.2 | 16.5 | 25.7 | 6.10 | 111 |
| 1985–1990 | 474,000 | 173,000 | 301,000 | 45.0 | 16.4 | 28.6 | 6.30 | 110 |
| 1990–1995 | 545,000 | 174,000 | 371,000 | 44.7 | 14.3 | 30.4 | 6.14 | 96 |
| 1995–2000 | 609,000 | 161,000 | 448,000 | 42.8 | 11.3 | 31.5 | 5.80 | 76 |
| 2000–2005 | 649,000 | 143,000 | 505,000 | 39.0 | 8.6 | 30.4 | 5.28 | 58 |
| 2005–2010 | 698,000 | 131,000 | 567,000 | 36.2 | 6.8 | 29.4 | 4.83 | 45 |
| * CBR = crude birth rate (per 1000); CDR = crude death rate (per 1000); NC = natural change (per 1000); IMR = infant mortality rate per 1000 births; TFR = total fertility rate (number of children per woman) | ||||||||
Fertility and Births
Total Fertility Rate (TFR) and Crude Birth Rate (CBR):[3]
| Year | CBR (Total) | TFR (Total) | CBR (Urban) | TFR (Urban) | CBR (Rural) | TFR (Rural) |
|---|---|---|---|---|---|---|
| 1992 | 43.3 | 6.13 (5.2) | 34.2 | 3.84 (3.0) | 45.1 | 6.69 (5.8) |
| 1997 | 42.3 | 5.97 (5.2) | 34.5 | 4.19 (3.8) | 45.0 | 6.66 (5.8) |
| 2003–04 | 35.3 | 5.2 (4.7) | 28.7 | 3.7 (3.4) | 37.2 | 5.7 (5.1) |
| 2008–09 | 33.4 | 4.8 (4.2) | 24.8 | 2.9 (2.5) | 34.8 | 5.2 (4.5) |
Fertility data as of 2008-2009 (DHS Program):[4]
| Region | Total fertility rate | Percentage of women age 15–49 currently pregnant | Mean number of children ever born to women age 40–49 |
|---|---|---|---|
| Analamanga | 3.4 | 5.7 | 4.3 |
| Vakinankaratra | 5.3 | 7.4 | 6.0 |
| Itasy | 5.5 | 6.7 | 6.9 |
| Bongolava | 3.8 | 6.9 | 5.4 |
| Haute Matsiatra | 6.4 | 7.5 | 6.8 |
| Amoron'i Mania | 6.1 | 5.3 | 6.7 |
| Vatovavy Fitovinany | 6.5 | 10.3 | 6.5 |
| Ihorombe | 5.9 | 10.6 | 5.5 |
| Atsimo Atsinanana | 6.3 | 11.4 | 6.0 |
| Atsinanana | 3.0 | 9.2 | 4.1 |
| Analanjirofo | 4.6 | 6.6 | 5.7 |
| Alaotra Mangoro | 5.0 | 9.1 | 5.5 |
| Boeny | 4.5 | 9.1 | 4.9 |
| Sofia | 4.4 | 10.7 | 5.9 |
| Betsiboka | 4.7 | 10.5 | 6.1 |
| Melaky | 4.7 | 12.2 | 5.5 |
| Atsimo Andrefana | 6.2 | 13.2 | 6.3 |
| Androy | 6.4 | 10.8 | 5.6 |
| Anosy | 5.5 | 8.6 | 5.7 |
| Menabe | 4.8 | 11.3 | 5.9 |
| Diana | 3.7 | 6.8 | 4.9 |
| Sava | 4.5 | 6.3 | 5.0 |
Life expectancy
| Period | Life expectancy in Years |
Period | Life expectancy in Years |
|---|---|---|---|
| 1950–1955 | 36.3 | 1985–1990 | 49.9 |
| 1955–1960 | 38.8 | 1990–1995 | 52.7 |
| 1960–1965 | 41.2 | 1995–2000 | 56.7 |
| 1965–1970 | 43.5 | 2000–2005 | 60.0 |
| 1970–1975 | 46.0 | 2005–2010 | 62.2 |
| 1975–1980 | 48.1 | 2010–2015 | 64.5 |
| 1980–1985 | 49.7 |
Source: UN World Population Prospects[5]
Ethnicity
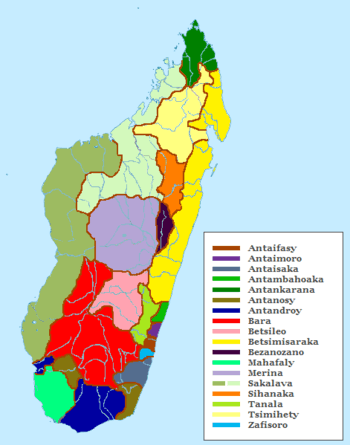
The island of Madagascar is predominantly populated by people broadly classified as belonging to the Malagasy ethno-linguistic group. This group is further subdivided a number of ethnic groups, often into the standard eighteen. In addition, communities of Indians and Arabs have long been established on the island and have assimilated into local communities to varying degrees, in some places having long since become identified "Malagasy" ethnic groups, and in others maintaining distinct identities and cultural separation. More recent arrivals include Europeans and Chinese immigrants.
Madagascar was probably uninhabited prior to Austronesian settlement in the early centuries AD. Austronesian features are most predominant in the central highlands people, the Merina (3 million) and the Betsileo (2 million); the remaining 16 tribal groupings are coastal peoples who are predominantly of East African origin, with various Malay, Arab, European and Indian admixtures. The largest coastal groups are the Betsimisaraka (1,500,000) and the Tsimihety and Sakalava (700,000 each). Malagasy society has long been polarized between the politically and economically advantaged highlanders of the central plateaux and the people along the coast. For example, in the 1970s there was widespread opposition among coastal ethnics against the policy of "Malagasization" which intended to phase out the use of the French language in public life in favour of a more prominent position for the Malagasy language, whose orthography is based on the Merina dialect. Identity politics were also at the core of the brief civil unrest during 2002.
Indians in Madagascar descend mostly from traders who arrived in the newly independent nation looking for better opportunities. The majority of them came from the west coast of India known as Karana (Muslim) and Banian (Hindu). The majority speak Hindi or Gujarati, although some other Indian dialects are also spoken. Nowadays the younger generations speak at least three languages, including French, Gujarati and Malagasy. A large number of the Indians in Madagascar have a high level of education, particularly the younger generation.
A sizeable number of Europeans also reside in Madagascar, mostly of French descent.
Religion
Religion in Madagascar (2010) according to the Pew Research Center[6]
According to the US Department of State in 2011, 41% of Madagascans practice Christianity and 52% practice traditional religion,[7] which tends to emphasize links between the living and the razana (ancestors). But according to the Pew Research Center in 2010, only 4.5% of Madagascans practice folk religions and 85% are Christian, with practitioners of Protestantism outnumbering adherents to Roman Catholicism.[6]
Madagascar's traditional religions tend to emphasize links between the living and the dead. They believe that the dead join their ancestors in the ranks of divinity and that ancestors are intensely concerned with the fate of their living descendants. This spiritual communion is celebrated by the Merina and Betsileo reburial practice of famadihana, or "turning over the dead". In this ritual, relatives' remains are removed from the family tomb, rewrapped in new silk shrouds, and returned to the tomb following festive ceremonies in their honor. In the festivities, they eat, drink, and literally dance with the dead. After one or two days of celebrating, they shower the body with gifts and rebury it.
Malagasy Christians are mostly Protestant (mainly Reformed Protestant Church of Jesus Christ in Madagascar (FJKM), Lutheran, and Anglican) or Roman Catholic, but there are also smaller groups such as members of The Church of Jesus Christ of Latter-day Saints (Mormons), Jehovah's Witnesses, Seventh-day Adventists,[8] and Eastern Orthodox Christians. Many incorporate the cult of the dead with their other religious beliefs and bless their dead at church before proceeding with the traditional burial rites. They also may invite a pastor to attend a famadihana. A historical rivalry exists between the predominantly Catholic masses, considered to be underprivileged, and the predominantly Protestant Merina aristocrats, who tend to prevail in the civil service, business, and professions.
Followers of Islam constitute approximately 7% of the population, according to the US Department of State in 2011,[7] (down from their earlier estimate of 10 to 15% in 2009[8]), or 3% according to the Pew Research Center in 2010.[6] They are mostly concentrated in the north, northwest, and southeast.[8] There are also a small number of Hindus.[8]
The Church of Jesus Christ of Latter-day Saints has more than 8.000 members in 33 congregations in Madagascar.[9]
CIA World Factbook demographic statistics
The following demographic statistics are from the CIA World Factbook, unless otherwise indicated.[10]
Sex ratio:
at birth:
1.03 male(s)/female
under 15 years:
1.01 male(s)/female
15–64 years:
0.98 male(s)/female
65 years and over:
0.89 male(s)/female
total population:
0.99 male(s)/female (2000 est.)
Life expectancy at birth:
total population:
66.3 years
male:
64.7 years
female:
67.8 years (2017 est.)
Nationality:
noun:
Malagasy (singular and plural)
adjective:
Malagasy
Ethnic groups: Malayo-Indonesian (Merina and related Betsileo), coastal ethnics (mixed African, Malayo-Indonesian, and Arab ancestry – Betsimisaraka, Tsimihety, Antaisaka, Sakalava), French, Desi, Creole, Comorian, Chinese
Religions: indigenous beliefs 52%, Christian 41%, Muslim 7%
Languages: Malagasy (official, and national language), French (official).
Literacy:
definition:
age 15 and over can read and write
total population:
64.7%
male:
66.7%
female:
62.6% (2015 est.)
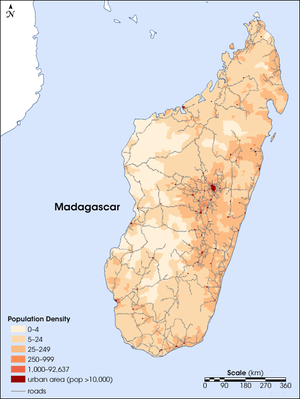
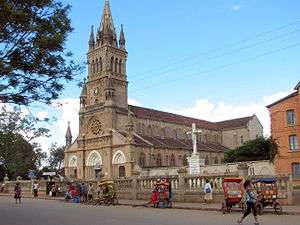
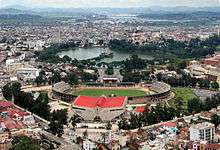
Largest cities
| Rank | Name | Region | Pop. | ||||||
|---|---|---|---|---|---|---|---|---|---|
 Antananarivo 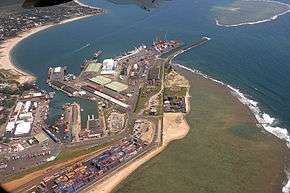 Toamasina |
1 | Antananarivo | Analamanga | 1 391 433 | 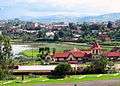 Antsirabe  Fianarantsoa | ||||
| 2 | Toamasina | Atsinanana | 206 373 | ||||||
| 3 | Antsirabe | Vakinankaratra | 186 253 | ||||||
| 4 | Fianarantsoa | Haute Matsiatra | 167 227 | ||||||
| 5 | Mahajanga | Boeny | 154 657 | ||||||
| 6 | Toliara | Atsimo-Andrefana | 115 319 | ||||||
| 7 | Antsiranana | Diana | 82 937 | ||||||
| 8 | Antanifotsy | Vakinankaratra | 70 626 | ||||||
| 9 | Ambovombe-Androy | Androy | 66 818 | ||||||
| 10 | Amparafaravola | Amparafaravola | 51 519 | ||||||
The largest city in Madagascar is Antananarivo. The next largest cities are Toamasina, Antsirabe, Fianarantsoa, Mahajanga, and Toliara.
References
- ↑ "World Population Prospects: The 2017 Revision". ESA.UN.org (custom data acquired via website). United Nations Department of Economic and Social Affairs, Population Division. Retrieved 10 September 2017.
- 1 2 3 Population Division of the Department of Economic and Social Affairs of the United Nations Secretariat, World Population Prospects: The 2010 Revision Archived May 6, 2011, at the Wayback Machine.
- ↑ "MEASURE DHS: Demographic and Health Surveys". microdata.worldbank.org.
- ↑ "Madagascar Health and Demographic Survey 2008-2009" (PDF). Madagascar Health and Demographic Survey. 2009.
- ↑ "World Population Prospects – Population Division – United Nations". Retrieved 2017-07-15.
- 1 2 3 "Religions in Madagascar | PEW-GRF". Globalreligiousfutures.org. Retrieved 20 September 2017.
- 1 2 Bureau of African Affairs (3 May 2011). "Background Note: Madagascar". U.S. Department of State. Archived from the original on 24 August 2011. Retrieved 24 August 2011.
- 1 2 3 4 "Madagascar". US Department of State. 2009.
- ↑ "Madagascar", Facts and Statistics, Newsroom, LDS Church, retrieved 2013-03-10
- ↑ "The World Factbook — Central Intelligence Agency". www.cia.gov.
| Wikimedia Commons has media related to Demographics of Madagascar. |
See also
- Matthew E. Hules, et al. (2005). The Dual Origin of the Malagasy in Island Southeast Asia and East Africa: Evidence from Maternal and Paternal Lineages. American Journal of Human Genetics, 76:894-901, 2005.
| Indigenous | |
|---|---|
| Immigrant | |
See also: Vazimba | |