Norfolk County Council election, 2017
|
| |||||||||||||||||||||||||||||||||||||||||||||||||||||||||||||
| |||||||||||||||||||||||||||||||||||||||||||||||||||||||||||||
All 84 seats to Norfolk County Council 43 seats needed for a majority | |||||||||||||||||||||||||||||||||||||||||||||||||||||||||||||
|---|---|---|---|---|---|---|---|---|---|---|---|---|---|---|---|---|---|---|---|---|---|---|---|---|---|---|---|---|---|---|---|---|---|---|---|---|---|---|---|---|---|---|---|---|---|---|---|---|---|---|---|---|---|---|---|---|---|---|---|---|---|
| |||||||||||||||||||||||||||||||||||||||||||||||||||||||||||||
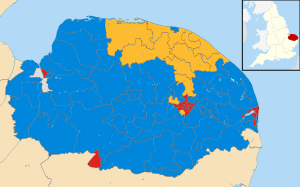 Map showing the results of the 2017 Norfolk County Council elections. | |||||||||||||||||||||||||||||||||||||||||||||||||||||||||||||
| |||||||||||||||||||||||||||||||||||||||||||||||||||||||||||||
The 2017 Norfolk County Council election took place on 4 May 2017 as part of the 2017 local elections in the United Kingdom.[1]
The Conservative Party won control of the council from No Overall Control.
All three major parties made gains at the expense of the UK Independence Party and the Green Party of England and Wales, both of which lost all their seats. The Conservatives benefited the most, making a net gain of 15 seats from UKIP and the Liberal Democrats, while Labour bucked its national trend of poor results and made a net gain of 3 seats. The Liberal Democrats saw their seat number rise from 10 to 11, winning one off UKIP. An independent candidate was also elected.
This was the first election since 2001 in which no UKIP or Green candidates were elected. The election saw significant changes in the popular vote, with UKIP's vote share declining by 17.5 percentage points and the Green Party winning just 4% of the county-wide vote, its worst result in Norfolk since the 1997 election.
Previous composition
2013 election
| Party | Seats | |
|---|---|---|
| Conservative | 40 | |
| UKIP | 15 | |
| Labour | 14 | |
| Liberal Democrat | 10 | |
| Green | 4 | |
| Independent | 1 | |
| Total | 84 | |
Composition of council seats before election
| Party | Seats | |
|---|---|---|
| Conservative | 42 | |
| Labour | 14 | |
| UKIP | 12 | |
| Liberal Democrat | 10 | |
| Green | 3 | |
| Independent | 3[2] | |
| Total | 84 | |
Changes between elections
In between the 2013 election and the 2017 election, the following council seats changed hands:
| Division | Date | Previous Party | New Party | Cause | Resulting Council Composition | |||||||
|---|---|---|---|---|---|---|---|---|---|---|---|---|
| Con | UKIP | Lab | LDem | Grn | Ind | |||||||
| Thorpe Hamlet | 9 December 2016[3] | Green | Conservative | Sitting Green Councillor defected to Conservatives. | 42 | 12 | 14 | 10 | 3 | 3 | ||
| Watton | 19 November 2015[4] | UKIP | Conservative | UKIP incumbent resigned. Conservatives won by-election. | 41 | 12 | 14 | 10 | 4 | 3 | ||
| Dersingham | 24 July 2015[5] | Conservative | Independent | Councillor quit party to sit as independent member. | 40 | 13 | 14 | 10 | 4 | 3 | ||
| Gorleston St Andrews | 16 July 2015[6] | UKIP | Conservative | UKIP incumbent resigned. Conservatives won by-election. | 41 | 13 | 14 | 10 | 4 | 2 | ||
| Clenchwarton and King's Lynn South | 27 February 2014[7] | Labour | Independent | Councillor quit party to sit as an independent member. | 40 | 14 | 14 | 10 | 4 | 2 | ||
| Thetford West | 1 August 2013[8] | UKIP | Labour | UKIP incumbent resigned. Labour won by-election. | 40 | 14 | 15 | 10 | 4 | 1 | ||
The leadership of the Council also changed from 2013. In May 2016, a Leadership election saw George Nobbs (Labour) removed as Council Leader and replaced with Cliff Jordan (Conservative). The vote was 41 for Cliff Jordan and 37 for George Nobbs.
Summary of Results
| Party | Seats | Gains | Losses | Net gain/loss | Seats % | Votes % | Votes | +/− | |
|---|---|---|---|---|---|---|---|---|---|
| Conservative | 55 | 17 | 2 | +15 | 65.5 | 48.8 | 114,038 | +16.2 | |
| Labour | 17 | 6 | 3 | +3 | 20.2 | 23.2 | 54,231 | +0.4 | |
| Liberal Democrat | 11 | 4 | 3 | +1 | 13.1 | 17.4 | 40,680 | +6.4 | |
| UKIP | 0 | 0 | 15 | -15 | — | 6.0 | 14,078 | -17.5 | |
| Green | 0 | 0 | 4 | -4 | — | 4.0 | 9,316 | -2.6 | |
| Independent | 1 | 1 | 1 | 0 | 1.2 | 0.7 | 1,526 | -2.8 | |
| Total | 84 | 233,869 | |||||||
Election of Party Leaders
Cliff Jordan (Yare and All Saints) was re-elected leader of the Conservative Group. Steve Morphew (Catton Grove) challenged the incumbent group leader George Nobbs (Crome) for the leadership of the Labour Group and won. Marie Strong (Wells) who had been leader of the Liberal Democrat group, stood down and was replaced by Dan Roper (Hevingham and Spixworth) (with newly elected Steffan Aquarone (Melton Constable) as deputy leader of the group).[9]
Election of Leader of the Council
Leader of the Conservative group, Cliff Jordan was re-elected leader of the council, and was able to form a majority Conservative administration.
Candidates and results by division
Breckland
Attleborough
| Party | Candidate | Votes | % | ± | |
|---|---|---|---|---|---|
| Conservative | Rhodri Oliver | 1685 | 63% | +24.% | |
| Labour | Phil Spiby | 632 | 24% | +1% | |
| Liberal Democrat | Christopher Brian MacKinnon | 338 | 13% | +7% | |
| Majority | 1053 | 39.7% | +7.6% | ||
| Turnout | 2655 | 28.37% | +2.01% | ||
| Conservative hold | Swing | ||||
Dereham North
| Party | Candidate | Votes | % | ± | |
|---|---|---|---|---|---|
| Conservative | William Robert James Richmond | 1512 | 65% | +28% | |
| Labour | Liz Hunton | 478 | 21% | +1% | |
| Green | Ann Patricia Robertson Bowyer | 205 | 9% | 0% | |
| Liberal Democrat | Erlend Watson | 120 | 5% | ||
| Majority | 1034 | 41.1% | +36.26% | ||
| Turnout | 2315 | 29.24% | -1.52% | ||
| Conservative hold | Swing | ||||
Dereham South
| Party | Candidate | Votes | % | ± | |
|---|---|---|---|---|---|
| Conservative | Phillip James Duigan | 1179 | 47% | +19% | |
| Labour | Harry Edwrd Jonathan Clarke | 853 | 34% | +12% | |
| UKIP | Catherine Anne Blaiklock | 277 | 11% | -25% | |
| Liberal Democrat | Paul James Speed | 207 | 8% | +1% | |
| Majority | 326 | 12.95% | +5.47% | ||
| Turnout | 2516 | 28.82% | +1.07% | ||
| Conservative gain from UKIP | Swing | ||||
Elmham & Mattishall
| Party | Candidate | Votes | % | ± | |
|---|---|---|---|---|---|
| Conservative | Bill Borrett | 2231 | 71% | +22% | |
| Labour | Linda Goreham | 585 | 19% | 0% | |
| Liberal Democrat | Richard James Scoggins | 326 | 10% | ||
| Majority | 1646 | 52.39% | +35.52% | ||
| Turnout | 3142 | 34.92% | +3.39% | ||
| Conservative hold | Swing | ||||
Guiltcross
| Party | Candidate | Votes | % | ± | |
|---|---|---|---|---|---|
| Conservative | Stephen Askew | 2067 | 69% | +25% | |
| Liberal Democrat | Stephen Joseph Gordon | 472 | 16% | -1% | |
| Labour | Christopher Harvey | 459 | 15% | +2% | |
| Majority | 1595 | 53.2% | +36.25% | ||
| Turnout | 2998 | 35.6% | +4.32% | ||
| Conservative hold | Swing | ||||
Necton & Launditch
| Party | Candidate | Votes | % | ± | |
|---|---|---|---|---|---|
| Conservative | Mark Alexander Kiddle-Morris | 2477 | 75% | +34% | |
| Labour | Joe Sisto | 838 | 25% | +6% | |
| Majority | 1639 | 49.44% | +36.14% | ||
| Turnout | 3315 | 37.88% | +1.37% | ||
| Conservative hold | Swing | ||||
Swaffham
| Party | Candidate | Votes | % | ± | |
|---|---|---|---|---|---|
| Conservative | Ed Colman | 1577 | 59% | +19% | |
| UKIP | Paul John Smyth | 473 | 18% | -26.5% | |
| Labour | Philip Wagstaff | 391 | 15% | 0% | |
| Liberal Democrat | Kate Sayer | 215 | 8% | ||
| Majority | 1104 | 41.57% | +37.1% | ||
| Turnout | 2656 | 33.05% | +2.92% | ||
| Conservative gain from UKIP | Swing | ||||
The Brecks
| Party | Candidate | Votes | % | ± | |
|---|---|---|---|---|---|
| Conservative | Fabian Eagle | 2131 | 72% | +29% | |
| Labour | Brenda Canham | 355 | 12% | +2% | |
| Green | Sandra Elizabeth Walmsley | 250 | 8% | +1% | |
| Liberal Democrat | James Minto | 225 | 8% | ||
| Majority | 1776 | 59.8% | +53.95% | ||
| Turnout | 2961 | 33.25% | -0.21% | ||
| Conservative hold | Swing | ||||
Thetford East
| Party | Candidate | Votes | % | ± | |
|---|---|---|---|---|---|
| Conservative | Roy Brame | 982 | 48% | +22% | |
| Labour | Mike Brindle | 725 | 36% | +17% | |
| UKIP | Denis Melvin Crawford | 334 | 16% | -31% | |
| Majority | 257 | 12.59% | -8.08% | ||
| Turnout | 2041 | 27.08% | +2.73% | ||
| Conservative gain from UKIP | Swing | ||||
Thetford West
| Party | Candidate | Votes | % | ± | |
|---|---|---|---|---|---|
| Labour | Terry Jermy | 1323 | 52% | +17% | |
| Conservative | Jane James | 853 | 33% | +18% | |
| UKIP | John Newton | 392 | 15% | -20% | |
| Majority | 470 | 18.3% | +18.26% | ||
| Turnout | 2568 | 26.77% | +3.02% | ||
| Labour gain from UKIP | Swing | ||||
Watton
| Party | Candidate | Votes | % | ± | |
|---|---|---|---|---|---|
| Conservative | Claire Rosemary Bowes | 1785 | 71% | +43% | |
| Labour | Danielle Clare Glavin | 356 | 14% | +3% | |
| Green | Timothy Edward Birt | 216 | 9% | +5% | |
| Liberal Democrat | Victor Keith Scrivens | 144 | 6% | ||
| Majority | 1429 | 57.14% | +51.08% | ||
| Turnout | 2501 | 28.49% | +0.51% | ||
| Conservative gain from UKIP | Swing | ||||
Yare & All Saints
| Party | Candidate | Votes | % | ± | |
|---|---|---|---|---|---|
| Conservative | Cliff Jordan | 1991 | 73% | +29% | |
| Liberal Democrat | Christine Violet McLean | 409 | 15% | ||
| Labour | Paul Richard Siegert | 337 | 12% | -5% | |
| Majority | 1582 | 57.8% | +52.38% | ||
| Turnout | 2737 | 35.68% | +3.52% | ||
| Conservative hold | Swing | ||||
Broadland
Acle
| Party | Candidate | Votes | % | ± | |
|---|---|---|---|---|---|
| Conservative | Brian John Maxwell Iles | 1343 | 52% | +12% | |
| Labour | Thomas William Rednall | 756 | 29% | +7% | |
| Liberal Democrat | Michael John Blake | 249 | 10% | +5% | |
| UKIP | David John Moreland | 219 | 9% | -24% | |
| Majority | 587 | 22.87% | +15.7% | ||
| Turnout | 2567 | 37.78% | +5.73% | ||
| Conservative hold | Swing | ||||
Aylsham
| Party | Candidate | Votes | % | ± | |
|---|---|---|---|---|---|
| Liberal Democrat | David George Harrison | 1358 | 44% | +3% | |
| Conservative | Hal Turkmen | 1221 | 39% | +13% | |
| Labour | Simon John Court | 389 | 13% | +1% | |
| UKIP | Trevor John Gardiner | 142 | 5% | -17% | |
| Majority | 137 | 4.41% | -10.49% | ||
| Turnout | 3110 | 39.7% | +1.4% | ||
| Liberal Democrat hold | Swing | ||||
Blofield & Brundall
| Party | Candidate | Votes | % | ± | |
|---|---|---|---|---|---|
| Conservative | Andrew James Proctor | 1818 | 63% | +17% | |
| Labour | Alan David Pawsey | 479 | 17% | -4% | |
| Liberal Democrat | Eleanor Rose Mason | 284 | 10% | +5% | |
| Green | Beth Davis | 167 | 6% | -3% | |
| UKIP | Armin Hess | 154 | 5% | -14% | |
| Majority | 1339 | 46.14% | +20.53% | ||
| Turnout | 2902 | 38.51% | +3.28% | ||
| Conservative hold | Swing | ||||
Drayton & Horsford
| Party | Candidate | Votes | % | ± | |
|---|---|---|---|---|---|
| Conservative | Tony Adams | 1452 | 63% | +23% | |
| Liberal Democrat | Peter James Sergeant | 486 | 21% | +11% | |
| Labour | Tony Hemmingway | 352 | 15% | -5% | |
| Majority | 966 | 43.49% | +34.33% | ||
| Turnout | 2290 | 28.13% | +1.22% | ||
| Conservative hold | Swing | ||||
Hellesdon
| Party | Candidate | Votes | % | ± | |
|---|---|---|---|---|---|
| Conservative | Shelagh Cassandra Gurney | 1683 | 61% | +21% | |
| Labour | Annie Gemmell Thompson | 681 | 25% | +7% | |
| Liberal Democrat | David John Britcher | 374 | 14% | +6% | |
| Majority | 1002 | 36.6% | +26.39% | ||
| Turnout | 2738 | 31.43% | -0.38% | ||
| Conservative hold | Swing | ||||
Hevingham & Spixworth
| Party | Candidate | Votes | % | ± | |
|---|---|---|---|---|---|
| Liberal Democrat | Daniel Roper | 1297 | 47% | +10% | |
| Conservative | Shaun Andrew Vincent | 1068 | 39% | +9% | |
| Labour | Philip Martyn Williams | 221 | 8% | -2% | |
| UKIP | Nancy May Gardiner | 164 | 6% | -18% | |
| Majority | 229 | 8.33% | +1.02% | ||
| Turnout | 2750 | 37.44% | +4.6% | ||
| Liberal Democrat hold | Swing | ||||
Old Catton
| Party | Candidate | Votes | % | ± | |
|---|---|---|---|---|---|
| Conservative | Karen Amanda Vincent | 1356 | 65% | +28% | |
| Labour | Nesar Ahmed | 418 | 20% | +2% | |
| Liberal Democrat | Jacky Howe | 310 | 15% | -2% | |
| Majority | 938 | 45% | +31.18% | ||
| Turnout | 2084 | 31.69% | -1.37% | ||
| Conservative hold | Swing | ||||
Reepham
| Party | Candidate | Votes | % | ± | |
|---|---|---|---|---|---|
| Conservative | Greg Peck | 1231 | 44% | +13% | |
| Liberal Democrat | Stuart Charles Beadle | 783 | 28% | -6% | |
| Labour | Ruth Elizabeth Goodall | 611 | 22% | +9% | |
| UKIP | Paul Brock | 158 | 6% | -16% | |
| Majority | 448 | 16.1% | +13.87% | ||
| Turnout | 2783 | 41.52% | +6.6% | ||
| Conservative gain from Liberal Democrat | Swing | ||||
Sprowston
| Party | Candidate | Votes | % | ± | |
|---|---|---|---|---|---|
| Conservative | John Martyn Ward | 1659 | 54% | +20% | |
| Labour | Bill Couzens | 920 | 30% | 0% | |
| Liberal Democrat | Martin Gower Callam | 258 | 8% | -1% | |
| UKIP | John Gilson | 234 | 8% | -19% | |
| Majority | 739 | 24.06% | +19.82% | ||
| Turnout | 3071 | 32.87% | -1.11% | ||
| Conservative hold | Swing | ||||
Taverham
| Party | Candidate | Votes | % | ± | |
|---|---|---|---|---|---|
| Conservative | Stuart Michael Clancy | 1751 | 67% | +11% | |
| Labour | Trevor Wolfgang Turk | 428 | 16% | +5% | |
| Liberal Democrat | Charles Ison | 285 | 11% | +2% | |
| UKIP | Ian Pilip Kelly | 158 | 6% | -18% | |
| Majority | 1324 | 50.5% | +19.31% | ||
| Turnout | 2622 | 34.33% | +1.81% | ||
| Conservative hold | Swing | ||||
Thorpe St Andrew
| Party | Candidate | Votes | % | ± | |
|---|---|---|---|---|---|
| Conservative | Ian James Mackie | 1799 | 63% | +16% | |
| Labour | Dariush Paul Fassihi | 649 | 23% | 0% | |
| Liberal Democrat | Phyllida Isobel Margaret Scrivens | 404 | 14% | +6% | |
| Majority | 1150 | 40.32% | +16.99% | ||
| Turnout | 2852 | 36.12% | +4.75% | ||
| Conservative hold | Swing | ||||
Woodside
| Party | Candidate | Votes | % | ± | |
|---|---|---|---|---|---|
| Conservative | John Frederick Fischer | 1494 | 55% | +16% | |
| Labour | Natasha June Harpley | 802 | 30% | -2% | |
| Liberal Democrat | Dave Thomas | 232 | 9% | +4% | |
| UKIP | Ean Newberry | 174 | 6% | -17% | |
| Majority | 692 | 25.61% | +19.12% | ||
| Turnout | 2702 | 39.1% | +2.86% | ||
| Conservative hold | Swing | ||||
Wroxham
| Party | Candidate | Votes | % | ± | |
|---|---|---|---|---|---|
| Conservative | Tom Garrod | 1744 | 59% | +27% | |
| Liberal Democrat | Stephen Paul Heard | 588 | 20% | +1% | |
| Labour | Christine Mary Hemmingway | 315 | 11% | 0% | |
| Green | Nick Ball | 162 | 5% | ||
| UKIP | Adrian Wymer | 148 | 5% | -14% | |
| Majority | 1156 | 39.09% | +26.52% | ||
| Turnout | 2957 | 36.67% | +0.95% | ||
| Conservative hold | Swing | ||||
Great Yarmouth
Breydon
| Party | Candidate | Votes | % | ± | |
|---|---|---|---|---|---|
| Conservative | Carl Smith | 1289 | 47.7 | +18.4 | |
| Labour | Trevor John Wainwright | 795 | 29.4 | -4.3 | |
| UKIP | Alan Christie Grey | 619 | 22.9 | -14.1 | |
| Majority | 494 | 18.2 | +14.9 | ||
| Turnout | 2703 | 31 | +1.7 | ||
| Conservative gain from UKIP | Swing | ||||
Caister-on-Sea
| Party | Candidate | Votes | % | ± | |
|---|---|---|---|---|---|
| Conservative | Penny Carpenter | 1,177 | 49.8 | +22.5 | |
| UKIP | Donna Hammond | 551 | 23.3 | -7.5 | |
| Labour | Christina Horne | 467 | 19.8 | -14.9 | |
| Green | Harry Webb | 168 | 7.1 | +2.5 | |
| Majority | 626 | 26.5 | +23.6 | ||
| Turnout | 2,363 | 31.6 | -3.5 | ||
| Conservative gain from Labour | Swing | ||||
East Flegg
| Party | Candidate | Votes | % | ± | |
|---|---|---|---|---|---|
| Conservative | Ron Hanton | 1529 | 54% | +16% | |
| UKIP | Jonathon Toby Childs | 714 | 25% | -17% | |
| Labour | John Simmons | 413 | 15% | -5% | |
| Green | Ken Petersen | 157 | 6% | ||
| Majority | 815 | 28.97% | +25.16% | ||
| Turnout | 2813 | 36.88% | +4.11% | ||
| Conservative gain from UKIP | Swing | ||||
Gorleston St Andrews
| Party | Candidate | Votes | % | ± | |
|---|---|---|---|---|---|
| Conservative | Graham Robert Plant | 1145 | 46% | +19% | |
| Labour | Tony Wright | 834 | 34% | -2% | |
| UKIP | Kay Elizabeth Grey | 401 | 16% | -21% | |
| Green | Tracey Ann Darnell | 105 | 4% | ||
| Majority | 311 | 12.52% | +11.68% | ||
| Turnout | 2485 | 32.4% | -0.79% | ||
| Conservative gain from UKIP | Swing | ||||
Lothingland
| Party | Candidate | Votes | % | ± | |
|---|---|---|---|---|---|
| Conservative | Andy Grant | 1331 | 47% | +12% | |
| UKIP | Carl Adrian Annison | 800 | 29% | -9% | |
| Labour | Cara Louise Walker | 673 | 24% | -4% | |
| Majority | 531 | 18.94% | +15.95% | ||
| Turnout | 2804 | 31.13% | +1.6% | ||
| Conservative gain from UKIP | Swing | ||||
Magdalen
| Party | Candidate | Votes | % | ± | |
|---|---|---|---|---|---|
| Labour | Colleen Monica Walker | 1,062 | 48.0 | 0.0 | |
| Conservative | Julia Ann Miller | 739 | 33.4 | +14.9 | |
| UKIP | John Ellerton | 413 | 18.7 | -14.8 | |
| Majority | 323 | 14.6 | +0.1 | ||
| Turnout | 2,214 | 27.2 | -1.7 | ||
| Labour hold | Swing | ||||
West Flegg
| Party | Candidate | Votes | % | ± | |
|---|---|---|---|---|---|
| Conservative | Haydn Andrew Thirtle | 1,380 | 62.5 | +21.8 | |
| Labour | Gary William Boyd | 384 | 17.4 | -10.1 | |
| UKIP | Michael James Toomey | 266 | 12.0 | -19.9 | |
| Liberal Democrat | Kim Mackenzie-Morris | 178 | 8.1 | N/A | |
| Majority | 996 | 45.1 | +36.3 | ||
| Turnout | 2208 | 35.27% | +1.2 | ||
| Conservative hold | Swing | ||||
Yarmouth Nelson & Southtown
| Party | Candidate | Votes | % | ± | |
|---|---|---|---|---|---|
| Labour | Mike Smith-Clare | 843 | 42.7 | +1.2 | |
| UKIP | Peter Fitzgerald | 562 | 28.5 | -13.6 | |
| Conservative | George Rogers | 492 | 24.9 | +11.1 | |
| Liberal Democrat | Lisa Alston | 78 | 3.9 | N/A | |
| Majority | 281 | 14.3 | +13.7 | ||
| Turnout | 1,975 | 21.5 | -0.3 | ||
| Labour gain from UKIP | Swing | ||||
Yarmouth North & Central
| Party | Candidate | Votes | % | ± | |
|---|---|---|---|---|---|
| Labour | Mick Castle | 871 | 34.3 | -4.2 | |
| Conservative | James William Bensly | 836 | 33.0 | +10.6 | |
| UKIP | Chris Walch | 700 | 27.6 | -7.6 | |
| Liberal Democrat | Tony Harris | 129 | 5.1 | +1.3 | |
| Majority | 35 | 1.4 | -1.9 | ||
| Turnout | 2,536 | 27.7 | -0.2 | ||
| Labour hold | Swing | ||||
King's Lynn and West Norfolk
Clenchwarton & King's Lynn South
| Party | Candidate | Votes | % | ± | |
|---|---|---|---|---|---|
| Independent | Alexandra Kemp† | 1,181 | 52.6 | +52.6 | |
| Conservative | Chris Crofts | 616 | 27.4 | +0.6 | |
| Labour | Deborah Viven Holman | 317 | 14.1 | -29.9 | |
| UKIP | Trevor Paul Roberts | 132 | 5.9 | -23.2 | |
| Majority | 565 | 25.16 | +10.22 | ||
| Turnout | 2246 | 28.76% | -0.3% | ||
| Independent gain from Labour | Swing | ||||
†Alexandra Kemp was elected as a Labour councillor for Clenchwarton & King's Lynn South in May 2013, but left the party on 27 February 2014 to sit as an independent councillor.
Dersingham
| Party | Candidate | Votes | % | ± | |
|---|---|---|---|---|---|
| Conservative | Stuart Graham Dark | 2445 | 73% | +26% | |
| Labour | Ed Robb | 530 | 16% | -5% | |
| Liberal Democrat | Harry Arthur Lane | 352 | 11% | +6% | |
| Majority | 1915 | 57.56% | +38.62% | ||
| Turnout | 3327 | 37.23% | +2.18% | ||
| Conservative hold | Swing | ||||
Docking
| Party | Candidate | Votes | % | ± | |
|---|---|---|---|---|---|
| Conservative | Michael John Baylis Chenery of Horsbrugh | 1856 | 69% | +26% | |
| Labour | Adrianne Lake | 498 | 18% | -2% | |
| Liberal Democrat | David Robert Mills | 351 | 13% | ||
| Majority | 1358 | 50.2% | +45.49% | ||
| Turnout | 2705 | 34.13% | +0.7% | ||
| Conservative hold | Swing | ||||
Downham Market
| Party | Candidate | Votes | % | ± | |
|---|---|---|---|---|---|
| Conservative | Tony White | 1677 | 61% | +25% | |
| Labour | Jackie Crookston | 405 | 15% | -7% | |
| Liberal Democrat | Josie Ratcliffe | 368 | 13% | ||
| UKIP | Dave Williams | 309 | 11% | -21% | |
| Majority | 1272 | 46.1% | +41.8% | ||
| Turnout | 2759 | 32.16% | +1.38% | ||
| Conservative hold | Swing | ||||
Feltwell
| Party | Candidate | Votes | % | ± | |
|---|---|---|---|---|---|
| Conservative | Martin Stuart Storey | 2009 | 68% | +23% | |
| Labour | Peter John Wortley | 659 | 22% | +5% | |
| Liberal Democrat | John Peter Crofts | 273 | 9% | ||
| Majority | 1350 | 45.9% | +39.66% | ||
| Turnout | 2941 | 30.38% | +0.19% | ||
| Conservative hold | Swing | ||||
Fincham
| Party | Candidate | Votes | % | ± | |
|---|---|---|---|---|---|
| Conservative | Brian Winston Charles Long | 1640 | 59% | +20% | |
| Labour | Sam Gipson | 470 | 17% | -5% | |
| UKIP | Ashley Richard Collins | 361 | 13% | -21% | |
| Liberal Democrat | Carol Anne Renard | 294 | 11% | +5% | |
| Majority | 1170 | 42.31% | +37.71% | ||
| Turnout | 2765 | 31.71% | +1.68% | ||
| Conservative hold | Swing | ||||
Freebridge Lynn
| Party | Candidate | Votes | % | ± | |
|---|---|---|---|---|---|
| Conservative | Simon Joseph Eyre | 1535 | 57% | +24% | |
| Green | Andrew Michael De Whalley | 483 | 18% | -10% | |
| Labour | Wilf Lambert | 353 | 13% | -8% | |
| Liberal Democrat | Simon John Wells | 182 | 7% | +4% | |
| UKIP | Christine Anne Perkins | 130 | 5% | -16% | |
| Majority | 1052 | 39.21% | +33.96% | ||
| Turnout | 2683 | 35.28% | -0.99% | ||
| Conservative hold | Swing | ||||
Gayton & Nar Valley
| Party | Candidate | Votes | % | ± | |
|---|---|---|---|---|---|
| Conservative | Graham Robin Middleton | 1577 | 62% | +42% | |
| Labour | Natasha Dawn Morgan | 460 | 18% | +11% | |
| Liberal Democrat | Andrew Nixon | 289 | 11% | -2% | |
| UKIP | John Barry Corden | 226 | 9% | -19% | |
| Majority | 1117 | 43.77% | +41.6% | ||
| Turnout | 2552 | 30.44% | -3.21% | ||
| Conservative gain from UKIP | Swing | ||||
Gaywood North & Central
| Party | Candidate | Votes | % | ± | |
|---|---|---|---|---|---|
| Conservative | Sheila Patricia Young | 871 | 46% | +22% | |
| Labour | John Leonard Collop | 621 | 33% | +1% | |
| UKIP | Jim Perkins | 226 | 12% | -24% | |
| Liberal Democrat | Ian Donald Swinton | 120 | 6% | -2% | |
| Independent | Patrick William Rochford | 71 | 4% | ||
| Majority | 250 | 13.1% | +9.42% | ||
| Turnout | 1909 | 25.41% | -0.97% | ||
| Conservative gain from UKIP | Swing | ||||
Gaywood South
| Party | Candidate | Votes | % | ± | |
|---|---|---|---|---|---|
| Conservative | Thomas Elliott John Smith | 857 | 39% | +18% | |
| Labour | Margaret Rose Wilkinson | 758 | 34% | -3% | |
| Liberal Democrat | Rob Colwell | 370 | 17% | +9% | |
| UKIP | Michael Stone | 230 | 10% | -24% | |
| Majority | 99 | 4.47% | +1.02% | ||
| Turnout | 2215 | 22.3% | -0.53% | ||
| Conservative gain from Labour | Swing | ||||
King's Lynn North & Central
| Party | Candidate | Votes | % | ± | |
|---|---|---|---|---|---|
| Labour | David John Collis | 716 | 47% | -26% | |
| Conservative | Toby Wing-Pentelow | 470 | 31% | +3% | |
| UKIP | Matty Hannay | 198 | 13% | ||
| Liberal Democrat | Richard James Coward | 153 | 10% | ||
| Majority | 246 | 16% | -29.22% | ||
| Turnout | 1537 | 19.38% | +1.29% | ||
| Labour hold | Swing | ||||
Marshland North
| Party | Candidate | Votes | % | ± | |
|---|---|---|---|---|---|
| Conservative | Sandra Jane Squire | 1344 | 71% | +40% | |
| Labour | Izik Kruh-Atar | 331 | 18% | +2% | |
| Liberal Democrat | Erika Ingrid Coward | 211 | 11% | ||
| Majority | 1013 | 53.71% | +47.28% | ||
| Turnout | 1886 | 23.87% | -2.61% | ||
| Conservative gain from UKIP | Swing | ||||
Marshland South
| Party | Candidate | Votes | % | ± | |
|---|---|---|---|---|---|
| Conservative | Harry Arthur Sidney Humphrey | 1567 | 60% | -6% | |
| UKIP | Colin Neil Trevor Rose | 541 | 21% | +21% | |
| Labour | Robin Nigel Lyon Mann | 344 | 13% | -21% | |
| Liberal Democrat | Steven Michael White | 158 | 6% | +6% | |
| Majority | 1026 | 39 | +8% | ||
| Turnout | 2610 | 25 | +4% | ||
| Conservative hold | Swing | ||||
North Coast
| Party | Candidate | Votes | % | ± | |
|---|---|---|---|---|---|
| Conservative | Andrew David Jamieson | 1891 | 69% | +35% | |
| Labour | Christine Mary Hudson | 395 | 14% | +4% | |
| Liberal Democrat | Simon Anthony Wilson | 255 | 9% | ||
| UKIP | Debbie Le May | 210 | 8% | -8% | |
| Majority | 1496 | 54.38% | +48.47% | ||
| Turnout | 2751 | 38.07% | +0.35% | ||
| Conservative gain from Independent | Swing | ||||
North Norfolk
Cromer
| Party | Candidate | Votes | % | ± | |
|---|---|---|---|---|---|
| Liberal Democrat | Tim Adams | 1481 | 45% | +27% | |
| Conservative | Hilary Cox | 1310 | 39% | +4% | |
| Labour | Jane Bowden Worsdale | 255 | 8% | -9% | |
| UKIP | John Frederick Digby | 153 | 5% | -20% | |
| Green | Mike Bossingham | 123 | 4% | 0% | |
| Majority | 171 | 5.15% | -4.85% | ||
| Turnout | 3322 | 40.86% | +1.36% | ||
| Liberal Democrat gain from Conservative | Swing | ||||
Fakenham
| Party | Candidate | Votes | % | ± | |
|---|---|---|---|---|---|
| Conservative | Tom FitzPatrick | 1321 | 53% | +21% | |
| Liberal Democrat | Hugh Christopher Lanham | 556 | 22% | +12% | |
| Labour | Imogen Mary Bruce | 352 | 14% | -13% | |
| UKIP | Jack Robert Smith | 202 | 8% | -19% | |
| Green | Jenny Outred | 80 | 3% | -1% | |
| Majority | 765 | 30.47% | +25.57% | ||
| Turnout | 2511 | 30.69% | +0.99% | ||
| Conservative hold | Swing | ||||
Holt
| Party | Candidate | Votes | % | ± | |
|---|---|---|---|---|---|
| Liberal Democrat | Sarah Elizabeth Jane Butikofer | 1666 | 46% | +23% | |
| Conservative | David Anthony Ward | 1455 | 40% | +14% | |
| Labour | Richard Alexander Kelham | 210 | 6% | -5% | |
| UKIP | Terry Comber | 202 | 6% | -29% | |
| Green | Paula Mary D'Attoma | 123 | 3% | -2% | |
| Majority | 211 | 5.77% | -3.43% | ||
| Turnout | 3656 | 50.46% | -0.34% | ||
| Liberal Democrat gain from UKIP | Swing | ||||
Hoveton & Stalham
| Party | Candidate | Votes | % | ± | |
|---|---|---|---|---|---|
| Conservative | Nigel David Dixon | 1540 | 60% | +28% | |
| Liberal Democrat | Philip Livesey | 616 | 24% | +4% | |
| Labour | Mandy McKenna | 301 | 12% | -9% | |
| Green | Michael Graham Macartney-Filgate | 119 | 5% | +2% | |
| Majority | 924 | 35.87% | +28.57% | ||
| Turnout | 2576 | 35.12% | -1.58% | ||
| Conservative hold | Swing | ||||
Melton Constable
| Party | Candidate | Votes | % | ± | |
|---|---|---|---|---|---|
| Liberal Democrat | Steffan Luke Aquarone | 1549 | 45% | +34% | |
| Conservative | Annie Claussen-Reynolds | 1129 | 33% | +3% | |
| UKIP | David James Ramsbotham | 409 | 12% | -24% | |
| Labour | Callum Edward Ringer | 283 | 8% | -10% | |
| Green | Alicia Jane Hull | 80 | 2% | -4% | |
| Majority | 420 | 12.17% | +5.97% | ||
| Turnout | 3450 | 46.14% | +3.44% | ||
| Liberal Democrat gain from UKIP | Swing | ||||
Mundesley
| Party | Candidate | Votes | % | ± | |
|---|---|---|---|---|---|
| Liberal Democrat | Edward Maxfield | 1309 | 43% | +22% | |
| Conservative | Fiona Elizabeth Turner | 1244 | 40% | +14% | |
| Labour | Ray Mooney | 240 | 8% | -1% | |
| UKIP | Alexander McGillivray Wood | 177 | 6% | -16% | |
| Independent | Graham Robert Jones | 109 | 4% | -6% | |
| Majority | 65 | 2.11% | -2.06% | ||
| Turnout | 3079 | 41.48% | +2.63% | ||
| Liberal Democrat gain from Conservative | Swing | ||||
North Walsham East
| Party | Candidate | Votes | % | ± | |
|---|---|---|---|---|---|
| Liberal Democrat | Eric George Seward | 1646 | 55% | +20% | |
| Conservative | Alex Oliver | 829 | 27% | +11% | |
| Labour | Jacqui Cross | 261 | 9% | -12% | |
| UKIP | Lynette Elizabeth Comber | 177 | 6% | -17% | |
| Green | Jo Todd | 107 | 4% | 0% | |
| Majority | 817 | 27.05% | +15.12% | ||
| Turnout | 3020 | 35.4% | +0.46% | ||
| Liberal Democrat hold | Swing | ||||
North Walsham West & Erpingham
| Party | Candidate | Votes | % | ± | |
|---|---|---|---|---|---|
| Liberal Democrat | John William Timewell | 1037 | 34% | +6% | |
| Conservative | Glyn Williams | 926 | 31% | +10% | |
| Labour Co-op | David Spencer | 789 | 26% | -1% | |
| UKIP | Irene Olive Ramsbotham | 141 | 5% | -14% | |
| Green | Stephen John Green | 113 | 4% | -1% | |
| Majority | 111 | 3.69% | +2.32% | ||
| Turnout | 3006 | 41.75% | +2.48% | ||
| Liberal Democrat hold | Swing | ||||
Sheringham
| Party | Candidate | Votes | % | ± | |
|---|---|---|---|---|---|
| Conservative | Judy Oliver | 1380 | 46% | +17% | |
| Liberal Democrat | Helen Carole Dalton-Hare | 1155 | 39% | +2% | |
| Labour | Sue Brisbane | 270 | 9% | -3% | |
| UKIP | Steven James De La Salle | 138 | 5% | -14% | |
| Green | Julian Arthur Drury | 56 | 2% | -1% | |
| Majority | 225 | 7.5% | -0.4% | ||
| Turnout | 2999 | 44.1% | +1.1% | ||
| Conservative gain from Liberal Democrat | Swing | ||||
South Smallburgh
| Party | Candidate | Votes | % | ± | |
|---|---|---|---|---|---|
| Conservative | Richard Carey Price | 1252 | 42% | +13% | |
| Liberal Democrat | Clive Stockton | 1196 | 40% | +9% | |
| UKIP | Michael John Morton Baker | 204 | 7% | -20% | |
| Labour | David Edwin Russell | 165 | 6% | -4% | |
| Green | Anne Patricia Filgate | 152 | 5% | +1% | |
| Majority | 56 | 1.89% | +0.69% | ||
| Turnout | 2969 | 41.57% | +1.47% | ||
| Conservative gain from Liberal Democrat | Swing | ||||
Wells
| Party | Candidate | Votes | % | ± | |
|---|---|---|---|---|---|
| Liberal Democrat | Marie Strong | 1775 | 61% | +12% | |
| Conservative | Becky Palmer | 782 | 27% | +7% | |
| Labour | Stephen Bernard Burke | 180 | 6% | -2% | |
| UKIP | John Dymond | 106 | 4% | -16% | |
| Green | Kara Betts | 74 | 3% | -1% | |
| Majority | 993 | 34.04% | +5.44% | ||
| Turnout | 2917 | 43.3% | +1.4% | ||
| Liberal Democrat hold | Swing | ||||
Norwich
Bowthorpe
| Party | Candidate | Votes | % | ± | |
|---|---|---|---|---|---|
| Labour | Mike Sands | 1,175 | 50.0 | -0.6 | |
| Conservative | Henry Charles Newton | 710 | 30.2 | +0.3 | |
| UKIP | Michelle Newton | 170 | 7.2 | N/A | |
| Green | Nannette Youssef | 170 | 7.2 | -7.9 | |
| Liberal Democrat | Silvia Schmidtova | 124 | 5.3 | +1.0 | |
| Majority | 465 | 19.8 | -0.92 | ||
| Turnout | 2349 | 28.95 | +1.83 | ||
| Labour hold | Swing | ||||
Catton Grove
| Party | Candidate | Votes | % | ± | |
|---|---|---|---|---|---|
| Labour | Steve Morphew | 1,194 | 47.7 | +3.8 | |
| Conservative | Daniel Edward Elmer | 955 | 38.2 | +18.8 | |
| Green | Tony Arthur Park | 169 | 6.8 | -2.9 | |
| Liberal Democrat | Leigh Tooke | 114 | 4.6 | ±0.0 | |
| Independent | Michelle Ho | 70 | 2.8 | N/A | |
| Majority | 239 | 9.55 | -11.87 | ||
| Turnout | 2502 | 31.17 | +4.1 | ||
| Labour hold | Swing | ||||
Crome
| Party | Candidate | Votes | % | ± | |
|---|---|---|---|---|---|
| Labour | George Nobbs | 1,151 | 49.9 | +0.7 | |
| Conservative | Jonathan James Emsell | 743 | 32.2 | +16.4 | |
| UKIP | Ann Williams | 171 | 7.4 | -16.1 | |
| Green | Judith Marianne Ford | 147 | 6.4 | -1.7 | |
| Liberal Democrat | Ian Richard Leach | 93 | 4.0 | +0.7 | |
| Majority | 408 | 17.7 | -8.1 | ||
| Turnout | 2,305 | 31.8 | +2.3 | ||
| Labour hold | Swing | ||||
Eaton
| Party | Candidate | Votes | % | ± | |
|---|---|---|---|---|---|
| Liberal Democrat | Brian Watkins | 1,833 | 46.5 | +5.2 | |
| Conservative | William Alistair Robb | 1,107 | 28.1 | -1.1 | |
| Labour | Ian Clifford Stutely | 683 | 17.3 | -1.0 | |
| Green | Jane Isobel Saunders | 244 | 6.2 | -5.0 | |
| UKIP | Gordon Cullingworth | 73 | 1.9 | N/A | |
| Majority | 726 | 18.4 | +6.4 | ||
| Turnout | 3,940 | 53.8 | +5.1 | ||
| Liberal Democrat hold | Swing | ||||
Lakenham
| Party | Candidate | Votes | % | ± | |
|---|---|---|---|---|---|
| Labour Co-op | Brenda Lesley Jones | 1,249 | 50.3 | -0.3 | |
| Conservative | Tom Langendijk Sherman | 467 | 18.8 | +7.4 | |
| Liberal Democrat | Emily Rachel Cutler | 277 | 11.2 | -12.6 | |
| Green | Paul Vincent Neale | 250 | 10.1 | -4.2 | |
| UKIP | Eric Philip Ashwell Masters | 240 | 9.7 | N/A | |
| Majority | 782 | 31.5 | +4.6 | ||
| Turnout | 2483 | 34.8 | +3.7 | ||
| Labour hold | Swing | ||||
Mancroft
| Party | Candidate | Votes | % | ± | |
|---|---|---|---|---|---|
| Labour | Danny Douglas | 1,355 | 46.5 | +11.0 | |
| Green | Martin Kenneth Albert Schmierer | 704 | 24.2 | -20.5 | |
| Conservative | Samantha Louise England | 522 | 17.9 | +5.1 | |
| Liberal Democrat | Gordon Richard Dean | 201 | 6.9 | ±0.0 | |
| UKIP | Paddy Ball | 130 | 4.5 | N/A | |
| Majority | 651 | 22.4 | +13.2 | ||
| Turnout | 2912 | 35.9 | +4.2 | ||
| Labour gain from Green | Swing | ||||
Mile Cross
| Party | Candidate | Votes | % | ± | |
|---|---|---|---|---|---|
| Labour Co-op | Chrissie Rumsby | 998 | 48.8 | +4.2 | |
| Conservative | Alex James Jackson-Dennis | 454 | 22.2 | +11.6 | |
| Green | Lisa Jayne Shaw | 206 | 10.1 | -11.2 | |
| UKIP | David Rowell | 162 | 7.9 | -11.5 | |
| Liberal Democrat | Magda Siwiec | 131 | 6.4 | +2.2 | |
| Independent | Deborah Gihawi | 95 | 4.6 | N/A | |
| Majority | 544 | 26.6 | +3.3 | ||
| Turnout | 2046 | 26.6 | +0.5 | ||
| Labour hold | Swing | ||||
Nelson
| Party | Candidate | Votes | % | ± | |
|---|---|---|---|---|---|
| Labour | Jess Barnard | 1,735 | 47.3 | +16.1 | |
| Green | Tim Michael Jones | 1,372 | 37.4 | -16.6 | |
| Liberal Democrat | David Angus Fairbairn | 279 | 7.6 | +1.7 | |
| Conservative | William Peter Richardson | 258 | 7.0 | -1.9 | |
| UKIP | John Youles | 27 | 0.7 | N/A | |
| Majority | 363 | 9.9 | -12.9 | ||
| Turnout | 3671 | 54.2 | +20.0 | ||
| Labour gain from Green | Swing | ||||
Sewell
| Party | Candidate | Votes | % | ± | |
|---|---|---|---|---|---|
| Labour | Julie Dawn Brociek-Couton | 1,591 | 59.5 | +22.8 | |
| Conservative | Robin Paul Sear | 466 | 17.4 | +2.7 | |
| Green | Ian Peter Chapman | 300 | 11.2 | -17.6 | |
| Liberal Democrat | Alice Sarah Paton Thomson | 197 | 7.4 | +4.5 | |
| UKIP | Glenn Stuart Tingle | 118 | 4.4 | -12.4 | |
| Majority | 1,125 | 42.1 | +34.2 | ||
| Turnout | 2,672 | 34.5 | +6.5 | ||
| Labour hold | Swing | ||||
Thorpe Hamlet
| Party | Candidate | Votes | % | ± | |
|---|---|---|---|---|---|
| Labour | Chris Jones | 1,175 | 35.0 | +4.3 | |
| Green | Lesley Juliet Grahame | 1,100 | 32.8 | -5.4 | |
| Conservative | Stephen Mark Barber | 763 | 22.7 | +0.2 | |
| Liberal Democrat | Sarah Tustin | 224 | 6.7 | -2.0 | |
| UKIP | Nick Lansdell | 95 | 2.8 | N/A | |
| Majority | 75 | 2.2 | -5.2 | ||
| Turnout | 3,357 | 37.6 | +9.2 | ||
| Labour gain from Green | Swing | ||||
Town Close
| Party | Candidate | Votes | % | ± | |
|---|---|---|---|---|---|
| Labour | Emma Clare Corlett | 2,026 | 51.9 | +12.8 | |
| Conservative | Mary Josephine Chacksfield | 908 | 23.3 | +4.1 | |
| Green | Phil Di Palma | 542 | 13.9 | -21.5 | |
| Liberal Democrat | James Alexander Campbell Anthony | 347 | 8.9 | +2.5 | |
| UKIP | Anthea Rule | 82 | 2.1 | N/A | |
| Majority | 1,118 | 28.6 | +24.9 | ||
| Turnout | 3,905 | 46.9 | +9.5 | ||
| Labour hold | Swing | ||||
University
| Party | Candidate | Votes | % | ± | |
|---|---|---|---|---|---|
| Labour | David Rowntree | 1,173 | 58.8 | -3.8 | |
| Conservative | Gary William Walsh | 330 | 16.5 | +6.0 | |
| Green | Lewis Martin | 257 | 12.9 | -7.5 | |
| Liberal Democrat | Toby Bennett | 126 | 6.3 | -0.1 | |
| UKIP | Rob Lowe | 109 | 5.5 | N/A | |
| Majority | 843 | 42.3 | +0.1 | ||
| Turnout | 1,995 | 36.8 | +12.7 | ||
| Labour hold | Swing | ||||
Wensum
| Party | Candidate | Votes | % | ± | |
|---|---|---|---|---|---|
| Labour | Kim Elizabeth Clipsham | 1,324 | 49.4 | +10.4 | |
| Green | Richard Alan Edwards | 612 | 22.8 | -23.1 | |
| Conservative | David King | 455 | 17.0 | +6.0 | |
| UKIP | Steven Bradley | 176 | 6.6 | N/A | |
| Liberal Democrat | Jack Spoor | 115 | 4.3 | +0.1 | |
| Majority | 712 | 26.6 | +19.5 | ||
| Turnout | 2,682 | 33.4 | +6.1 | ||
| Labour gain from Green | Swing | ||||
South Norfolk
Clavering
| Party | Candidate | Votes | % | ± | |
|---|---|---|---|---|---|
| Conservative | Margaret Florence Stone | 1756 | 52% | +21% | |
| Liberal Democrat | Christopher John Brown | 1131 | 34% | +12% | |
| Labour | Nicola Jeannette Fowler | 475 | 14% | +2% | |
| Majority | 625 | 18.59% | +11.87 | ||
| Turnout | 3362 | 38.57% | |||
| Conservative hold | Swing | ||||
Costessey
| Party | Candidate | Votes | % | ± | |
|---|---|---|---|---|---|
| Liberal Democrat | Tim East | 1603 | 45% | +7% | |
| Conservative | Andrew Roy Wiltshire | 1216 | 34% | +14% | |
| Labour | Jonathan Peter Garrard | 553 | 15% | +1% | |
| Green | Catherine Joanna Rowett | 200 | 6% | -1% | |
| Majority | 387 | 10.83% | -16.43% | ||
| Turnout | 3572 | 31.88% | |||
| Liberal Democrat hold | Swing | ||||
Diss & Roydon
| Party | Candidate | Votes | % | ± | |
|---|---|---|---|---|---|
| Conservative | Keith Walter Kiddie | 1484 | 54% | +10% | |
| Liberal Democrat | Tracey Barbara Scoggins | 792 | 29% | +19% | |
| Labour | Chris Davison | 375 | 14% | -1% | |
| Green | David Milton | 103 | 4% | -5% | |
| Majority | 692 | 25.13% | +2.82% | ||
| Turnout | 2754 | 33.59% | |||
| Conservative hold | Swing | ||||
East Depwade
| Party | Candidate | Votes | % | ± | |
|---|---|---|---|---|---|
| Conservative | Martin James Wilby | 1858 | 67% | +4% | |
| Labour | James William Eddy | 461 | 17% | 0% | |
| Liberal Democrat | Susan Evelyn Kuzmic | 451 | 16% | -4% | |
| Majority | 1397 | 50.43% | +6.91% | ||
| Turnout | 2770 | 35.78% | |||
| Conservative hold | Swing | ||||
Forehoe
| Party | Candidate | Votes | % | ± | |
|---|---|---|---|---|---|
| Conservative | Colin Wayne Foulger | 1785 | 58% | +29% | |
| Liberal Democrat | Robert Arthur McClenning | 709 | 23% | +7% | |
| Labour | Steven Leigh Sewell | 575 | 19% | +8% | |
| Majority | 1076 | 35.06% | +24.6% | ||
| Turnout | 3069 | 36.45% | |||
| Conservative hold | Swing | ||||
Henstead
| Party | Candidate | Votes | % | ± | |
|---|---|---|---|---|---|
| Conservative | Vic Thomson | 1790 | 57% | +15% | |
| Liberal Democrat | Matthew Hammond | 734 | 23% | +12% | |
| Labour | Tom Fowler | 611 | 19% | +2% | |
| Majority | 1056 | 33.68% | +13.45% | ||
| Turnout | 3135 | 40.67% | |||
| Conservative hold | Swing | ||||
Hingham
| Party | Candidate | Votes | % | ± | |
|---|---|---|---|---|---|
| Conservative | Margaret Dewsbury | 1708 | 67% | +7% | |
| Labour | James Edward George Leman | 416 | 16% | +2% | |
| Liberal Democrat | Paul Wynter Blathwayt | 411 | 16% | +8% | |
| Majority | 1292 | 50.97% | +10.06% | ||
| Turnout | 2535 | 38.6% | |||
| Conservative hold | Swing | ||||
Humbleyard
| Party | Candidate | Votes | % | ± | |
|---|---|---|---|---|---|
| Conservative | David Bills | 2215 | 60% | +15% | |
| Liberal Democrat | Jacky Sutton | 883 | 24% | +15% | |
| Labour | Bethan Siân Gulliver | 610 | 16% | +2% | |
| Majority | 1332 | 35.92% | +10.55% | ||
| Turnout | 3708 | 38.99% | |||
| Conservative hold | Swing | ||||
Loddon
| Party | Candidate | Votes | % | ± | |
|---|---|---|---|---|---|
| Conservative | Barry Michael Stone | 2091 | 63% | +18% | |
| Liberal Democrat | David Kenneth Bingham | 613 | 19% | +14% | |
| Labour | David George Bissonnet | 605 | 18% | +6% | |
| Majority | 1478 | 44.67% | -0.12% | ||
| Turnout | 3309 | 39.54% | |||
| Conservative hold | Swing | ||||
Long Stratton
| Party | Candidate | Votes | % | ± | |
|---|---|---|---|---|---|
| Conservative | Alison Mary Thomas | 1832 | 64% | +21% | |
| Liberal Democrat | Roger Neil Percival | 555 | 20% | +10% | |
| Labour | Elana Katz | 456 | 16% | +2% | |
| Majority | 1277 | 44.91% | +27.37% | ||
| Turnout | 2843 | 36.95% | |||
| Conservative hold | Swing | ||||
West Depwade
| Party | Candidate | Votes | % | ± | |
|---|---|---|---|---|---|
| Conservative | Beverley Herbert Allison Spratt | 2413 | 65% | +19% | |
| Liberal Democrat | Ian Victor Spratt | 705 | 19% | +4% | |
| Labour | Pam Reekie | 575 | 16% | +3% | |
| Majority | 1708 | 46.25% | +25.07% | ||
| Turnout | 3693 | 41.45% | |||
| Conservative hold | Swing | ||||
Wymondham
| Party | Candidate | Votes | % | ± | |
|---|---|---|---|---|---|
| Conservative | Joe Mooney | 2222 | 56% | +18% | |
| Liberal Democrat | Julian Lawrence Halls | 921 | 23% | +21% | |
| Labour | Doug Underwood | 832 | 21% | +12% | |
| Majority | 1301 | 32.73% | +27.55% | ||
| Turnout | 3975 | 40.03% | |||
| Conservative hold | Swing | ||||
References
- ↑ "Upcoming elections & referendums". Electoral Commission. Retrieved 15 September 2016.
- ↑ One of the independent councillors sits with UKIP in a 'UKIP and Independent Group' but has not formally joined the party
- ↑ Dan Grimmer (9 December 2016). "Green county councillor defects to Conservatives, saying his former party had become too "left wing" and was not respecting country's will over Brexit". Eastern Daily Press. Retrieved 1 February 2017.
- ↑ https://www.breckland.gov.uk/article/2128/Norfolk-County-Council-By-Election-Watton-Division. Missing or empty
|title=(help) - ↑ http://norfolkcc.cmis.uk.com/norfolkcc/Councillors/tabid/63/ctl/ViewCMIS_Person/mid/383/id/35/ScreenMode/Party/Default.aspx. Missing or empty
|title=(help) - ↑ http://www.greatyarmouthmercury.co.uk/news/conservatives_win_back_gorleston_seat_in_norfolk_county_council_by_election_1_4156706. Missing or empty
|title=(help) - ↑ Alexandra Kemp (27 February 2014). "King's Lynn councillor quits and accuses county leaders of bullying". GeekWire. Retrieved 1 February 2017.
- ↑ http://www.edp24.co.uk/news/politics/labour_fight_off_ukip_to_take_thetford_west_by_election_1_2312789. Missing or empty
|title=(help) - ↑ Scott, Geraldine (7 May 2017). "Norfolk's Liberal Democrats appoint new leadership team following local elections". Thetford and Brandon Times. Retrieved 24 September 2017.
| Norfolk County Council | |
|---|---|
| Breckland District Council | |
| Broadland District Council |
|
| Great Yarmouth Borough Council | |
| King's Lynn and West Norfolk Borough Council |
|
| North Norfolk District Council | |
| Norwich City Council | |
| South Norfolk District Council | |
| |