Norwich City Council election, 2010
| |||||||||||||||||||||||||||||||||||||||||||||||||||||||||||
13 of 39 seats (One Third) to Norwich City Council 20 seats needed for a majority | |||||||||||||||||||||||||||||||||||||||||||||||||||||||||||
|---|---|---|---|---|---|---|---|---|---|---|---|---|---|---|---|---|---|---|---|---|---|---|---|---|---|---|---|---|---|---|---|---|---|---|---|---|---|---|---|---|---|---|---|---|---|---|---|---|---|---|---|---|---|---|---|---|---|---|---|
| |||||||||||||||||||||||||||||||||||||||||||||||||||||||||||
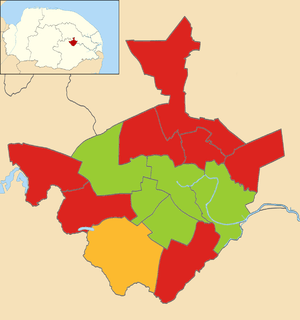 Map showing the 2010 local election results in Norwich. | |||||||||||||||||||||||||||||||||||||||||||||||||||||||||||
| |||||||||||||||||||||||||||||||||||||||||||||||||||||||||||
The 2010 Norwich City Council election took place on 9 September 2010 to elect members of Norwich City Council in England. One third of seats were up for election.[1] The elections took place later in the year than other local elections. Norwich had previously been granted permission to become a unitary authority, with local elections postponed until 2011.[2] When the Coalition Government won the general election earlier that year, Nowich's permission to form a unitary authority was overturned. Because of this, the High Court ruled that those councillors who had stayed on beyond their four-year term were no longer constitutionally elected, and would need to seek re-election. This resulted in there being an election in every ward in September to renew the mandate for the wards.[3]
All changes in vote share are calculated with reference to the 2006 election, the last time these seats were contested.
Election result
| Party | Seats | Gains | Losses | Net gain/loss | Seats % | Votes % | Votes | +/− | |
|---|---|---|---|---|---|---|---|---|---|
| Labour | 7 | 1 | 0 | +1 | 53.8 | 34.6 | 9,906 | +6.8 | |
| Green | 5 | 1 | 0 | +1 | 38.5 | 27.1 | 7,761 | +2.6 | |
| Conservative | 0 | 0 | 1 | -1 | − | 19.3 | 5,532 | +0.2 | |
| Liberal Democrat | 1 | 0 | 1 | -1 | 7.7 | 17.1 | 4,910 | -9.8 | |
| UKIP | 0 | − | − | − | − | 1.8 | 529 | +1.5 | |
| Total | 13 | Turnout | 28.1 | 28,638 | |||||
Changes in vote share are relative to the last time these seats were contested in 2006.
Council Composition
Prior to the election the composition of the council was:
| 15 | 13 | 6 | 5 |
| Labour | Green | Lib Dem | Con |
After the election, the composition of the council was:
| 16 | 14 | 5 | 4 |
| Labour | Green | Lib Dem | Con |
Ward results
Bowthorpe
| Party | Candidate | Votes | % | ± | |
|---|---|---|---|---|---|
| Labour | Jo Storie | 862 | 41.3 | ||
| Conservative | Anthony Little | 816 | 39.1 | ||
| Green | Jean Bishop | 225 | 10.8 | ||
| Liberal Democrat | Peter Perrett | 184 | 8.8 | ||
| Majority | 46 | 2.2 | |||
| Labour gain from Conservative | Swing | ||||
Catton Grove
| Party | Candidate | Votes | % | ± | |
|---|---|---|---|---|---|
| Labour | Julie Westmacott | 835 | 42.8 | ||
| Conservative | Charlotte Casimir | 650 | 33.3 | ||
| Green | Rebecca Smith | 208 | 10.7 | ||
| Liberal Democrat | Christopher Thomas | 135 | 6.9 | ||
| UKIP | Paul Williams | 123 | 6.3 | ||
| Majority | 185 | 9.5 | |||
| Labour hold | Swing | ||||
Crome
| Party | Candidate | Votes | % | ± | |
|---|---|---|---|---|---|
| Labour | Jenny Lay | 1,085 | 52.6 | ||
| Conservative | Christopher Baxter | 543 | 26.3 | ||
| Green | Paul McAlenan | 199 | 9.6 | ||
| Liberal Democrat | Alexander Findlow | 137 | 6.6 | ||
| Majority | 542 | 26.3 | |||
| Labour hold | Swing | ||||
Easton
| Party | Candidate | Votes | % | ± | |
|---|---|---|---|---|---|
| Liberal Democrat | James Wright | 1,356 | 41.4 | ||
| Conservative | Tak-Man Li | 937 | 28.6 | ||
| Labour | Benjamin Dilks | 549 | 16.8 | ||
| Green | Nicholas Clinch | 431 | 13.2 | ||
| Majority | 419 | 12.8 | |||
| Liberal Democrat hold | Swing | ||||
Lakenham
| Party | Candidate | Votes | % | ± | |
|---|---|---|---|---|---|
| Labour | Victoria MacDonald | 899 | 35.7 | ||
| Liberal Democrat | Howard Lee | 652 | 25.9 | ||
| Green | Kit Jones | 608 | 24.2 | ||
| Conservative | Christopher Benjamin | 243 | 9.7 | ||
| UKIP | Steve Emmens | 113 | 4.5 | ||
| Majority | 247 | 9.8 | |||
| Labour hold | Swing | ||||
Mancroft
| Party | Candidate | Votes | % | ± | |
|---|---|---|---|---|---|
| Green | Graeme Gee | 813 | 37.6 | ||
| Labour | Marion Maxwell | 673 | 31.1 | ||
| Liberal Democrat | Simon Nobbs | 371 | 17.2 | ||
| Conservative | Suzie Pulford | 305 | 14.1 | ||
| Majority | 140 | 6.5 | |||
| Green hold | Swing | ||||
Mile Cross
| Party | Candidate | Votes | % | ± | |
|---|---|---|---|---|---|
| Labour | Viv Thomas | 797 | 43.2 | ||
| Liberal Democrat | Carl Mayhew | 455 | 24.6 | ||
| Conservative | Oscar Pinnington | 266 | 14.4 | ||
| Green | Jo Henderson | 238 | 12.9 | ||
| UKIP | Richard Crooks | 90 | 4.9 | ||
| Majority | 342 | 18.6 | |||
| Labour hold | Swing | ||||
Nelson
| Party | Candidate | Votes | % | ± | |
|---|---|---|---|---|---|
| Green | Claire Stephenson | 1,297 | 58.5 | ||
| Labour | Marian Chapman | 535 | 24.1 | ||
| Liberal Democrat | Mark Johnston | 198 | 8.9 | ||
| Conservative | Stefan Rose | 186 | 8.4 | ||
| Majority | 762 | 34.4 | |||
| Green hold | Swing | ||||
Sewell
| Party | Candidate | Votes | % | ± | |
|---|---|---|---|---|---|
| Labour | Sue Sands | 792 | 39.6 | ||
| Green | Jessica Goldfinch | 604 | 30.2 | ||
| Conservative | David Mackie | 333 | 16.7 | ||
| Liberal Democrat | Selwyn Taylor | 168 | 8.4 | ||
| UKIP | Glenn Tingle | 103 | 5.2 | ||
| Majority | 188 | 9.4 | |||
| Labour hold | Swing | ||||
Thorpe Hamlet
| Party | Candidate | Votes | % | ± | |
|---|---|---|---|---|---|
| Green | Lesley Grahame | 859 | 41.3 | ||
| Labour | Shane Mann | 412 | 19.8 | ||
| Liberal Democrat | Dave Thomas | 409 | 19.7 | ||
| Conservative | Hannah Feiner | 401 | 19.3 | ||
| Majority | 447 | 21.5 | |||
| Green gain from Liberal Democrat | Swing | ||||
Town Close
| Party | Candidate | Votes | % | ± | |
|---|---|---|---|---|---|
| Green | Ash Haynes | 983 | 38.2 | ||
| Labour | Gareth Hardy | 560 | 21.8 | ||
| Liberal Democrat | Sam Bailey | 550 | 21.4 | ||
| Conservative | Eileen Wyatt | 479 | 18.6 | ||
| Majority | 423 | 16.4 | |||
| Green hold | Swing | ||||
University
| Party | Candidate | Votes | % | ± | |
|---|---|---|---|---|---|
| Labour | Bert Bremner | 1,164 | 63.4 | ||
| Green | Sue Carpenter | 409 | 22.3 | ||
| Conservative | Nicholas Hindley | 140 | 7.6 | ||
| Liberal Democrat | James Ebelewicz | 123 | 6.7 | ||
| Majority | 755 | 41.1 | |||
| Labour hold | Swing | ||||
Wensum
| Party | Candidate | Votes | % | ± | |
|---|---|---|---|---|---|
| Green | Steven Altman | 887 | 43.6 | ||
| Labour | Thomas Vaughan | 743 | 36.5 | ||
| Conservative | Stephen Karanicholas | 233 | 11.4 | ||
| Liberal Democrat | Clare Dennis | 172 | 8.5 | ||
| Majority | 144 | 7.1 | |||
| Green hold | Swing | ||||
References
- ↑ "Local Election Results 2010". Local Elections Archive Project. Retrieved 4 May 2016.
- ↑ "'Super councils' in Exeter and Norwich get go ahead". BBC. Retrieved 3 May 2016.
- ↑ "Pickles stops unitary councils in Exeter, Norwich and Suffolk". Department for Communities and Local Government. Retrieved 4 May 2016.
- ↑ http://www.andrewteale.me.uk/leap/results/2010/279/
| Norfolk County Council | |
|---|---|
| Breckland District Council | |
| Broadland District Council |
|
| Great Yarmouth Borough Council | |
| King's Lynn and West Norfolk Borough Council |
|
| North Norfolk District Council | |
| Norwich City Council | |
| South Norfolk District Council | |
| |