Gloucestershire County Council election, 2017
|
| |||||||||||||||||||||||||||||||||||||||||||||||
| |||||||||||||||||||||||||||||||||||||||||||||||
All 53 seats to Gloucestershire County Council 27 seats needed for a majority | |||||||||||||||||||||||||||||||||||||||||||||||
|---|---|---|---|---|---|---|---|---|---|---|---|---|---|---|---|---|---|---|---|---|---|---|---|---|---|---|---|---|---|---|---|---|---|---|---|---|---|---|---|---|---|---|---|---|---|---|---|
| |||||||||||||||||||||||||||||||||||||||||||||||
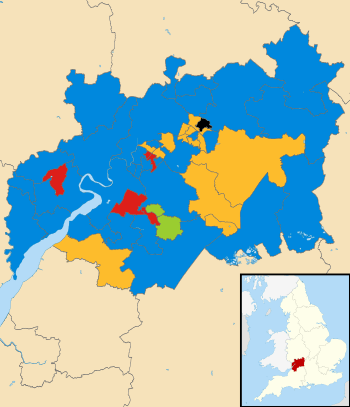 Map showing the results of the 2017 Gloucestershire County Council elections. | |||||||||||||||||||||||||||||||||||||||||||||||
| |||||||||||||||||||||||||||||||||||||||||||||||
The 2017 Gloucestershire County Council election took place on 4 May 2017 as part of the 2017 local elections in the United Kingdom.[1] All 53 councillors were elected from electoral divisions which returned one county councillor each by first-past-the-post voting for a four-year term of office. Control of the council went from a Conservative Party minority to a majority administration.
All locally registered electors (British, Irish, Commonwealth and European Union citizens) who were aged 18 or over on Thursday 4 May 2017 were entitled to vote in the local elections. Those who were temporarily away from their ordinary address (for example, away working, on holiday, in student accommodation or in hospital) were also entitled to vote in the local elections,[2] although those who had moved abroad and registered as overseas electors cannot vote in the local elections. It is possible to register to vote at more than one address (such as a university student who had a term-time address and lives at home during holidays) at the discretion of the local Electoral Register Office, but it remains an offence to vote more than once in the same local government election.[3]
Summary
The Conservative Party gained nine seats and lost one, leading to a net gain of eight seats. The Liberal Democrats held all their existing seats, remaining the second largest party by total seats and percentage vote, whilst the Labour Party lost four seats. UKIP lost all its seats on the council, whilst the Greens gained a second councillor.
The sole remaining independent lost re-election, although the People Against Bureaucracy Group held on to their seat.
Results
| Party | Seats | Gains | Losses | Net gain/loss | Seats % | Votes % | Votes | +/− | |
|---|---|---|---|---|---|---|---|---|---|
| Conservative | 31 | 10 | 2 | +8 | 58.5 | 45.1 | 79,759 | ||
| Liberal Democrat | 14 | 0 | 0 | 0 | 26.4 | 27.4 | 48,462 | ||
| Labour | 5 | 1 | 5 | -4 | 9.4 | 14.4 | 25,541 | ||
| Green | 2 | 1 | 0 | +1 | 3.8 | 7.7 | 13,556 | ||
| PAB | 1 | 0 | 0 | 0 | 1.9 | 1525 | |||
| UKIP | 0 | 0 | 3 | -3 | 0 | 3.2 | 5,631 | ||
| Other parties | 0 | 0 | 2 | -2 | 0 | 2.2 | 3,907 | ||
Results by Division
Cheltenham
| Party | Candidate | Votes | % | ± | |
|---|---|---|---|---|---|
| Liberal Democrat | Colin Hay | 1,440 | 53 | 3 | |
| Conservative | Martin Andrew Tracey | 844 | 31 | 7 | |
| Labour | Alec Gamble | 271 | 10 | -4 | |
| Green | Sarah Jane Field | 186 | 7 | -5 | |
| Majority | 596 | 22 | -4 | ||
| Liberal Democrat hold | Swing | ||||
| Party | Candidate | Votes | % | ± | |
|---|---|---|---|---|---|
| Conservative | Matt Babbage | 1,845 | 46 | 10 | |
| Liberal Democrat | Paul Gerard McCloskey | 1,794 | 45 | 10 | |
| Green | Lorraine Elizabeth Mason | 180 | 5 | 0 | |
| Labour | Caroline Adele Gavin | 170 | 5 | -1 | |
| Majority | 51 | 1 | 0 | ||
| Conservative hold | Swing | ||||
| Party | Candidate | Votes | % | ± | |
|---|---|---|---|---|---|
| Liberal Democrat | Simon Wheeler | 1972 | 52 | 11 | |
| Conservative | Mike Saunders | 1506 | 40 | 13 | |
| Labour | Kenneth Syme | 159 | 4 | 0 | |
| Green | Adam Paul Van Coevorden | 147 | 4 | 0 | |
| Majority | 466 | 12 | -2 | ||
| Liberal Democrat hold | Swing | ||||
| Party | Candidate | Votes | % | ± | |
|---|---|---|---|---|---|
| Liberal Democrat | Klara Sudbury | 2,392 | 61 | 14 | |
| Conservative | Peter Frantz Vagn Christensen | 1,263 | 32 | -4 | |
| Green | Elizabeth Johnson | 143 | 4 | 4 | |
| Labour | Malcolm Bride | 136 | 3 | -3 | |
| Majority | 1129 | 29 | 18 | ||
| Liberal Democrat hold | Swing | ||||
| Party | Candidate | Votes | % | ± | |
|---|---|---|---|---|---|
| Liberal Democrat | Suzanne Theresa Williams | 1,421 | 54 | -1 | |
| Conservative | Shaun Stephen Bailey | 781 | 30 | 7 | |
| Labour | Clive Robert Harriss | 203 | 8 | -8 | |
| UKIP | Barry George Lodge | 125 | 5 | 5 | |
| Green | Dale Karl Campbell | 86 | 3 | 3 | |
| Majority | 640 | 24 | -6 | ||
| Liberal Democrat hold | Swing | ||||
| Party | Candidate | Votes | % | ± | |
|---|---|---|---|---|---|
| Conservative | Tim Harman | 1,921 | 50 | 4 | |
| Liberal Democrat | Dilys Mary Juliet Barrell | 1,620 | 42 | 14 | |
| Labour | Kevin Michael Boyle | 160 | 4 | -2 | |
| Green | Anne Knight-Elliott | 143 | 4 | -3 | |
| Majority | 301 | 8 | -10 | ||
| Conservative hold | Swing | ||||
| Party | Candidate | Votes | % | ± | |
|---|---|---|---|---|---|
| Liberal Democrat | Iain Andrew Paterson Dobie | 2,128 | 49 | 15 | |
| Conservative | Chris Nelson | 1,902 | 43 | 10 | |
| Green | Timothy Cosmo Bonsor | 188 | 4 | -7 | |
| Labour | Joe Sucksmith | 165 | 4 | 4 | |
| Majority | 226 | 6 | 5 | ||
| Liberal Democrat hold | Swing | ||||
| Party | Candidate | Votes | % | ± | |
|---|---|---|---|---|---|
| PAB | John Payne | 1,525 | 38 | -21 | |
| Liberal Democrat | Dennis Frank Parsons | 1,402 | 35 | 20 | |
| Conservative | Jerry Forrest | 846 | 21 | 5 | |
| Labour | Ian Hugh White | 140 | 3 | 3 | |
| Green | Ian Antony Lander | 120 | 3 | 3 | |
| Majority | 123 | 3 | -40 | ||
| PAB hold | Swing | ||||
| Party | Candidate | Votes | % | ± | |
|---|---|---|---|---|---|
| Liberal Democrat | Christopher Francis Coleman | 1,814 | 59 | 15 | |
| Conservative | Carney Charles Bonner | 704 | 23 | 9 | |
| Labour | Robert Ramuz Irons | 233 | 8 | -2 | |
| Green | Emily Catherine Campbell | 201 | 7 | 1 | |
| UKIP | Peter Bowman | 107 | 3 | -24 | |
| Majority | 1,110 | 36 | 19 | ||
| Liberal Democrat hold | Swing | ||||
| Party | Candidate | Votes | % | ± | |
|---|---|---|---|---|---|
| Liberal Democrat | Bernard Fisher | 1,175 | 50 | 6 | |
| Conservative | Christopher John Daniels | 564 | 24 | 10 | |
| Labour | Charles Francis Fraser | 424 | 18 | 8 | |
| Green | Adrian Becker | 169 | 7 | 1 | |
| Majority | 611 | 26 | 9 | ||
| Liberal Democrat hold | Swing | ||||
Cotswold
| Party | Candidate | Votes | % | ± | |
|---|---|---|---|---|---|
| Liberal Democrat | Paul Hodgkinson | 2,365 | 60 | 21 | |
| Conservative | Mark Mackenzie-Charrington | 1,581 | 40 | 3 | |
| Majority | 784 | 20 | 18 | ||
| Liberal Democrat hold | Swing | ||||
| Party | Candidate | Votes | % | ± | |
|---|---|---|---|---|---|
| Conservative | Lynden Stow | 2,145 | 68 | 6 | |
| Liberal Democrat | Bella McMillan-Scott | 721 | 23 | 9 | |
| Green | Ailsa Spindler | 173 | 5 | 5 | |
| UKIP | Robert McNeil Wilson | 109 | 3 | -13 | |
| Majority | 1,424 | 45 | -1 | ||
| Conservative hold | Swing | ||||
| Party | Candidate | Votes | % | ± | |
|---|---|---|---|---|---|
| Liberal Democrat | Nigel Robbins | 1,971 | 58 | 19 | |
| Conservative | Stuart Tarr | 1,179 | 34 | 3 | |
| Green | Joy Irving | 138 | 4 | 0 | |
| UKIP | Chris Harlow | 132 | 4 | -16 | |
| Majority | 792 | 24 | 16 | ||
| Liberal Democrat hold | Swing | ||||
| Party | Candidate | Votes | % | ± | |
|---|---|---|---|---|---|
| Liberal Democrat | Joe Harris | 2,193 | 63 | 8 | |
| Conservative | Tony Curry | 957 | 27 | 5 | |
| Labour | Terry Pomroy | 176 | 5 | 0 | |
| UKIP | Bob Stephens | 94 | 3 | -11 | |
| Green | Bob Irving | 92 | 2 | -1 | |
| Majority | 1,236 | 36 | 3 | ||
| Liberal Democrat hold | Swing | ||||
| Party | Candidate | Votes | % | ± | |
|---|---|---|---|---|---|
| Conservative | Raymond Theodoulou | 1,867 | 55 | 7 | |
| Liberal Democrat | Andrew Doherty | 1,081 | 32 | 15 | |
| Labour | Trevor Smith | 197 | 6 | -4 | |
| Green | Xanthe Messenger | 141 | 4 | -2 | |
| UKIP | Pete Bown | 106 | 3 | -16 | |
| Majority | 786 | 23 | -6 | ||
| Conservative hold | Swing | ||||
| Party | Candidate | Votes | % | ± | |
|---|---|---|---|---|---|
| Conservative | Shaun Parsons | 1,746 | 49 | 10 | |
| Liberal Democrat | Tatyan Cheung | 1,690 | 48 | 20 | |
| UKIP | Margaret Rastelli | 118 | 3 | -15 | |
| Majority | 56 | 1 | -10 | ||
| Conservative hold | Swing | ||||
| Party | Candidate | Votes | % | ± | |
|---|---|---|---|---|---|
| Conservative | Nigel Moor | 2,340 | 63 | 6 | |
| Liberal Democrat | Rachel Coxcoon | 1,014 | 27 | 21 | |
| Green | Andrew Maclean | 210 | 6 | -2 | |
| UKIP | Edeltraud French | 139 | 4 | -14 | |
| Majority | 1,326 | 36 | -3 | ||
| Conservative hold | Swing | ||||
| Party | Candidate | Votes | % | ± | |
|---|---|---|---|---|---|
| Conservative | Stephen Hirst | 2,061 | 69 | 28 | |
| Green | Sabrina Poole | 743 | 25 | 20 | |
| UKIP | Guy Parfitt | 204 | 7 | -12 | |
| Majority | 1318 | 44 | 22 | ||
| Conservative hold | Swing | ||||
Forest of Dean
| Party | Candidate | Votes | % | ± | |
|---|---|---|---|---|---|
| Conservative | Richard Henry Boyles | 1,224 | 33 | 7 | |
| UKIP | Richard Nicholas Leppington | 1,053 | 28 | -8 | |
| Labour | Janet Hazel Keene | 743 | 20 | -13 | |
| Green | Louise Mary Elliott | 387 | 10 | 10 | |
| Liberal Democrat | Derek George Couzens | 297 | 8 | 2 | |
| Majority | 171 | 5 | 2 | ||
| Conservative gain from UKIP | Swing | ||||
| Party | Candidate | Votes | % | ± | |
|---|---|---|---|---|---|
| Labour | Graham Leslie Morgan | 1,144 | 54 | 7 | |
| Conservative | Marc Silverthorn | 527 | 25 | 12 | |
| UKIP | Roger Ashley Jean Wilkinson | 201 | 9 | -19 | |
| Green | Jill Raymond | 178 | 8 | 3 | |
| Liberal Democrat | Lindsey Margaret Read | 69 | 3 | -4 | |
| Majority | 617 | 29 | 10 | ||
| Labour hold | Swing | ||||
| Party | Candidate | Votes | % | ± | |
|---|---|---|---|---|---|
| Conservative | Carole Ann Alloway-Martin | 1,128 | 48 | 23 | |
| Labour | Shaun Stammers | 603 | 26 | -7 | |
| Liberal Democrat | Heather Margaret Lusty | 231 | 10 | 5 | |
| UKIP | Martin Robert Hill | 225 | 10 | -15 | |
| Green | Fiona Bowie | 145 | 6 | 6 | |
| Majority | 525 | 22 | 14 | ||
| Conservative gain from Labour | Swing | ||||
| Party | Candidate | Votes | % | ± | |
|---|---|---|---|---|---|
| Conservative | Terry Hale | 874 | 33 | 18 | |
| Independent | Andrew Edward Gardiner | 828 | 31 | 6 | |
| Labour | Di Martin | 692 | 26 | 2 | |
| Liberal Democrat | Gill Moseley | 133 | 5 | 2 | |
| UKIP | Averil Elisabeth Sumners | 132 | 5 | -24 | |
| Majority | 46 | 2 | -2 | ||
| Conservative gain from UKIP | Swing | ||||
| Party | Candidate | Votes | % | ± | |
|---|---|---|---|---|---|
| Conservative | Alan Preest* | 1,110 | 46 | 28 | |
| Labour | Mel Farrant | 578 | 24 | 5 | |
| UKIP | Alan Grant | 332 | 14 | -28 | |
| Green | James Greenwood | 270 | 11 | 4 | |
| Liberal Democrat | Terry Tull | 144 | 6 | 6 | |
| Majority | 532 | 22 | -1 | ||
| Conservative gain from UKIP | Swing | ||||
- Alan Preest was elected in 2013 as a UKIP councillor
| Party | Candidate | Votes | % | ± | |
|---|---|---|---|---|---|
| Conservative | Brian Robinson | 1,762 | 55 | 31 | |
| Liberal Democrat | Sue Henchley | 632 | 20 | 14 | |
| Labour | Angela Sullivan | 452 | 14 | 4 | |
| UKIP | Ian Mitchell Aitken | 193 | 6 | -13 | |
| Green | Poppy Turpin-West | 153 | 5 | 1 | |
| Majority | 1,130 | 35 | 27 | ||
| Conservative gain from Independent | Swing | ||||
- The seat had previously been gained in a by-election. Changes shown are those from 2013.
| Party | Candidate | Votes | % | ± | |
|---|---|---|---|---|---|
| Conservative | Will Windsor-Clive | 1,794 | 63 | 26 | |
| Labour | Roger Anthony Sterry | 311 | 11 | -1 | |
| Green | David Richard Humphreys | 301 | 11 | 6 | |
| Liberal Democrat | Ian Iredale King | 243 | 9 | 7 | |
| UKIP | Alec Robert Tritton | 188 | 7 | -15 | |
| Majority | 1,483 | 52 | 37 | ||
| Conservative hold | Swing | ||||
| Party | Candidate | Votes | % | ± | |
|---|---|---|---|---|---|
| Conservative | Patrick Christopher Molyneux | 1,312 | 39 | 8 | |
| Green | Chris McFarling | 780 | 23 | 12 | |
| Labour | Jake Ivor Lewis | 479 | 14 | -4 | |
| Liberal Democrat | Roy Birch | 363 | 11 | -3 | |
| Independent | Gethyn Joffre Davies | 265 | 8 | 8 | |
| UKIP | John Duncan William McOwan | 123 | 4 | -22 | |
| Majority | 532 | 16 | 11 | ||
| Conservative hold | Swing | ||||
Gloucester
| Party | Candidate | Votes | % | ± | |
|---|---|---|---|---|---|
| Conservative | Andrew Gravells | 2,320 | 70 | 23 | |
| Labour | Kirsten Hodges | 600 | 18 | - | |
| Liberal Democrat | Oliver Hartland MountJoy | 409 | 12 | 2 | |
| Majority | 1,720 | 52 | 28 | ||
| Conservative hold | Swing | ||||
| Party | Candidate | Votes | % | ± | |
|---|---|---|---|---|---|
| Liberal Democrat | David John Brown | 2,127 | 50 | 9 | |
| Conservative | Lise Noakes | 1,731 | 41 | 10 | |
| Labour | Trevor Howard | 303 | 7 | -3 | |
| Green | Frances Joan Griffiths | 77 | 2 | 2 | |
| Majority | 396 | 9 | -1 | ||
| Liberal Democrat hold | Swing | ||||
| Party | Candidate | Votes | % | ± | |
|---|---|---|---|---|---|
| Conservative | Sajid Patel | 1,459 | 51 | 9 | |
| Labour | Carol Francis | 1,157 | 40 | -6 | |
| UKIP | Phillip Anthony William Nash | 165 | 6 | 6 | |
| Liberal Democrat | Christopher Ward | 107 | 4 | -2 | |
| Majority | 302 | 11 | 7 | ||
| Conservative gain from Labour | Swing | ||||
| Party | Candidate | Votes | % | ± | |
|---|---|---|---|---|---|
| Labour | Kate Haigh | 940 | 43 | -3 | |
| Conservative | Jenny Watkins | 806 | 37 | 21 | |
| UKIP | Gary Frederick Cleaver | 241 | 11 | -19 | |
| Liberal Democrat | Stephen Derick John Morrison | 211 | 10 | 5 | |
| Majority | 134 | 6 | -10 | ||
| Labour hold | Swing | ||||
| Party | Candidate | Votes | % | ± | |
|---|---|---|---|---|---|
| Conservative | David Norman | 1,558 | 57 | 25 | |
| Labour | Mat McCall | 668 | 25 | -11 | |
| UKIP | Rob McCormick | 193 | 7 | -17 | |
| Liberal Democrat | David William Bebbington | 190 | 7 | 3 | |
| Green | Robert Peter Brookes | 103 | 4 | - | |
| Majority | 890 | 32 | 28 | ||
| Conservative gain from Labour | Swing | ||||
| Party | Candidate | Votes | % | ± | |
|---|---|---|---|---|---|
| Conservative | Pam Tracey | 1,171 | 50 | 5 | |
| Labour | Neil Hampton | 709 | 30 | -3 | |
| Liberal Democrat | Imogen Alice Caterer | 202 | 9 | 1 | |
| UKIP | Daniel Woolf | 138 | 6 | 6 | |
| Green | Matthew John Sidford | 129 | 5 | -9 | |
| Majority | 462 | 20 | 8 | ||
| Conservative hold | Swing | ||||
| Party | Candidate | Votes | % | ± | |
|---|---|---|---|---|---|
| Liberal Democrat | Jeremy Eric Hilton | 1,525 | 52 | 11 | |
| Conservative | Justin Hudson | 694 | 24 | 7 | |
| Labour | Jack Fayter | 531 | 18 | -1 | |
| Green | Jonathan Cecil Ingleby | 98 | 3 | -3 | |
| UKIP | Edit Kovacs | 83 | 3 | -11 | |
| Majority | 831 | 28 | 6 | ||
| Liberal Democrat hold | Swing | ||||
| Party | Candidate | Votes | % | ± | |
|---|---|---|---|---|---|
| Conservative | Kathy Williams | 1,884 | 49 | 8 | |
| Liberal Democrat | Linda S Castle | 1,374 | 36 | 16 | |
| Labour | Steve Gower | 312 | 8 | -3 | |
| UKIP | Matt Young | 155 | 4 | -19 | |
| Green | Christopher David Britton | 108 | 3 | -1 | |
| Majority | 510 | 13 | -5 | ||
| Conservative hold | Swing | ||||
| Party | Candidate | Votes | % | ± | |
|---|---|---|---|---|---|
| Conservative | Mark Damian Hawthorne | 1,364 | 50 | 18 | |
| Liberal Democrat | Anna Mozol | 757 | 28 | 5 | |
| Labour | John Bloxsom | 321 | 12 | -8 | |
| UKIP | Scott Clacher | 178 | 7 | -13 | |
| Green | Gerald Owain Hartley | 84 | 3 | -2 | |
| Majority | 607 | 22 | 13 | ||
| Conservative hold | Swing | ||||
| Party | Candidate | Votes | % | ± | |
|---|---|---|---|---|---|
| Conservative | Andrew Gilbert Miller | 1,710 | 52 | 17 | |
| Labour | Tracey Sharon Millard | 1,191 | 36 | - | |
| UKIP | Simon Paul Collins | 226 | 7 | -17 | |
| Liberal Democrat | Abigail Ciara Watson | 185 | 6 | 1 | |
| Majority | 519 | 16 | 15 | ||
| Conservative gain from Labour | Swing | ||||
Stroud
| Party | Candidate | Votes | % | ± | |
|---|---|---|---|---|---|
| Conservative | Keith Stuart Rippington | 2,163 | 50 | 9 | |
| Green | Alan Mossman | 1,230 | 28 | 3 | |
| Liberal Democrat | Alexander Findlay | 964 | 22 | 18 | |
| Majority | 933 | 22 | 6 | ||
| Conservative hold | Swing | ||||
| Party | Candidate | Votes | % | ± | |
|---|---|---|---|---|---|
| Conservative | Brian Tipper | 2,166 | 54 | 11 | |
| Labour | Julie Douglass | 1,456 | 36 | -5 | |
| Liberal Democrat | Adrian Anthony Walker-Smith | 411 | 10 | 1 | |
| Majority | 710 | 18 | 16 | ||
| Conservative hold | Swing | ||||
| Party | Candidate | Votes | % | ± | |
|---|---|---|---|---|---|
| Conservative | Loraine Vivienne Patrick | 1,574 | 45 | 12 | |
| Labour | Steve Lydon | 1,339 | 38 | 3 | |
| Liberal Democrat | George William James Butcher | 608 | 17 | -3 | |
| Majority | 235 | 7 | 5 | ||
| Conservative gain from Labour | Swing | ||||
| Party | Candidate | Votes | % | ± | |
|---|---|---|---|---|---|
| Conservative | Stephen Frank Davies | 1,655 | 58 | 6 | |
| Liberal Democrat | Mike Stayte | 470 | 17 | 12 | |
| Labour | Liz Ashton | 442 | 16 | -11 | |
| Green | Sue Hartley | 272 | 10 | -5 | |
| Majority | 1,185 | 41 | 16 | ||
| Conservative hold | Swing | ||||
| Party | Candidate | Votes | % | ± | |
|---|---|---|---|---|---|
| Green | Rachel Smith | 2,320 | 50 | 25 | |
| Conservative | Dorcas Lavinia Maxine Binns | 2,293 | 50 | 17 | |
| Majority | 27 | 0 | -8 | ||
| Green gain from Conservative | Swing | ||||
| Party | Candidate | Votes | % | ± | |
|---|---|---|---|---|---|
| Labour | Steve Robinson | 1,722 | 42 | 7 | |
| Conservative | Emma Sims | 1,559 | 38 | -4 | |
| Green | Sarah Blowers | 436 | 11 | -7 | |
| Liberal Democrat | Colleen Angela Rothwell | 365 | 9 | 5 | |
| Independent | Robert Hansjorg Paterson | 66 | 2 | 2 | |
| Majority | 163 | 4 | -3 | ||
| Labour gain from Conservative | Swing | ||||
| Party | Candidate | Votes | % | ± | |
|---|---|---|---|---|---|
| Labour | Brian Oosthuysen | 1,508 | 45 | 2 | |
| Conservative | Alex Bisset | 1,048 | 31 | 13 | |
| Green | Philip Blomberg | 488 | 15 | 4 | |
| Liberal Democrat | Christine Linda Headley | 292 | 9 | -1 | |
| Majority | 460 | 14 | -11 | ||
| Labour hold | Swing | ||||
| Party | Candidate | Votes | % | ± | |
|---|---|---|---|---|---|
| Labour | Lesley Williams | 1,361 | 46 | 2 | |
| Conservative | Ginny Anne Smart | 953 | 32 | 14 | |
| Green | Carol Jill Kambites | 251 | 8 | 1 | |
| Liberal Democrat | Sylvia Jean Bridgland | 213 | 7 | 4 | |
| UKIP | Glenville Alexander Gogerly | 183 | 6 | -10 | |
| Majority | 408 | 14 | -12 | ||
| Labour hold | Swing | ||||
| Party | Candidate | Votes | % | ± | |
|---|---|---|---|---|---|
| Green | Eva Ward | 1,742 | 41 | 1 | |
| Labour | Debbie Hicks | 1,262 | 30 | 2 | |
| Conservative | Debbie Young | 1,000 | 24 | 9 | |
| Liberal Democrat | Steve Dechan | 242 | 6 | 3 | |
| Majority | 480 | 11 | -1 | ||
| Green hold | Swing | ||||
| Party | Candidate | Votes | % | ± | |
|---|---|---|---|---|---|
| Liberal Democrat | John Edward Cordwell | 1,776 | 47 | 4 | |
| Conservative | Graham Smith | 1,545 | 41 | 3 | |
| Labour | Mark Huband | 337 | 9 | -3 | |
| UKIP | David Hinder | 128 | 3 | 3 | |
| Majority | 231 | 6 | 1 | ||
| Liberal Democrat hold | Swing | ||||
Tewkesbury
| Party | Candidate | Votes | % | ± | |
|---|---|---|---|---|---|
| Conservative | Robert Anthony Bird | 2,277 | 61 | 12 | |
| Liberal Democrat | Peter Raymond Norcross Richmond | 1,009 | 27 | -10 | |
| Labour | Rose Phillips | 302 | 8 | -5 | |
| Green | Cate Cody | 143 | 4 | 4 | |
| Majority | 1,268 | 34 | 22 | ||
| Conservative hold | Swing | ||||
| Party | Candidate | Votes | % | ± | |
|---|---|---|---|---|---|
| Conservative | Robert John Edward Vines | 1,788 | 53 | +11 | |
| Liberal Democrat | Clare Louise Softley | 1,055 | 32 | -9 | |
| Green | Graham Anthony Allen | 252 | 8 | +8 | |
| UKIP | Sarah Jane Field | 248 | 7 | +7 | |
| Majority | 733 | 21 | +20 | ||
| Conservative hold | Swing | ||||
| Party | Candidate | Votes | % | ± | |
|---|---|---|---|---|---|
| Liberal Democrat | Jack Lawrence Williams | 1,768 | 51 | 2 | |
| Conservative | Graham John Bocking | 1,415 | 40 | 10 | |
| Labour | Colin Gordon Simpson | 316 | 9 | -5 | |
| Majority | 353 | 11 | -8 | ||
| Liberal Democrat hold | Swing | ||||
| Party | Candidate | Votes | % | ± | |
|---|---|---|---|---|---|
| Conservative | Phil Awford | 2,530 | 71 | 4 | |
| Labour | Stephen Robert Miller | 446 | 13 | -6 | |
| Liberal Democrat | Helen S Munro | 340 | 10 | -4 | |
| Green | Susan Joan Billington | 246 | 7 | 7 | |
| Majority | 2,084 | 58 | 10 | ||
| Conservative hold | Swing | ||||
| Party | Candidate | Votes | % | ± | |
|---|---|---|---|---|---|
| Conservative | Kevin John Cromwell | 1,192 | 41 | 12 | |
| Independent | Mike Sztymiak | 1,148 | 39 | -1 | |
| Labour | Edward Hudson | 254 | 9 | 1 | |
| Liberal Democrat | Guy Dennis St John Fancourt | 157 | 5 | 2 | |
| UKIP | Stuart George Adair | 112 | 4 | -16 | |
| Independent | Gavin Preedy | 75 | 3 | 3 | |
| Majority | 44 | 2 | -9 | ||
| Conservative gain from Independent | Swing | ||||
| Party | Candidate | Votes | % | ± | |
|---|---|---|---|---|---|
| Conservative | Vernon Dennis Smith | 1,652 | 64 | 27 | |
| Liberal Democrat | Cait Clucas | 440 | 17 | 7 | |
| Labour | Fiona Cochrane Castle | 368 | 14 | 5 | |
| Green | Simon James Carter | 131 | 5 | 3 | |
| Majority | 1,212 | 47 | 31 | ||
| Conservative hold | Swing | ||||
| Party | Candidate | Votes | % | ± | |
|---|---|---|---|---|---|
| Conservative | Roger Edward Wilson | 2,469 | 64 | 2 | |
| Liberal Democrat | Tom Brinicombe | 960 | 25 | 4 | |
| Labour | Stanford Leigh Mitchell | 260 | 7 | -10 | |
| Green | Sophie Dominique Franklin | 177 | 5 | 5 | |
| Majority | 1,509 | 39 | -3 | ||
| Conservative hold | Swing | ||||
References
- ↑ "Upcoming elections & referendums". Electoral Commission. Retrieved 15 September 2016.
- ↑ "The Representation of the People (Form of Canvass) (England and Wales) Regulations 2006, Schedule Part 1". Legislation.gov.uk. 13 October 2011. Retrieved 18 April 2012.
- ↑ "I have two homes. Can I register at both addresses?". The Electoral Commission. Retrieved 5 January 2011.
| Gloucestershire County Council | |
|---|---|
| Cheltenham Borough Council | |
| Cotswold District Council |
|
| Forest of Dean District Council |
|
| Gloucester City Council | |
| South Gloucestershire Council | |
| Stroud District Council | |
| Tewkesbury Borough Council |
|
| Avon County Council |
|
| Kingswood Borough Council |
|
| Northavon District Council |
|
| |