East Sussex County Council election, 2017
|
| |||||||||||||||||||||||||||||||||||
| |||||||||||||||||||||||||||||||||||
All 50 seats to East Sussex County Council 26 seats needed for a majority | |||||||||||||||||||||||||||||||||||
|---|---|---|---|---|---|---|---|---|---|---|---|---|---|---|---|---|---|---|---|---|---|---|---|---|---|---|---|---|---|---|---|---|---|---|---|
| |||||||||||||||||||||||||||||||||||
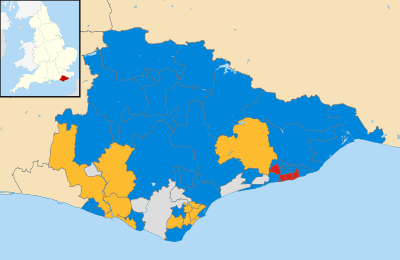 Map showing the results of the 2017 East Sussex County Council election. | |||||||||||||||||||||||||||||||||||
| |||||||||||||||||||||||||||||||||||
The 2017 East Sussex County Council election took place on 4 May 2017 as part of the 2017 local elections in the United Kingdom.[1] All councillors were to be elected from electoral divisions by first-past-the-post voting for a four-year term of office.
Boundary changes to the electoral divisions will take effect at this election after a review of the county by the Local Government Boundary Commission for England.[2] This has led to an increase in the size of the Council from 49 to 50 and the splitting of former multi-member divisions.
Results
The Conservatives took control of the council, with all UKIP's seats lost. Labour had a 3-seat loss, and the Liberal Democrats took 2 seats.[3]
Election results
| Party | Seats | Gains | Losses | Net gain/loss | Seats % | Votes % | Votes | +/− | |
|---|---|---|---|---|---|---|---|---|---|
| Conservative | 30 | 10 | 0 | +10 | 60 | 45.6 | 69,748 | +14 | |
| Liberal Democrat | 11 | 1 | 0 | +1 | 22 | 22.8 | 34,893 | +8 | |
| Labour | 4 | 0 | 3 | -3 | 6 | 14.7 | 22,488 | +0.3 | |
| Independent | 3 | 0 | 0 | ±0 | 6 | 4.2 | 6,381 | -1 | |
| No description | 2 | 0 | 0 | ±0 | 4 | 2.4 | 3,724 | N/A | |
| UKIP | 0 | 0 | 7 | -7 | 0 | 3.6 | 5,479 | -23.7 | |
| Green | 0 | 0 | 0 | ±0 | 0.0 | 5.8 | 8,803 | +2.8 | |
Eastbourne
Devonshire
| Party | Candidate | Votes | % | ± | |
|---|---|---|---|---|---|
| Liberal Democrat | Steve Wallis* | 1,424 | 49.2 | ||
| Conservative | Robert Whippy | 657 | 22.7 | ||
| Labour | Paul Howard | 463 | 16 | ||
| UKIP | Rachel Large | 232 | 8.1 | ||
| Green | Linda Wintle | 117 | 4 | ||
| Majority | |||||
| Turnout | 2,893 | 32.00 | |||
| Liberal Democrat hold | Swing | ||||
Hampden Park
| Party | Candidate | Votes | % | ± | |
|---|---|---|---|---|---|
| Liberal Democrat | Colin Swansborough | 1339 | |||
| Conservative | Mozmil Hussain | 632 | |||
| Labour | Dave Poole | 345 | |||
| Green | Ivor Heuting | 119 | |||
| Majority | |||||
| Turnout | 2,160 | 29.1 | |||
| Liberal Democrat hold | Swing | ||||
Langney
| Party | Candidate | Votes | % | ± | |
|---|---|---|---|---|---|
| Liberal Democrat | Alan Shuttleworth* | 1646 | |||
| Conservative | Christopher Whippy | 561 | |||
| UKIP | Ian Garbutt | 160 | |||
| Labour | Lee Comfort | 144 | |||
| Green | Rosana Jimenez | 44 | |||
| Majority | |||||
| Turnout | |||||
| Liberal Democrat hold | Swing | ||||
Meads
| Party | Candidate | Votes | % | ± | |
|---|---|---|---|---|---|
| Conservative | Barry Taylor* | 2213 | |||
| Liberal Democrat | Robin Maxted | 918 | |||
| Labour | Jean Couture | 236 | |||
| Green | Sally Boys | 187 | |||
| UKIP | Christopher Holloway | 157 | |||
| Majority | |||||
| Turnout | |||||
| Conservative hold | Swing | ||||
Old Town
| Party | Candidate | Votes | % | ± | |
|---|---|---|---|---|---|
| Liberal Democrat | John Ungar* | 2074 | |||
| Conservative | Vivienne de Havilland-Geraghty | 1123 | |||
| Labour | Jake Lambert | 342 | |||
| Green | Alex Hough | 184 | |||
| Majority | |||||
| Turnout | |||||
| Liberal Democrat hold | Swing | ||||
Ratton
| Party | Candidate | Votes | % | ± | |
|---|---|---|---|---|---|
| Conservative | Colin Belsey* | 2054 | |||
| Liberal Democrat | Marcus von Thiele | 697 | |||
| Labour | John Lambert | 256 | |||
| UKIP | Rex Kosters | 181 | |||
| Green | Pippa Oliphant | 95 | |||
| Majority | |||||
| Turnout | |||||
| Conservative hold | Swing | ||||
St Anthony's
| Party | Candidate | Votes | % | ± | |
|---|---|---|---|---|---|
| Liberal Democrat | David Tutt* | 1834 | |||
| Conservative | Jamie Hollywood | 847 | |||
| Labour | Jackie Ferguson | 192 | |||
| UKIP | Colin Horscroft | 150 | |||
| Green | Nick Symons | 60 | |||
| Majority | |||||
| Turnout | |||||
| Liberal Democrat hold | Swing | ||||
Sovereign
| Party | Candidate | Votes | % | ± | |
|---|---|---|---|---|---|
| Conservative | David Elkin* | 1998 | |||
| Liberal Democrat | Kate Daly | 829 | |||
| Labour | Natasha Duursma | 195 | |||
| Green | Hugh Patrick | 83 | |||
| Majority | |||||
| Turnout | |||||
| Conservative hold | Swing | ||||
Upperton
| Party | Candidate | Votes | % | ± | |
|---|---|---|---|---|---|
| Liberal Democrat | Pat Rodohan* | 1634 | |||
| Conservative | Diane Mulkeirins | 1254 | |||
| Labour | Paul Richards | 241 | |||
| Green | Dorothy Forsyth | 138 | |||
| UKIP | Amanda Sheehan | 116 | |||
| Majority | |||||
| Turnout | |||||
| Liberal Democrat hold | Swing | ||||
Hastings
Ashdown and Conquest
| Party | Candidate | Votes | % | ± | |
|---|---|---|---|---|---|
| Conservative | Peter Pragnell* | 1599 | |||
| Labour Co-op | Eileen Masters | 720 | |||
| Liberal Democrat | Robert Wakeford | 190 | |||
| Green | Gabriel Carlyle | 71 | |||
| Majority | |||||
| Turnout | |||||
| Conservative hold | Swing | ||||
Baird and Ore
| Party | Candidate | Votes | % | ± | |
|---|---|---|---|---|---|
| Conservative | Laurie Loe | 1182 | |||
| Labour | Kim Forward | 1111 | |||
| Liberal Democrat | Katy Hunter-Burbridge | 112 | |||
| Green | Judy Scott | 97 | |||
| Majority | |||||
| Turnout | |||||
| Conservative gain from Labour | Swing | ||||
Braybrooke and Castle
| Party | Candidate | Votes | % | ± | |
|---|---|---|---|---|---|
| Labour | Godfrey Daniel* | 1848 | |||
| Conservative | Rob Cooke | 684 | |||
| Liberal Democrat | Xan Brooker | 371 | |||
| Green | Andrea Needham | 252 | |||
| Majority | |||||
| Turnout | |||||
| Labour hold | Swing | ||||
Central St Leonards and Gensing
| Party | Candidate | Votes | % | ± | |
|---|---|---|---|---|---|
| Labour | Trevor Webb* | 1520 | |||
| Conservative | Graeme Williams | 784 | |||
| Green | Paul Homer | 280 | |||
| Liberal Democrat | Tony Seymour | 247 | |||
| Majority | |||||
| Turnout | |||||
| Labour hold | Swing | ||||
Hollington and Wishing Tree
| Party | Candidate | Votes | % | ± | |
|---|---|---|---|---|---|
| Labour | Phil Scott* | 1289 | |||
| Conservative | John Rankin | 795 | |||
| Liberal Democrat | Stephen Milton | 108 | |||
| Green | Arkady Johns | 103 | |||
| Majority | |||||
| Turnout | |||||
| Labour hold | Swing | ||||
Maze Hill and West St Leonards
| Party | Candidate | Votes | % | ± | |
|---|---|---|---|---|---|
| Conservative | Matthew Beaver | 1391 | |||
| Labour | Steve Thorpe | 807 | |||
| Liberal Democrat | Eve Montgomery | 285 | |||
| Independent | Diane Granger | 112 | |||
| Green | Thaddeus Skews | 94 | |||
| Majority | |||||
| Turnout | |||||
| Conservative gain from Labour | Swing | ||||
Old Hastings and Tressell
| Party | Candidate | Votes | % | ± | |
|---|---|---|---|---|---|
| Labour | Tania Charman | 1414 | |||
| Conservative | Claire Hammill | 740 | |||
| Green | Julia Hilton | 284 | |||
| Liberal Democrat | John Faulkner | 163 | |||
| Majority | |||||
| Turnout | |||||
| Labour hold | Swing | ||||
St Helens and Silverhill
| Party | Candidate | Votes | % | ± | |
|---|---|---|---|---|---|
| Conservative | Martin Clarke | 1643 | |||
| Labour | Judy Rogers | 1228 | |||
| Liberal Democrat | Stewart Rayment | 258 | |||
| Green | Sally Phillips | 129 | |||
| Majority | |||||
| Turnout | |||||
| Conservative gain from Labour | Swing | ||||
Lewes
Chailey
| Party | Candidate | Votes | % | ± | |
|---|---|---|---|---|---|
| Conservative | Jim Sheppard* | 1957 | |||
| Liberal Democrat | Peter Gardiner | 784 | |||
| Labour | Nicholas Belcher | 311 | |||
| Green | Holly Atkins | 200 | |||
| Majority | |||||
| Turnout | |||||
| Conservative hold | Swing | ||||
Lewes
| Party | Candidate | Votes | % | ± | |
|---|---|---|---|---|---|
| Independent | Ruth O'Keeffe | 2370 | |||
| Liberal Democrat | Oliver Henman | 757 | |||
| Labour | Emily Clarke | 568 | |||
| Green | Tony Rowell | 302 | |||
| Conservative | Jane Slater | 263 | |||
| Socialist | Howard Pilott | 19 | |||
| Majority | |||||
| Turnout | 52.61 | ||||
| Independent hold | Swing | ||||
Newhaven and Bishopstone
| Party | Candidate | Votes | % | ± | |
|---|---|---|---|---|---|
| Liberal Democrat | Darren Grover | 1239 | |||
| Conservative | Pater Charlton | 1194 | |||
| Labour | Andrew Bryant | 319 | |||
| UKIP | Ian Buchanan | 227 | |||
| Green | Mark Bullock | 101 | |||
| Independent | Laurence Pulling | 92 | |||
| Majority | |||||
| Turnout | 37.12 | ||||
| Liberal Democrat hold | Swing | ||||
Ouse Valley West and Down
| Party | Candidate | Votes | % | ± | |
|---|---|---|---|---|---|
| Liberal Democrat | Sarah Jane Osborne | 1722 | |||
| Conservative | Roy Burman | 1253 | |||
| Labour | Jerry Gould | 205 | |||
| Green | Anthony Shuster | 144 | |||
| Majority | |||||
| Turnout | 43.09 | ||||
| Liberal Democrat gain from UKIP | Swing | ||||
Peacehaven
| Party | Candidate | Votes | % | ± | |
|---|---|---|---|---|---|
| Conservative | Nigel Enever | 1446 | |||
| Labour | Ciarron Clarkson | 720 | |||
| UKIP | Phil Howson | 310 | |||
| Liberal Democrat | Lee St Clair | 118 | |||
| Green | Lesley Orr | 77 | |||
| Majority | |||||
| Turnout | |||||
| Conservative gain from UKIP | Swing | ||||
Ringmer and Lewes Bridge
| Party | Candidate | Votes | % | ± | |
|---|---|---|---|---|---|
| Liberal Democrat | Philip Daniel | 1492 | |||
| Green | Johnny Denis | 1385 | |||
| Conservative | Paul Gander | 1116 | |||
| Labour | Belinda Chapman | 412 | |||
| UKIP | Tony Best | 121 | |||
| Majority | |||||
| Turnout | 52.95 | ||||
| Liberal Democrat hold | Swing | ||||
Seaford North
| Party | Candidate | Votes | % | ± | |
|---|---|---|---|---|---|
| Conservative | Phil Boorman | 1767 | |||
| Liberal Democrat | Ian Cairns | 1000 | |||
| Labour | John Edson | 260 | |||
| UKIP | Eric Woodward | 232 | |||
| Green | Mary De Pleave | 119 | |||
| Majority | |||||
| Turnout | 39.62 | ||||
| Conservative gain from UKIP | Swing | ||||
Seaford South
| Party | Candidate | Votes | % | ± | |
|---|---|---|---|---|---|
| Liberal Democrat | Carolyn Lambert* | 1670 | |||
| Conservative | Sam Adeniji | 1494 | |||
| Labour | Steve Floor | 277 | |||
| UKIP | Pete Leeming | 172 | |||
| Green | Emily O'Brien | 105 | |||
| Majority | |||||
| Turnout | 42.35 | ||||
| Liberal Democrat hold | Swing | ||||
Telscombe
| Party | Candidate | Votes | % | ± | |
|---|---|---|---|---|---|
| Conservative | Andy Smith | 1575 | |||
| Labour | Julie Anne Vaughan | 723 | |||
| UKIP | Deborah Holt | 226 | |||
| Liberal Democrat | Charlie Carr | 222 | |||
| Green | Zoe Nicholson | 108 | |||
| Majority | |||||
| Turnout | 33.14 | ||||
| Conservative gain from UKIP | Swing | ||||
Rother
Battle and Crowhurst
| Party | Candidate | Votes | % | ± | |
|---|---|---|---|---|---|
| Liberal Democrat | Kathryn Field* | 1465 | |||
| Conservative | Alistair Douglas | 1080 | |||
| Labour | Antonia Berelson | 357 | |||
| UKIP | Michael Phillips | 132 | |||
| Majority | |||||
| Turnout | 40.23 | ||||
| Liberal Democrat hold | Swing | ||||
Bexhill East
| Party | Candidate | Votes | % | ± | |
|---|---|---|---|---|---|
| Independent | Charles Clark* | 919 | |||
| Conservative | Gillian Johnson | 801 | |||
| Labour | Roger McCarthy | 362 | |||
| Liberal Democrat | Diane Smith | 306 | |||
| UKIP | Geoffrey Bastin | 216 | |||
| Majority | |||||
| Turnout | 32.98 | ||||
| Independent hold | Swing | ||||
Bexhill North
| Party | Candidate | Votes | % | ± | |
|---|---|---|---|---|---|
| Conservative | Michael Ensor* | 1275 | |||
| Labour | Andy Batsford | 798 | |||
| Independent | Helen Bridger | 382 | |||
| UKIP | Trevor Clements | 245 | |||
| Liberal Democrat | Graham Martin-Royle | 146 | |||
| Turnout | 35.50 | ||||
| Conservative hold | Swing | ||||
Bexhill South
| Party | Candidate | Votes | % | ± | |
|---|---|---|---|---|---|
| Conservative | Simon Elford | 1952 | |||
| Labour | Richard Sage | 741 | |||
| Liberal Democrat | Vivienne Bond | 459 | |||
| UKIP | Sheila Allen-Rodgers | 186 | |||
| Majority | |||||
| Turnout | 35.83 | ||||
| Conservative gain from UKIP | Swing | ||||
Bexhill West
| Party | Candidate | Votes | % | ± | |
|---|---|---|---|---|---|
| Independent | Stuart Earl* | 2056 | |||
| Conservative | Martin Kenward | 1356 | |||
| Labour | Samuel Coleman | 290 | |||
| Liberal Democrat | Joel Kemp | 227 | |||
| UKIP | Alf Lovell | 148 | |||
| Majority | |||||
| Turnout | 46.31 | ||||
| Independent hold | Swing | ||||
Brede Valley and Marsham
| Party | Candidate | Votes | % | ± | |
|---|---|---|---|---|---|
| Conservative | Carl Maynard* | 2016 | |||
| Labour | Andy Ives | 414 | |||
| Liberal Democrat | Ian Stone | 408 | |||
| UKIP | Lynne Hehir | 173 | |||
| Majority | |||||
| Turnout | 38.51 | ||||
| Conservative hold | Swing | ||||
Northern Rother
| Party | Candidate | Votes | % | ± | |
|---|---|---|---|---|---|
| Conservative | Angharad Davies* | 1719 | |||
| Liberal Democrat | Sue Prochak | 782 | |||
| Labour | Larry Hyett | 241 | |||
| UKIP | Edward Tuddenham | 177 | |||
| Majority | |||||
| Turnout | 40.78 | ||||
| Conservative hold | Swing | ||||
Rother North West
| Party | Candidate | Votes | % | ± | |
|---|---|---|---|---|---|
| Conservative | John Barnes* | 1686 | |||
| UKIP | Edward Smith | 157 | |||
| Liberal Democrat | Mary Varrall | 623 | |||
| Labour | Sara Watson | 254 | |||
| Majority | |||||
| Turnout | 36.43 | ||||
| Conservative hold | Swing | ||||
Rye and Eastern Rother
| Party | Candidate | Votes | % | ± | |
|---|---|---|---|---|---|
| Conservative | Keith Glazier* | 1697 | |||
| UKIP | Alison Phillips | 204 | |||
| Labour Co-op | Nigel Jennings | 641 | |||
| Liberal Democrat | Derek Greenup | 318 | |||
| Green | Adam Smith | 197 | |||
| Majority | |||||
| Turnout | 38.48 | ||||
| Conservative hold | Swing | ||||
Wealden
Alfriston, East Hoathly & Hellingly
| Party | Candidate | Votes | % | ± | |
|---|---|---|---|---|---|
| Conservative | Nick Bennett* | 1706 | |||
| Liberal Democrat | Chris Bowers | 568 | |||
| Green | Kay Syrad | 217 | |||
| Labour | Anthony Fielding | 199 | |||
| UKIP | Chris Magness | 192 | |||
| Majority | |||||
| Turnout | 38.02 | ||||
| Conservative hold | Swing | ||||
At the previous election the UKIP candidate polled 29.4%
Crowborough North and Jarvis Brook
| Party | Candidate | Votes | % | ± | |
|---|---|---|---|---|---|
| Conservative | Richard Stogdon* | 1546 | |||
| Liberal Democrat | Karen Shaw | 439 | |||
| Labour | Sarah Newman | 292 | |||
| Green | Colin Stocks | 225 | |||
| Majority | 1007 | ||||
| Turnout | 32.27 | ||||
| Conservative hold | Swing | ||||
Crowborough South and St Johns
| Party | Candidate | Votes | % | ± | |
|---|---|---|---|---|---|
| Conservative | Sylvia Tidy* | 1774 | |||
| Liberal Democrat | Adrian Morris | 441 | |||
| Labour | Brendan Clegg | 198 | |||
| Green | Gabrielle Symonds | 159 | |||
| Majority | |||||
| Turnout | |||||
| Conservative hold | Swing | ||||
Forest Row and Groomsbridge
| Party | Candidate | Votes | % | ± | |
|---|---|---|---|---|---|
| Conservative | Francis Whetstone* | 1468 | |||
| Green | Keith Obbard | 1406 | |||
| Liberal Democrat | Tessa Younger | 331 | |||
| Majority | |||||
| Turnout | |||||
| Conservative hold | Swing | ||||
At the previous election this seat also had UKIP and Labour candidates, who polled 28.9% and 5.7% respectively.
Hailsham Market
| Party | Candidate | Votes | % | ± | |
|---|---|---|---|---|---|
| Conservative | Bob Bowdler | 943 | |||
| Liberal Democrat | Alexa Clarke | 609 | |||
| Labour | Louise Orbell | 401 | |||
| UKIP | Laurence Keeley* | 353 | |||
| Majority | |||||
| Turnout | |||||
| Conservative gain from UKIP | Swing | ||||
Hailsham New Town
| Party | Candidate | Votes | % | ± | |
|---|---|---|---|---|---|
| Conservative | Gerard Fox | 1283 | |||
| Liberal Democrat | Gavin Blake-Coggins | 634 | |||
| Labour | Mark Osborn | 364 | |||
| Green | Charlotte Still | 166 | |||
| Majority | |||||
| Turnout | 29.51 | ||||
| Conservative hold | Swing | ||||
Heathfield and Mayfield
| Party | Candidate | Votes | % | ± | |
|---|---|---|---|---|---|
| Conservative | Rupert Simmons* | 2217 | |||
| Liberal Democrat | Fraser Kerr | 374 | |||
| Labour | David Newman | 347 | |||
| Green | Clare Whistler | 202 | |||
| Majority | |||||
| Turnout | 36.18 | ||||
| Conservative hold | Swing | ||||
Maresfield and Buxted
| Party | Candidate | Votes | % | ± | |
|---|---|---|---|---|---|
| Conservative | Roy Galley* | 2381 | |||
| Liberal Democrat | James Edwards | 453 | |||
| Green | Ian Tysh | 310 | n/a | ||
| Labour | Gareth Looker | 278 | |||
| Majority | |||||
| Turnout | |||||
| Conservative hold | Swing | ||||
Pevensey and Stone Cross
| Party | Candidate | Votes | % | ± | |
|---|---|---|---|---|---|
| Conservative | Tom Liddiard | 1161 | |||
| UKIP | Mike Pursglove* | 431 | |||
| Independent | Daniel Brookbank | 366 | |||
| Liberal Democrat | Wendy Dash | 272 | |||
| Labour | Tim MacPherson | 169 | |||
| Green | Iona Rowan | 59 | |||
| Majority | |||||
| Turnout | |||||
| Conservative gain from UKIP | Swing | ||||
Polegate and Watermill
| Party | Candidate | Votes | % | ± | |
|---|---|---|---|---|---|
| No description | Daniel Shing* | 1810 | |||
| Conservative | David Watts | 1017 | |||
| Liberal Democrat | Steve Murphy | 225 | |||
| UKIP | Bernie Goodwin | 175 | |||
| Labour | Alex Mthobi | 135 | |||
| Green | Peter Wright | 62 | |||
| Majority | |||||
| Turnout | 38.91 | ||||
| No description hold | Swing | ||||
Uckfield North
| Party | Candidate | Votes | % | ± | |
|---|---|---|---|---|---|
| Conservative | Claire Dowling* | 1350 | |||
| Liberal Democrat | Paul Sparks | 815 | |||
| Labour | Robert Williams | 268 | |||
| Green | Melissa Tysh | 102 | |||
| Majority | |||||
| Turnout | 35.54 | ||||
| Conservative hold | Swing | ||||
Uckfield South with Framfield
| Party | Candidate | Votes | % | ± | |
|---|---|---|---|---|---|
| Conservative | Chris Dowling* | 1558 | |||
| Liberal Democrat | Paul Meakin | 552 | |||
| Labour | William Ball | 314 | |||
| Green | Pamela Tysh | 176 | |||
| Majority | |||||
| Turnout | 37.41 | ||||
| Conservative hold | Swing | ||||
At the last election the UKIP candidate polled 32.2%.
Wealden East
| Party | Candidate | Votes | % | ± | |
|---|---|---|---|---|---|
| Conservative | Bill Bentley* | 1973 | |||
| Liberal Democrat | Paul Coleshill | 614 | |||
| Labour | Jane Vinnicombe | 326 | |||
| UKIP | Hannah Shoubridge | 282 | |||
| Green | Eve Ashley | 257 | |||
| Majority | |||||
| Turnout | 38.94 | ||||
| Conservative hold | Swing | ||||
Wealden North East
| Party | Candidate | Votes | % | ± | |
|---|---|---|---|---|---|
| Conservative | Bob Standley* | 1926 | |||
| Liberal Democrat | Beverley Johnstone | 407 | |||
| Green | Beth Martin | 285 | |||
| Labour | Christopher Morris | 206 | |||
| Majority | |||||
| Turnout | 36.82 | ||||
| Conservative hold | Swing | ||||
Willingdon and South Downs
| Party | Candidate | Votes | % | ± | |
|---|---|---|---|---|---|
| No description | Stephen Shing* | 1914 | |||
| Conservative | Douglas Murray | 1309 | |||
| Liberal Democrat | Christopher Hartley | 292 | |||
| UKIP | Maureen Goodwin | 124 | |||
| Labour | Jill Shacklock | 110 | |||
| Green | Jennifer Howells | 97 | |||
| Majority | |||||
| Turnout | |||||
| No description hold | Swing | ||||
References
- ↑ "Upcoming elections & referendums". Electoral Commission. Retrieved 16 September 2016.
- ↑ "East Sussex County Council". Local Government Boundary Commission for England. Retrieved 16 September 2016.
- ↑ "East Sussex County Council - BBC News". BBC. Retrieved 5 May 2017.
- ↑ "East Sussex In Figures". [www.eastsussexinfigures.org.uk]. 5 May 2017. Retrieved 2017-05-05.
| East Sussex County Council | |
|---|---|
| Brighton and Hove City Council | |
| Eastbourne Borough Council | |
| Hastings Borough Council | |
| Lewes District Council |
|
| Rother District Council | |
| Wealden District Council | |
| Brighton Borough Council |
|
| Hove Borough Council |
|
| |