Norwich City Council election, 2012
| |||||||||||||||||||||||||||||||||||||
15 of 39 seats to Norwich City Council 20 seats needed for a majority | |||||||||||||||||||||||||||||||||||||
|---|---|---|---|---|---|---|---|---|---|---|---|---|---|---|---|---|---|---|---|---|---|---|---|---|---|---|---|---|---|---|---|---|---|---|---|---|---|
| |||||||||||||||||||||||||||||||||||||
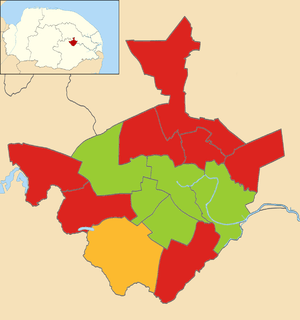 Map showing the 2012 local election results in Norwich. | |||||||||||||||||||||||||||||||||||||
| |||||||||||||||||||||||||||||||||||||
Elections to Norwich City Council took place on 3 May 2012, the same day as other United Kingdom local elections, 2012.[1] Fifteen out of thirty-nine council seats were up for election and the Labour party gained control of the council from No Overall Control.
The Green Party held firm, while the Liberal Democrats and Conservatives suffered losses.
The Liberal Democrats lost their last seat in Lakenham to Labour, meaning that they now only held seats in the affluent Eaton ward. Former Liberal Democrat Group leader, Judith Lubbock held Eaton convincingly. The Conservatives were wiped off the Council following gains by Labour in Bowthorpe and Catton Grove. This was the first time since 2000 that the party had no representation at City Hall.
After the election, the composition of the council was as follows:
- Labour 21 (+3)
- Green 15 (no change)
- Liberal Democrat 3 (-1)
- Conservative 0 (-2)
All changes in vote share are calculated with reference to the 2008 election, the last time these seats were contested.
Election result
| Party | Seats | Gains | Losses | Net gain/loss | Seats % | Votes % | Votes | +/− | |
|---|---|---|---|---|---|---|---|---|---|
| Labour | 8 | 3 | 0 | +3 | 53.3 | 39.7 | 12,854 | +14.8 | |
| Green | 6 | − | − | − | 40.0 | 30.3 | 9,847 | +1.4 | |
| Conservative | 0 | 0 | 2 | -2 | − | 16.3 | 5,285 | -6.7 | |
| Liberal Democrat | 1 | 0 | 1 | -1 | 6.7 | 13.0 | 4,215 | -8.4 | |
| UKIP | 0 | − | − | − | − | 0.7 | 215 | ±0.0 | |
| Total | 15 | Turnout | 31.7% | 32,416 | |||||
Council Composition
Prior to the election the composition of the council was:
| 18 | 15 | 4 | 2 |
| Labour | Green | Lib Dem | Con |
After the election, the composition of the council was:
| 21 | 15 | 3 |
| Labour | Green | Lib Dem |
References
- ↑ "Local elections 2012". BBC News. Retrieved 2012-04-30.
- ↑ http://www.andrewteale.me.uk/leap/results/2012/279/
| Norfolk County Council | |
|---|---|
| Breckland District Council | |
| Broadland District Council |
|
| Great Yarmouth Borough Council | |
| King's Lynn and West Norfolk Borough Council |
|
| North Norfolk District Council | |
| Norwich City Council | |
| South Norfolk District Council | |
| |