Angus Council election, 2017
|
|
|
All 28 seats to Angus Council
15 seats needed for a majority |
|---|
| |
First party |
Second party |
Third party |
| |
|
|
|
| Leader |
Lynne Devine |
Bob Myles |
Craig Fotheringham |
| Party |
SNP |
Independent |
Conservative |
| Leader's seat |
Forfar and District |
Brechin and Edzell |
Monifieth and Sidlaw |
| Last election |
13 seats, 44.8% |
6 seats, 20.7% |
5 seats, 17.2% |
| Seats before |
15 |
8 |
4 |
| Seats won |
9 |
9 |
8 |
| Seat change |
 6 6 |
 1 1 |
4 |
| Popular vote |
12,657 |
10,144 |
13,741 |
| Percentage |
31.2% |
25.0% |
33.9% |
|
| |
Fourth party |
Fifth party |
| |
|
|
| Leader |
Richard Moore |
Margaret Thomson |
| Party |
Liberal Democrats |
Labour |
| Leader's seat |
Arbroath West, Letham & Friockheim |
Monifieth and Sidlaw (retired) |
| Last election |
3 seat, 10.3% |
2 seats, 6.9% |
| Seats before |
1 |
1 |
| Seats won |
2 |
0 |
| Seat change |
1 |
1 |
| Popular vote |
1,873 |
2,178 |
| Percentage |
4.6% |
5.4% |
|
|
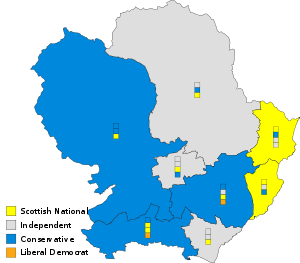 The multi-member wards |
Council Leader before election
Iain Gaul
SNP |
Council Leader after election
Bob Myles
Independent |
|
Elections to Angus Council were held on 4 May 2017 the same day as the other Scottish local government elections. The election used the eight wards, created as a result of the Local Governance (Scotland) Act 2004, with each ward electing three or four Councillors using the single transferable vote system a form of proportional representation, with 28 Councillors being elected, a reduction of 1 compared to 2012.
Following the 2012 election the Scottish National Party formed the administration on the Council. Cllr Ian Gaul (Kirriemuir and Dean)was appointed Leader of the Council at the subsequent statutory meeting, Cllr Paul Valentine (Montrose) Depute Leader. Cllr Helen Oswald (Carnoustie and District) was elected Provost.
Election result
Angus Local Election Result 2017
| Party |
Seats |
Gains |
Losses |
Net gain/loss |
Seats % |
Votes % |
Votes |
+/− |
| |
SNP |
9 |
0 |
6 |
-6 |
32.1 |
31.2 |
12,657 |
-13.2 |
| |
Independent |
9 |
1 |
0 |
+1 |
32.1 |
25.0 |
10,144 |
+0.2 |
| |
Conservative |
8 |
+4 |
0 |
+4 |
28.6 |
33.9 |
13,741 |
+16.1 |
| |
Liberal Democrats |
2 |
2 |
1 |
+1 |
7.1 |
4.6 |
1,873 |
-1.2 |
| |
Labour |
0 |
0 |
1 |
-1 |
0 |
5.4 |
2,178 |
-2.0 |
Note: "Votes" are the first preference votes. The net gain/loss and percentage changes relate to the result of the previous Scottish local elections on 3 May 2012. This may differ from other published sources showing gain/loss relative to seats held at dissolution of Scotland's councils.[1]
Ward results
Kirriemuir and Dean
- 2012: 2 x SNP, 1 x Conservative
- 2017: 2 x Conservative, 1 x SNP
- 2012-2017 Change: 1 x Conservative gain from SNP
| Kirriemuir and Dean - 3 seats |
| Party | Candidate | % 1st Pref | Count 1 | Count 2 |
|
Conservative |
Ronnie Proctor (incumbent) |
30.52% |
1,397 |
|
|
SNP |
Julie Bell |
27.09% |
1,240 |
|
|
Conservative |
Angus Macmillan-Douglas |
24.43% |
1,118 |
1,319 |
|
SNP |
Jeanette Gaul (incumbent) |
9.02% |
413 |
421 |
|
Liberal Democrats |
Liz Petrie |
4.50% |
206 |
219 |
|
Labour |
Gordon Watson |
4.44% |
203 |
211 |
| Electorate: TBC Valid: 4,577 Spoilt: 117 Quota: 1,145 Turnout: 52.9% |
Brechin and Edzell
- 2012: 2 x SNP, 1 x Independent
- 2017: 1 x SNP, 1 x Independent, 1 x Conservative
- 2012-2017 Change: 1 x Conservative gain from SNP
| Brechin and Edzell - 3 seats |
| Party | Candidate | % 1st Pref | Count 1 | Count 2 | Count 3 | Count 4 | Count 5 | Count 6 | Count 7 |
|
Conservative |
Gavin Nicol |
30.42% |
1,281 |
|
|
|
|
|
|
|
Independent |
Bob Myles (incumbent) |
18.81% |
792 |
882 |
930 |
977 |
988 |
988 |
1,544 |
|
SNP |
Kenny Braes |
18.10% |
762 |
765 |
776 |
794 |
1,055 |
|
|
|
Independent |
Jill Scott |
17.48% |
736 |
777 |
812 |
882 |
906 |
907 |
|
|
Independent |
Paul Wright* |
7.31% |
308 |
310 |
311 |
332 |
|
|
|
|
Labour |
Marjory Smith |
4.82% |
203 |
216 |
241 |
|
|
|
|
|
Liberal Democrats |
Alison Andrews |
3.06% |
129 |
153 |
|
|
|
|
|
| Electorate: TBC Valid: 4,211 Spoilt: 69 Quota: 1,053 Turnout: 47.4% |
- Nominated and will appear on Ballot Paper as SNP Candidate.[2]
Forfar and District
- 2012: 2 x SNP, 2 x Independent
- 2017: 2 x Independent, 1 x SNP, 1 x Conservative
- 2012-2017 Change: 1 x Conservative gain from SNP
| Forfar and District - 4 seats |
| Party | Candidate | % 1st Pref | Count 1 | Count 2 | Count 3 | Count 4 | Count 5 | Count 6 | Count 7 |
|
Conservative |
Braden Davy |
24.14% |
1,333 |
|
|
|
|
|
|
|
Independent |
Colin Brown (incumbent) |
19.66% |
1,086 |
1,144 |
|
|
|
|
|
|
SNP |
Lynne Devine (incumbent) |
17.64% |
974 |
978 |
980 |
997 |
1,025 |
1,086 |
1,105 |
|
Independent |
Ian McLaren (incumbent) |
14.63% |
808 |
861 |
883 |
920 |
990 |
1,253 |
|
|
SNP |
Glennis Middleton (incumbent) |
10.47% |
578 |
581 |
582 |
589 |
597 |
644 |
656 |
|
Independent |
Ian Whyte |
7.82% |
432 |
452 |
459 |
476 |
516 |
|
|
|
Labour |
Ed McAdam |
3.58% |
198 |
213 |
214 |
250 |
|
|
|
|
Liberal Democrats |
Glen Barclay |
2.06% |
114 |
137 |
138 |
|
|
|
|
| Electorate: TBC Valid: 5,523 Spoilt: 97 Quota: 1,105 Turnout: 47.1% |
Monifieth and Sidlaw
- 2012: 2 x SNP, 1 x Conservative, 1 x Labour
- 2017: 2 x SNP, 1 x Conservative 1 x Liberal Democrat
- 2012-2017 Change: 1 x Liberal Democrat gain from Labour
| Monifieth and Sidlaw - 4 seats |
| Party | Candidate | % 1st Pref | Count 1 | Count 2 | Count 3 | Count 4 | Count 5 |
|
Conservative |
Craig Fotheringham (incumbent) |
43.40% |
2,901 |
|
|
|
|
|
SNP |
Sheila Hands (incumbent) |
25.83% |
1,727 |
|
|
|
|
|
Liberal Democrats |
Ben Lawrie |
11.88% |
794 |
1,477 |
|
|
|
|
Labour |
Ray Strachan |
9.62% |
643 |
863 |
878 |
948 |
|
|
SNP |
Beth Whiteside |
9.27% |
620 |
660 |
1,005 |
1,021 |
1,254 |
| Electorate: TBC Valid: 6,685 Spoilt: 111 Quota: 1,338 Turnout: 50.8% |
Carnoustie and District
- 2012: 2 x Independent, 1 x SNP
- 2017: 2 x Independent, 1 x SNP
- 2012-2017 Change: No Change
| Carnoustie and District - 3 seats |
| Party | Candidate | % 1st Pref | Count 1 | Count 2 | Count 3 | Count 4 | Count 5 | Count 6 | Count 7 |
|
SNP |
Mark McDonald |
26.78% |
1,359 |
|
|
|
|
|
|
|
Independent |
Brian Boyd (incumbent) |
18.09% |
918 |
930 |
948 |
1,000 |
1,271 |
|
|
|
Independent |
David Cheape (incumbent) |
17.91% |
909 |
924 |
937 |
1,014 |
1,224 |
1,226 |
1,643 |
|
Conservative |
Terry O'Halloran |
17.71% |
899 |
901 |
919 |
978 |
1,038 |
1,038 |
|
|
Independent |
Bill Bowles (incumbent) |
11.21% |
569 |
581 |
587 |
647 |
|
|
|
|
Labour |
Joanne McFadden |
6.92% |
351 |
361 |
380 |
|
|
|
|
|
Liberal Democrats |
Beth Morrison |
1.38% |
70 |
77 |
|
|
|
|
|
| Electorate: TBC Valid: 5,075 Spoilt: 49 Quota: 1,269 Turnout: 47.6% |
Arbroath West, Letham and Friockheim
- 2012: 2 x SNP, 1 x Conservative, 1 x Independent
- 2017: 1 x SNP, 1 x Conservative, 1 x Independent, 1 x Liberal Democrat
- 2012-2017 Change: 1 X Liberal Democrat gain from SNP
| Arbroath West, Letham and Friockheim - 4 seats |
| Party | Candidate | % 1st Pref | Count 1 | Count 2 | Count 3 | Count 4 | Count 5 |
|
Conservative |
David Lumgair (incumbent) |
42.32% |
2,585 |
|
|
|
|
|
Independent |
David Fairweather (incumbent) |
23.98% |
1,465 |
|
|
|
|
|
SNP |
Alex King (incumbent) |
19.75% |
1,206 |
1,251 |
|
|
|
|
SNP |
Donald Morrison (incumbent) * |
8.61% |
526 |
545 |
589 |
614 |
|
|
Liberal Democrats |
Richard Moore |
5.34% |
326 |
979 |
1,076 |
1,077 |
1,323 |
| Electorate: TBC Valid: 6,108 Spoilt: 105 Quota: 1,222 Turnout: 45.2% |
- Sitting Councillor for Arbroath East and Lunan Ward.
Arbroath East and Lunan
- 2012: 2 x SNP, 1 x Independent, 1 x Conservative
- 2017: 1 x Conservative, 1 x Independent, 1 x SNP
- 2012-2017 Change: 1 x SNP loss due to there being one less seat than 2012.
| Arbroath East and Lunan - 3 seats |
| Party | Candidate | % 1st Pref | Count 1 | Count 2 | Count 3 | Count 4 | Count 5 | Count 6 | Count 7 |
|
Conservative |
Derek Wann |
24.4% |
852 |
860 |
866 |
901 |
|
|
|
|
SNP |
Brenda Durno (incumbent) |
22.5% |
786 |
791 |
793 |
822 |
823 |
841 |
879 |
|
Independent |
Lois Speed |
21.9% |
763 |
773 |
798 |
858 |
865 |
1,071 |
|
|
SNP |
Sheena Welsh (incumbent) |
12.8% |
446 |
447 |
449 |
466 |
467 |
480 |
502 |
|
Labour |
John Ruddy |
7.4% |
257 |
261 |
263 |
|
|
|
|
|
Independent |
Kevin Smith |
7.3% |
254 |
268 |
293 |
348 |
356 |
|
|
|
Independent |
Ian Watson |
2.1% |
72 |
74 |
|
|
|
|
|
|
Liberal Democrats |
Mark Smith |
1.6% |
56 |
|
|
|
|
|
|
| Electorate: 10,054 Valid: 3,486 Spoilt: 63 Quota: 872 Turnout: 35.3% |
Montrose and District
- 2012: 2 x SNP, 1 x Independent, 1 x Liberal Democrat
- 2017: 1 x SNP, 1 x Conservative, 2 x Independent
- 2012-2017 Change:1 x Conservative gain from SNP, 1 x Independent gain from Liberal Democrats
| Montrose and District - 4 seats |
| Party | Candidate | % 1st Pref | Count 1 | Count 2 | Count 3 | Count 4 | Count 5 | Count 6 |
|
Conservative |
Ron Sturrock |
27.9% |
1,375 |
|
|
|
|
|
|
SNP |
Bill Duff (incumbent) |
23.2% |
1,142 |
|
|
|
|
|
|
Independent |
Mark Salmond (incumbent) |
13.9% |
687 |
797 |
809 |
867 |
983 |
1,175 |
|
Independent |
Tommy Stewart |
13.2% |
653 |
727 |
732 |
770 |
852 |
1,011 |
|
SNP |
Gill Stranock |
11.6% |
570 |
574 |
692 |
715 |
768 |
|
|
Labour |
Pamela Ruddy |
6.6% |
323 |
358 |
365 |
428 |
|
|
|
Liberal Democrats |
Avril Simpson |
1.7% |
178 |
240 |
242 |
|
|
|
| Electorate: 12,058 Valid: 4,928 Spoilt: 88 Quota: 986 Turnout: 41.6% |