Breckland District Council elections
Breckland District Council is elected every four years.
(For further information on Breckland Council click on this link, Breckland District Council)
Political control
No overall control 1973 - 1979
Conservative 1979 - 1995
No overall control 1995 - 1999
Conservative 1999 - present
Council elections
- Breckland District Council election, 1973
- Breckland District Council election, 1976
- Breckland District Council election, 1979 (New ward boundaries)[1]
- Breckland District Council election, 1983
- Breckland District Council election, 1987
- Breckland District Council election, 1991 (District boundary changes took place but the number of seats remained the same)[2]
- Breckland District Council election, 1995
- Breckland District Council election, 1999
- Breckland District Council election, 2003 (New ward boundaries)[3]
- Breckland District Council election, 2007
- Breckland District Council election, 2011
- Breckland District Council election, 2015 (New ward boundaries)[4]
For by-election results, please see the page on Breckland District Council By-elections.
District result maps
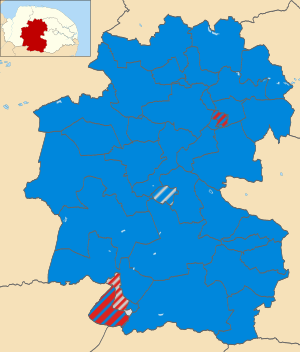 2011 results map
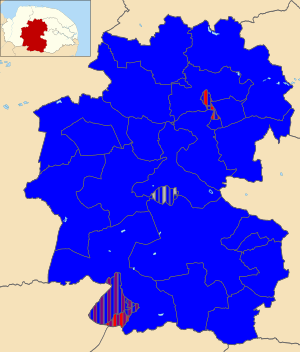 2015 results map
By-election results
| Party | Candidate | Votes | % | ± | |
|---|---|---|---|---|---|
| Labour | 235 | 40.1 | |||
| Conservative | 211 | 36.0 | |||
| Liberal Democrat | 140 | 23.9 | |||
| Majority | 24 | 4.1 | |||
| Turnout | 586 | 41.0 | |||
| Labour hold | Swing | ||||
| Party | Candidate | Votes | % | ± | |
|---|---|---|---|---|---|
| Labour | 335 | 57.7 | +6.4 | ||
| Conservative | 214 | 36.8 | +36.8 | ||
| Liberal Democrat | 32 | 5.5 | +5.5 | ||
| Majority | 121 | 20.9 | |||
| Turnout | 581 | 45.0 | |||
| Labour hold | Swing | ||||
| Party | Candidate | Votes | % | ± | |
|---|---|---|---|---|---|
| Conservative | 366 | 65.4 | +21.4 | ||
| Labour | 128 | 22.8 | -33.2 | ||
| Liberal Democrat | 66 | 11.8 | +11.8 | ||
| Majority | 238 | 42.6 | |||
| Turnout | 560 | ||||
| Conservative gain from Labour | Swing | ||||
| Party | Candidate | Votes | % | ± | |
|---|---|---|---|---|---|
| Conservative | 321 | 47.1 | |||
| Labour | 166 | 24.4 | |||
| Independent | 165 | 24.2 | |||
| Green | 29 | 4.3 | |||
| Majority | 155 | 22.7 | |||
| Turnout | 681 | 45.0 | |||
| Conservative gain from Labour | Swing | ||||
| Party | Candidate | Votes | % | ± | |
|---|---|---|---|---|---|
| Conservative | 662 | 58.0 | +39.3 | ||
| Labour | 302 | 26.4 | -12.1 | ||
| Liberal Democrat | 178 | 15.6 | -7.2 | ||
| Majority | 360 | 31.6 | |||
| Turnout | 1,142 | 20.0 | |||
| Conservative gain from Labour | Swing | ||||
| Party | Candidate | Votes | % | ± | |
|---|---|---|---|---|---|
| Labour | 281 | 58.3 | -12.4 | ||
| Conservative | 163 | 33.8 | +13.9 | ||
| Liberal Democrat | 38 | 7.9 | -1.5 | ||
| Majority | 118 | 24.5 | |||
| Turnout | 482 | 18.4 | |||
| Labour hold | Swing | ||||
| Party | Candidate | Votes | % | ± | |
|---|---|---|---|---|---|
| Liberal Democrat | 278 | 51.6 | +36.6 | ||
| Conservative | 200 | 37.1 | +6.7 | ||
| Green | 61 | 11.3 | +2.4 | ||
| Majority | 78 | 14.5 | |||
| Turnout | 539 | 25.0 | |||
| Liberal Democrat gain from Labour | Swing | ||||
| Party | Candidate | Votes | % | ± | |
|---|---|---|---|---|---|
| Conservative | Frank Sharpe | 851 | 66.3 | +11.2 | |
| Labour | Margaret Holmes | 243 | 19.0 | +19.0 | |
| Liberal Democrat | David Thomas | 189 | 14.7 | -30.2 | |
| Majority | 608 | 47.3 | |||
| Turnout | 1,283 | 24.3 | |||
| Conservative hold | Swing | ||||
| Party | Candidate | Votes | % | ± | |
|---|---|---|---|---|---|
| Conservative | Stephen Askew | 546 | 42.0 | +1.7 | |
| Labour | Philip Andrew Spiby | 393 | 30.2 | +11.6 | |
| Independent | Anthony Frederick Crouch | 360 | 27.7 | +27.7 | |
| Majority | |||||
| Turnout | 698 | 18.2 | |||
| Conservative hold | Swing | ||||
| Party | Candidate | Votes | % | ± | |
|---|---|---|---|---|---|
| Conservative | Theresa Ruth Hewett | 335 | 48.1 | -2.8 | |
| Liberal Democrat | Andrew Thorpe | 105 | 15.1 | +15.1 | |
| Independent | Patricia Helena Warwick | 104 | 14.9 | +14.9 | |
| UKIP | David Williams | 80 | 11.5 | -20.1 | |
| Labour | Joseph Manuel Sisto | 72 | 10.3 | +10.3 | |
| Majority | |||||
| Turnout | 698 | 18.2 | |||
| Conservative hold | Swing | ||||
| Party | Candidate | Votes | % | ± | |
|---|---|---|---|---|---|
| Conservative | Robert George Kybird | 666 | 75.0 | ||
| Labour | Christopher Harvey | 223 | 25.0 | ||
| Majority | |||||
| Turnout | 900 | 35.81 | |||
| Conservative hold | Swing | ||||
Note: swings cannot be given: Harling and Heathlands was previously uncontested.
| Party | Candidate | Votes | % | ± | |
|---|---|---|---|---|---|
| Labour | Michael Patrick Brindle | 503 | 57.7 | +28.0 | |
| Conservative | Jane Lillian James | 257 | 29.5 | -3.7 | |
| UKIP | Dean Roberts | 112 | 12.8 | -24.3 | |
| Majority | |||||
| Turnout | 874 | 17.40 | |||
| Labour gain from Conservative | Swing | ||||
References
- ↑ The District of Breckland (Electoral Arrangements) Order 1978
- ↑ legislation.gov.uk - The Cambridgeshire, Norfolk and Suffolk (County Boundaries) Order 1990. Retrieved on 5 November 2015.
- ↑ legislation.gov.uk - The District of Breckland (Electoral Changes) Order 2002. Retrieved on 4 October 2015.
- ↑ legislation.gov.uk - The Breckland (Electoral Changes) Order 2014. Retrieved on 3 November 2015.
External links
| Norfolk County Council | |
|---|---|
| Breckland District Council | |
| Broadland District Council |
|
| Great Yarmouth Borough Council | |
| King's Lynn and West Norfolk Borough Council |
|
| North Norfolk District Council | |
| Norwich City Council | |
| South Norfolk District Council | |
| |
This article is issued from
Wikipedia.
The text is licensed under Creative Commons - Attribution - Sharealike.
Additional terms may apply for the media files.