Dundee City Council election, 2017

|
|
|
All 29 seats to Dundee City Council
15 seats needed for a majority |
|---|
| Turnout |
39.6% ( 2.9%) 2.9%) |
|---|
| |
First party |
Second party |
Third party |
| |
|
|
|
| Leader |
John Alexander |
Kevin Keenan |
Derek Scott |
| Party |
SNP |
Labour |
Conservative |
| Leader's seat |
Strathmartine |
Strathmartine |
The Ferry |
| Last election |
16 seats, 43.6% |
10 seats, 34.5% |
1 seat, 11.3% |
| Seats won |
14 |
9 |
3 |
| Seat change |
 2 2 |
1 |
2 |
| Popular vote |
18,289 |
8,997 |
7,644 |
| Percentage |
41.3% |
20.3% |
17.3% |
| Swing |
2.1% |
9.8% |
6.0% |
|
| |
Fourth party |
Fifth party |
| |
|
|
| Leader |
Fraser Macpherson |
Ian Borthwick |
| Party |
Liberal Democrats |
Independent |
| Leader's seat |
West End |
Strathmartine |
| Last election |
1 seat, 9.0% |
1 seat, 4.4% |
| Seats won |
2 |
1 |
| Seat change |
1 |
 0 0 |
| Popular vote |
3,589 |
2,364 |
| Percentage |
8.1% |
5.3% |
| Swing |
0.9% |
0.9% |
|
|
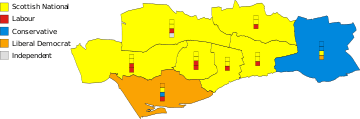 The eight multi-member wards; colours denote the winning party, as shown in the main table of results. |
|
Elections to Dundee City Council were held on 4 May 2017 on the same day as the other Scottish local government elections. The election used the eight wards created as a result of the Local Governance (Scotland) Act 2004, with each ward electing three or four Councillors using the single transferable vote system (a form of proportional representation). A total of 29 Councillors were elected.
After the 2012 election a Scottish National Party (SNP) administration had been formed. In 2017 the SNP lost 2 seats reducing their numbers to 15, being one seat short of an overall majority. They formed an administration with the support of the Independent Ian Borthwick.
2017 Results
Note: "Votes" are the first preference votes. The net gain/loss and percentage changes relate to the result of the previous Scottish local elections on 3 May 2012. This may differ from other published sources showing gain/loss relative to seats held at dissolution of Scotland's councils.
Ward results
Strathmartine
- 2012: 2xSNP; 1xLab; 1xIndependent
- 2017: 2xSNP; 1xLab; 1xIndependent
- 2012-2017 Change: No Change
| Strathmartine - 4 seats |
| Party | Candidate | % 1st Pref | Count 1 | Count 2 | Count 3 | Count 4 | Count 5 | Count 6 | Count 7 |
|
SNP |
John Alexander (incumbent) |
32.1% |
1,956 |
|
|
|
|
|
|
|
Labour |
Kevin Keenan (incumbent) |
18.9% |
1,155 |
1,178.7 |
1,182.9 |
1,220.9 |
|
|
|
|
Liberal Democrats |
Daniel Coleman |
13.6% |
828 |
866 |
869.5 |
884.5 |
884.8 |
1,076.9 |
|
|
Independent |
Ian Borthwick (incumbent) |
13.5% |
825 |
876.5 |
883.3 |
911.9 |
912.2 |
1,085.4 |
1,641.1 |
|
SNP |
Stewart Hunter (incumbent) |
11.2% |
680 |
1,250.05 |
|
|
|
|
|
|
Conservative |
Robert Lindsay |
9.0% |
546 |
549.8 |
550.1 |
555.2 |
555.3 |
|
|
|
TUSC |
Sinead Daly |
1.7% |
105 |
115.2 |
118.7 |
|
|
|
|
| Electorate: 15,017 Valid: 6,095 Spoilt: 139 Quota: 1,220 Turnout: 6,234 (41.5%) |
Lochee
- 2012: 2xSNP; 1xLab; 1x independent
- 2017: 2xSNP; 2xLab
- 2012-2017: Labour Gain from independent
| Lochee - 4 seats |
| Party | Candidate | % 1st Pref | Count 1 | Count 2 | Count 3 | Count 4 | Count 5 | Count 6 | Count 7 | Count 8 | Count 9 | Count 10 |
|
SNP |
Alan Ross (incumbent) |
28.6% |
1,661 |
|
|
|
|
|
|
|
|
|
|
Labour |
Charlie Malone |
15.9% |
924 |
933.3 |
940.3 |
943.7 |
959.9 |
993.4 |
1,020.9 |
1,217.7 |
|
|
|
SNP |
Roisin Smith |
14.1% |
818 |
1,256.9 |
|
|
|
|
|
|
|
|
|
Labour |
Michael Marra |
13.4% |
778 |
785.5 |
793.2 |
794.5 |
812.8 |
819.4 |
848.4 |
968.5 |
1,012.5 |
1,241.8 |
|
Conservative |
Mason Mcilreavy |
12.1% |
700 |
702.4 |
703.9 |
708.2 |
724.5 |
728.5 |
739.2 |
813.2 |
814.9 |
|
|
Independent |
Tom Ferguson (incumbent) |
9.7% |
565 |
574.3 |
582.4 |
584.4 |
597.5 |
623.6 |
673.4 |
|
|
|
|
Scottish Green |
Gordon Matheson |
2.3% |
132 |
137.4 |
163.6 |
166.2 |
185.8 |
206.5 |
|
|
|
|
|
TUSC |
Leah Ganley |
1.8% |
102 |
104.1 |
108.06 |
110.06 |
112.2 |
|
|
|
|
|
|
Liberal Democrats |
Lynn Hutchison |
1.6% |
91 |
91.6 |
92.2 |
106.5 |
|
|
|
|
|
|
|
Liberal Democrats |
Kirsty McKenzie |
0.5% |
31 |
32.5 |
35.1 |
|
|
|
|
|
|
|
| Electorate: 14,276 Valid: 5,802 Spoilt: 163 Quota: 1,161 Turnout: 5,965 (41.8%) |
West End
- 2012: 2xSNP; 1xLib Dem; 1xLab
- 2017: 1xLib Dem; 1xSNP; 1xCon; 1xLab
- 2012-2017: Conservative gain one seat from SNP
| West End - 4 seats |
| Party | Candidate | % 1st Pref | Count 1 | Count 2 | Count 3 | Count 4 | Count 5 | Count 6 | Count 7 | Count 8 |
|
Liberal Democrats |
Fraser MacPherson (incumbent) |
38.5% |
2,105 |
|
|
|
|
|
|
|
|
SNP |
Bill Campbell (incumbent) |
19.9% |
1,090 |
1,210.9 |
|
|
|
|
|
|
|
Conservative |
Donald Hay |
11.8% |
643 |
887.2 |
888.5 |
889.5 |
901.3 |
929.8 |
958.6 |
987.2 |
|
Labour |
Richard McCready (incumbent) |
11.6% |
637 |
876.9 |
883.6 |
889.2 |
904.04 |
932.9 |
1,078.6 |
1,416.7 |
|
SNP |
Steven Rome |
8.7% |
474 |
506.6 |
597.5 |
611.1 |
623.5 |
637.1 |
838.8 |
|
|
Scottish Green |
Morgan Petrie |
6.1% |
331 |
432.2 |
439.5 |
472.7 |
495.1 |
515.9 |
|
|
|
Independent |
Andrew McBride |
1.2% |
67 |
118.3 |
119.6 |
123.09 |
136.9 |
|
|
|
|
Independent |
Bradley Booth |
1.2% |
65 |
93.8 |
95.1 |
96.7 |
|
|
|
|
|
Scottish Socialist |
Tam Wilson |
1.1% |
59 |
66.2 |
66.9 |
|
|
|
|
|
| Electorate: 12,959 Valid: 5,471 Spoilt: 67 Quota: 1,095 Turnout: 5,538 (42.7%) |
Coldside
- 2012: 2xSNP; 2xLab
- 2017: 2xSNP; 2xLab
- 2012-2017: No Change
| Coldside - 4 seats |
| Party | Candidate | % 1st Pref | Count 1 | Count 2 | Count 3 | Count 4 | Count 5 | Count 6 | Count 7 | Count 8 | Count 9 | Count 10 |
|
SNP |
Mark Flynn |
27.7% |
1,560 |
|
|
|
|
|
|
|
|
|
|
Labour |
George McIrvine |
16.6% |
933 |
951.4 |
959.5 |
965.4 |
974.7 |
996.08 |
1,059.9 |
1,223.9 |
|
|
|
SNP |
Anne Rendall |
16.5% |
925 |
1,252.9 |
|
|
|
|
|
|
|
|
|
Labour |
Helen Wright (incumbent) |
11.3% |
633 |
638.02 |
647.9 |
650.5 |
664.04 |
677.9 |
725.9 |
843.7 |
908.9 |
1,139.8 |
|
Conservative |
Duncan Shaw |
11.0% |
618 |
621.07 |
622.1 |
625.4 |
628.4 |
657.5 |
663.9 |
709.8 |
715.1 |
|
|
Independent |
Mohammed Asif (incumbent) |
8.6% |
481 |
495.2 |
504.07 |
505.1 |
510.3 |
529.2 |
615.8 |
|
|
|
|
Scottish Green |
Conor Marshall |
4.1% |
232 |
252.4 |
291.6 |
295.2 |
327.9 |
351.1 |
|
|
|
|
|
Liberal Democrats |
Kristopher Hall |
1.8% |
101 |
106.02 |
108.8 |
139.1 |
141.2 |
|
|
|
|
|
|
TUSC |
Wayne Scott |
1.5% |
82 |
84.8 |
90.7 |
93.9 |
|
|
|
|
|
|
|
Liberal Democrats |
Christopher McIntyre |
1.0% |
57 |
60.9 |
62.3 |
|
|
|
|
|
|
|
| Electorate: 14,262 Valid: 5,622 Spoilt: 229 Quota: 1,125 Turnout: 5,851 (41%) |
Maryfield
- 2012: 2xSNP; 1xLab
- 2017: 2xSNP; 1xLab
- 2012-2017: No change
| Maryfield - 3 seats |
| Party | Candidate | % 1st Pref | Count 1 | Count 2 | Count 3 | Count 4 | Count 5 |
|
SNP |
Ken Lynn (incumbent) |
30.3% |
1,240 |
|
|
|
|
|
Labour |
Georgia Cruickshank (incumbent) |
21.6% |
885 |
894.8 |
902.9 |
968.3 |
1,051.9 |
|
SNP |
Lynne Short (incumbent) |
19.1% |
782 |
968.2 |
972.9 |
997.4 |
1,084.3 |
|
Conservative |
James Clancy |
17.6% |
722 |
722.8 |
726.9 |
775.9 |
792.9 |
|
TUSC |
Stuart Fairweather |
6.1% |
250 |
253.3 |
253.5 |
270.8 |
|
|
Liberal Democrats |
Jenny Blain |
4.1% |
168 |
169.2 |
194.7 |
|
|
|
Liberal Democrats |
Robbie McKaig |
1.2% |
48 |
49.6 |
|
|
|
| Electorate: 12,021 Valid: 4,095 Spoilt: 89 Quota: 1,024 Turnout: 4,184 (34.8%) |
North East
- 2012: 2xSNP; 1xLab
- 2017: 2xSNP; 1xLab
- 2012-2017: No Change
East End
- 2012: 2xSNP; 1xLab
- 2017: 2xSNP; 1xLab
- 2012-2017: No Change
| East End - 3 seats |
| Party | Candidate | % 1st Pref | Count 1 | Count 2 | Count 3 | Count 4 | Count 5 | Count 6 | Count 7 | Count 8 |
|
SNP |
Will Dawson (incumbent) |
38.6% |
1,553 |
|
|
|
|
|
|
|
|
Labour |
Margaret Richardson |
24% |
965 |
982.7 |
986.5 |
993.5 |
1,004.1 |
1,047.1 |
1,089.7 |
1,177.9 |
|
SNP |
Christina Roberts (incumbent) |
20.2% |
811 |
1,144.2 |
|
|
|
|
|
|
|
Conservative |
Darren Kane |
14.2% |
571 |
575.6 |
576.2 |
585.5 |
589.5 |
619.7 |
630.3 |
677.2 |
|
Independent |
Darryl Guthrie |
5.1% |
205 |
217.3 |
219.2 |
225.3 |
237.3 |
252.6 |
303.5 |
|
|
Scottish Green |
Caitlin Meldrum |
2.8% |
113 |
124.1 |
132.1 |
133.4 |
145.5 |
165.3 |
|
|
|
Liberal Democrats |
Ryan Finnegan |
2.7% |
110 |
120.8 |
122.2 |
126.5 |
137.8 |
|
|
|
|
UKIP |
William Morren |
1.4% |
56 |
58.3 |
58.9 |
|
|
|
|
|
|
TUSC |
Ian McKay |
1.3% |
54 |
64.8 |
66.7 |
68.9 |
|
|
|
|
| Electorate: 12,113 Valid: 4,019 Spoilt: 562 Quota: 1,110 Turnout: 4,581 (37.8%) |
The Ferry
- 2012: 2xSNP; 1xCon; 1xLab
- 2017: 2xCon; 1xLib Dem; 1xSNP
- 2012-2017: Conservative & Lib Dem each gain one seat from Labour & SNP.
| The Ferry - 4 seats |
| Party | Candidate | % 1st Pref | Count 1 | Count 2 | Count 3 | Count 4 | Count 5 | Count 6 | Count 7 | Count 8 | Count 9 |
|
Conservative |
Derek Scott (incumbent) |
34.4% |
2,859 |
|
|
|
|
|
|
|
|
|
SNP |
Kevin Cordell (incumbent) |
19.3% |
1,608 |
1,616.9 |
1,618.9 |
1,622.9 |
1,684.9 |
1,809.8 |
|
|
|
|
Liberal Democrats |
Craig Duncan |
17.09% |
1,422 |
1,498.6 |
1,502.6 |
1,509.3 |
1,557.4 |
1,967.8 |
|
|
|
|
SNP |
Vari McDonald * |
12.9% |
1,075 |
1,079.5 |
1,084.5 |
1,085.5 |
1,139.8 |
1,230.6 |
1,260.8 |
1,272.8 |
|
|
Labour |
Angela Lyall |
12.7% |
1,054 |
1,079.3 |
1,093.3 |
1,097.3 |
1,139.7 |
|
|
|
|
|
Conservative |
Philip Scott |
7.6% |
635 |
1,532.9 |
1,534.6 |
1,556.5 |
1,566.4 |
1,679.9 |
1,732.6 |
1,732.7 |
2,013.7 |
|
Scottish Green |
Pol Clementsmith |
2.8% |
232 |
237.2 |
247.9 |
249.9 |
|
|
|
|
|
|
UKIP |
Calum Walker |
0.56% |
47 |
50.7 |
52.7 |
|
|
|
|
|
|
|
TUSC |
Paul Johnson |
0.52% |
43 |
44.9 |
|
|
|
|
|
|
|
| Electorate: 16,062 Valid: 8,322 Spoilt: 831 Quota: 1,796 Turnout: 9,153 (57%) |
- = Outgoing Councillor from a different ward.