Dorset County Council election, 2017
|
| |||||||||||||||||||||||||||||||||||||||||||||||||||||
| |||||||||||||||||||||||||||||||||||||||||||||||||||||
All 46 seats to Dorset County Council 24 seats needed for a majority | |||||||||||||||||||||||||||||||||||||||||||||||||||||
|---|---|---|---|---|---|---|---|---|---|---|---|---|---|---|---|---|---|---|---|---|---|---|---|---|---|---|---|---|---|---|---|---|---|---|---|---|---|---|---|---|---|---|---|---|---|---|---|---|---|---|---|---|---|
| |||||||||||||||||||||||||||||||||||||||||||||||||||||
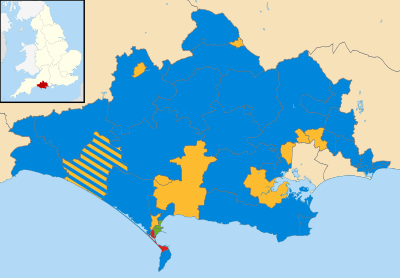 Map of the results of the 2017 Dorset council election. | |||||||||||||||||||||||||||||||||||||||||||||||||||||
| |||||||||||||||||||||||||||||||||||||||||||||||||||||
The 2017 Dorset County Council election took place on 4 May 2017 as part of the 2017 local elections in the United Kingdom.[1] All 46 councillors were elected from 40 electoral divisions, which returned either one or two county councillors each by first-past-the-post voting for a four-year term of office.
Boundary changes to the electoral divisions, saw an increase in councillors from 45 to 46 and decrease in electoral wards from 42 to 40, took effect at this election after a review of the county by the Local Government Boundary Commission for England.[2][3]
Election result summary
| Party | Seats | Gains | Losses | Net gain/loss | Seats % | Votes % | Votes | +/− | |
|---|---|---|---|---|---|---|---|---|---|
| Conservative | 32 | +5 | 69.6 | 50.3 | 66,959 | ||||
| Liberal Democrat | 11 | -1 | 23.9 | 24.9 | 33,082 | ||||
| Green | 2 | +2 | 4.3 | 5.4 | 7,146 | ||||
| Labour | 1 | -4 | 2.2 | 14.0 | 18,607 | ||||
| UKIP | 0 | -1 | - | 4.7 | 6,286 | ||||
| Independent | 0 | 0 | - | 0.8 | 1,006 | ||||
Election result by division
Beaminster
| Party | Candidate | Votes | % | ± | |
|---|---|---|---|---|---|
| Conservative | Rebecca Knox | 2,018 | |||
| Liberal Democrat | Peter James Allen | 848 | |||
| Labour | Mark Gage | 178 | |||
| Green | Neil Antony Judd | 170 | |||
| Turnout | 46.27 | ||||
| Conservative hold | Swing | ||||
Blackmore Vale
| Party | Candidate | Votes | % | ± | |
|---|---|---|---|---|---|
| Conservative | Pauline Hannah Batstone | 1,980 | |||
| Liberal Democrat | David Tibbles | 405 | |||
| UKIP | Bill Woodhouse | 209 | |||
| Labour | Robert Zachary Taylor | 185 | |||
| Turnout | 39.90 | ||||
| Conservative hold | Swing | ||||
Blandford Forum
| Party | Candidate | Votes | % | ± | |
|---|---|---|---|---|---|
| Conservative | Byron Robert Quayle | 1,086 | |||
| Liberal Democrat | Barrie George Cooper | 1,035 | |||
| Labour | Pat Osborne | 291 | |||
| UKIP | Jane Mary Unwin | 116 | |||
| Turnout | 35.10 | ||||
| Conservative gain from Liberal Democrat | Swing | ||||
Bridport
| Party | Candidate | Votes | % | ± | |
|---|---|---|---|---|---|
| Liberal Democrat | Ros Kayes | 2,490 | |||
| Conservative | Keith Day | 2,415 | |||
| Conservative | Mark Roberts | 2,244 | |||
| Liberal Democrat | Sarah Horniman | 1,840 | |||
| Green | Kevin Clayton | 810 | |||
| Labour | Phylida Culpin | 783 | |||
| Labour | Bill Mellish | 690 | |||
| Green | Robert Casey | 490 | |||
| Turnout | 42.69 | ||||
| Liberal Democrat hold | Swing | ||||
| Conservative win (new seat) | |||||
Broadwey
| Party | Candidate | Votes | % | ± | |
|---|---|---|---|---|---|
| Conservative | Kevin Brookes | 1,128 | |||
| Labour | Mark Richard Tewkesbury | 904 | |||
| Liberal Democrat | Ryan Dean Hope | 283 | |||
| Green | David Howard Smith | 168 | |||
| Turnout | 35.30 | ||||
| Conservative gain from Labour | Swing | ||||
Burton Grange
| Party | Candidate | Votes | % | ± | |
|---|---|---|---|---|---|
| Conservative | David Charles Jones | 1,374 | |||
| Liberal Democrat | Jade Bailey | 366 | |||
| Labour | Antoinette Pearce | 353 | |||
| Turnout | 27.95 | ||||
| Conservative hold | Swing | ||||
Chickerell and Chesil Bank
| Party | Candidate | Votes | % | ± | |
|---|---|---|---|---|---|
| Conservative | Jean Dunseith | 1,624 | |||
| Liberal Democrat | James Alexander Lane Canning | 348 | |||
| Labour | Lynda Ann Kiss | 283 | |||
| Green | Carol Rosemary Byrom | 226 | |||
| Turnout | 35.30 | ||||
| Conservative hold | Swing | ||||
Christchurch Central
| Party | Candidate | Votes | % | ± | |
|---|---|---|---|---|---|
| Conservative | Peter Roger Alexander Hall | 1,707 | |||
| Labour | Julian Spurr | 578 | |||
| Turnout | 30.58 | ||||
| Conservative hold | Swing | ||||
Colehill East and Stapehill
| Party | Candidate | Votes | % | ± | |
|---|---|---|---|---|---|
| Liberal Democrat | Janet Dover | 1,342 | |||
| Conservative | KD Johnson | 1,100 | |||
| UKIP | Paul Graham | 217 | |||
| Labour | Ashley Wynne Rowlands | 146 | |||
| Turnout | |||||
| Liberal Democrat hold | Swing | ||||
Colehill West and Wimborne Minster
| Party | Candidate | Votes | % | ± | |
|---|---|---|---|---|---|
| Liberal Democrat | Shane Bartlett | 1,190 | |||
| Conservative | Robin David Cook | 1,154 | |||
| Labour | Chris Brown | 574 | |||
| UKIP | Nick Wellstead | 147 | |||
| Turnout | 42.38 | ||||
| Liberal Democrat win (new seat) | |||||
Commons
| Party | Candidate | Votes | % | ± | |
|---|---|---|---|---|---|
| Conservative | Margaret Phipps | 1,789 | |||
| Liberal Democrat | Fiona Cox | 467 | |||
| Labour | Peter Stokes | 389 | |||
| Turnout | 32.03 | ||||
| Conservative hold | Swing | ||||
Corfe Mullen
| Party | Candidate | Votes | % | ± | |
|---|---|---|---|---|---|
| Liberal Democrat | Susan Jefferies | 1,603 | |||
| Conservative | Paul Ronald Harrison | 1,300 | |||
| Labour | David Peden | 127 | |||
| UKIP | David Ewart Mattocks | 106 | |||
| Turnout | 39.32 | ||||
| Liberal Democrat hold | Swing | ||||
Cranborne Chase
| Party | Candidate | Votes | % | ± | |
|---|---|---|---|---|---|
| Conservative | Steve Butler | 1,773 | |||
| Labour | Joanne Margaret Scotton | 442 | |||
| UKIP | Cyril John Barnes | 148 | |||
| Turnout | 35.58 | ||||
| Conservative hold | Swing | ||||
Dorchester
| Party | Candidate | Votes | % | ± | |
|---|---|---|---|---|---|
| Liberal Democrat | Andy Canning | 2,871 | |||
| Liberal Democrat | Richard Martin Biggs | 2,799 | |||
| Conservative | Gerald Duke | 1,781 | |||
| Conservative | Ian Francois Bernard Gosling | 1,730 | |||
| Labour | Claudia Catherine Sorin | 983 | |||
| Labour | Barry Thompson | 775 | |||
| Green | Vicki Black | 581 | |||
| UKIP | Geoffrey Robin Markham | 311 | |||
| Green | Ken Huggins | 265 | |||
| Turnout | 39.24 | ||||
| Liberal Democrat hold | Swing | ||||
| Liberal Democrat hold | Swing | ||||
Ferndown
| Party | Candidate | Votes | % | ± | |
|---|---|---|---|---|---|
| Conservative | Steven Michael Lugg | 3,090 | |||
| Conservative | Andrew Charles Parry | 2,950 | |||
| UKIP | Lawrence Leslie Ralph Wilson | 795 | |||
| UKIP | Peter Jonathan Lucas | 657 | |||
| Liberal Democrat | Michael Francis Cox | 508 | |||
| Liberal Democrat | Jason Jones | 429 | |||
| Labour | David Munnik | 244 | |||
| Labour | Ian R Wands | 203 | |||
| Turnout | 32.52 | ||||
| Conservative hold | Swing | ||||
| Conservative hold | Swing | ||||
Gillingham
| Party | Candidate | Votes | % | ± | |
|---|---|---|---|---|---|
| Conservative | David Walsh | 2,675 | |||
| Conservative | Andrew Ronald Cattaway | 2,368 | |||
| Liberal Democrat | Barry Von Clemens | 1,252 | |||
| Liberal Democrat | Graeme Henry Hole | 802 | |||
| Labour | Geoff Longcroft | 414 | |||
| UKIP | Peter Caulfield | 409 | |||
| UKIP | Steve Unwin | 348 | |||
| Labour | Clive Edward Struver | 344 | |||
| Turnout | 37.50 | ||||
| Conservative hold | Swing | ||||
| Conservative win (new seat) | |||||
Hambledon
| Party | Candidate | Votes | % | ± | |
|---|---|---|---|---|---|
| Conservative | Deborah Croney | 1,841 | |||
| Liberal Democrat | Martin Thomas Strange | 488 | |||
| Labour | Keith Yarwood | 221 | |||
| UKIP | Robert Michael Snow | 178 | |||
| Turnout | 35.48 | ||||
| Conservative hold | Swing | ||||
Linden Lea
| Party | Candidate | Votes | % | ± | |
|---|---|---|---|---|---|
| Liberal Democrat | Nick Ireland | 1,317 | |||
| Conservative | Peter Jonathon Stein | 1,299 | |||
| Labour | Richard Michael Shrubb | 198 | |||
| Green | Rebekah Webb | 127 | |||
| Turnout | 41.60 | ||||
| Liberal Democrat hold | Swing | ||||
Lodmoor
| Party | Candidate | Votes | % | ± | |
|---|---|---|---|---|---|
| Conservative | Anthony Ferrari | 1,702 | |||
| Liberal Democrat | David George Mannings | 1,083 | |||
| Labour | Thomas Taylor | 392 | |||
| Green | Brian Heatley | 183 | |||
| Turnout | 46.20 | ||||
| Conservative gain from Liberal Democrat | Swing | ||||
Lytchett Minster and Upton
| Party | Candidate | Votes | % | ± | |
|---|---|---|---|---|---|
| Conservative | Bill Pipe | 1,049 | |||
| Liberal Democrat | Fred Drane | 944 | |||
| UKIP | Mike Fry | 237 | |||
| Labour | Richard Douglas Jordan | 154 | |||
| Turnout | 35.70 | ||||
| Conservative win (new seat) | |||||
Marshwood Vale
| Party | Candidate | Votes | % | ± | |
|---|---|---|---|---|---|
| Conservative | Daryl Turner | 1,730 | |||
| Liberal Democrat | Steve Trevethan | 538 | |||
| Labour | Joy Everington | 284 | |||
| Green | Chit Chong | 263 | |||
| Turnout | 40.83 | ||||
| Conservative hold | Swing | ||||
Moors
| Party | Candidate | Votes | % | ± | |
|---|---|---|---|---|---|
| Conservative | Bray Ryan | 3,743 | |||
| Conservative | David William Shortell | 3,662 | |||
| UKIP | Robin Grey | 776 | |||
| Liberal Democrat | Lily Cox | 657 | |||
| Labour | Sandra Joy Turner | 460 | |||
| Labour | Heather Jean Snow | 367 | |||
| Turnout | |||||
| Conservative win (new seat) | |||||
| Conservative win (new seat) | |||||
Mudeford and Highcliffe
| Party | Candidate | Votes | % | ± | |
|---|---|---|---|---|---|
| Conservative | Lesley Margaret Dedman | 2,582 | |||
| Labour | Carol Ann Wilcox | 557 | |||
| Turnout | 40.04 | ||||
| Conservative hold | Swing | ||||
North West Purbeck
| Party | Candidate | Votes | % | ± | |
|---|---|---|---|---|---|
| Conservative | Peter Kendrick Wharf | 1,654 | |||
| Liberal Democrat | John Brian Taylor | 890 | |||
| Labour | Stewart Bullen | 141 | |||
| UKIP | Josephine Marie Evans | 123 | |||
| Turnout | 40.40 | ||||
| Conservative win (new seat) | |||||
Portland Harbour
| Party | Candidate | Votes | % | ± | |
|---|---|---|---|---|---|
| Labour Co-op | Kate Wheller | 1,282 | |||
| Conservative | Kerry Leanne Baker | 879 | |||
| Green | Len Herbert | 145 | |||
| Turnout | 33.50 | ||||
| Labour Co-op hold | Swing | ||||
Portland Tophill
| Party | Candidate | Votes | % | ± | |
|---|---|---|---|---|---|
| Conservative | Katherine Muriel Garcia | 995 | |||
| Labour Co-op | Paul Ralph Kimber | 923 | |||
| Green | Claudia Lucienne Moore | 149 | |||
| Turnout | 32.20 | ||||
| Conservative gain from Labour Co-op | Swing | ||||
Rodwell
| Party | Candidate | Votes | % | ± | |
|---|---|---|---|---|---|
| Green | Clare Sutton | 1,474 | |||
| Conservative | David Leslie Hastings | 901 | |||
| Labour | Matthew John Hall | 514 | |||
| UKIP | Jill Ann Hordle | 195 | |||
| Turnout | 41.00 | ||||
| Green hold | Swing | ||||
Shaftesbury
| Party | Candidate | Votes | % | ± | |
|---|---|---|---|---|---|
| Liberal Democrat | Derek Leslie Beer | 1,231 | |||
| Conservative | Piers Brown | 863 | |||
| UKIP | Lester Geoffrey Taylor | 181 | |||
| Labour | Ursula Louise Ann Osborne | 114 | |||
| Independent | Lester Mark Dibben | 100 | |||
| Turnout | 38.65 | ||||
| Liberal Democrat hold | Swing | ||||
Sherborne Rural
| Party | Candidate | Votes | % | ± | |
|---|---|---|---|---|---|
| Conservative | Mary Penfold | 1,657 | |||
| Liberal Democrat | Matt Hall | 1,535 | |||
| Green | Andrew Martin Spring | 130 | |||
| Turnout | 47.25 | ||||
| Conservative gain from Liberal Democrat | Swing | ||||
Sherborne Town
| Party | Candidate | Votes | % | ± | |
|---|---|---|---|---|---|
| Liberal Democrat | Jon Andrews | 1,493 | |||
| Conservative | Robert Andrew Gould | 1,471 | |||
| Labour | Nick Boothroyd | 126 | |||
| Green | Pam Rosling | 103 | |||
| Turnout | 45.57 | ||||
| Liberal Democrat gain from Conservative | Swing | ||||
South Purbeck
| Party | Candidate | Votes | % | ± | |
|---|---|---|---|---|---|
| Conservative | Cherry Louise Brooks | 1,135 | |||
| Independent | Nigel Dragon | 766 | |||
| Liberal Democrat | Graham Holmes | 666 | |||
| Labour | Leigh Van De Zande | 205 | |||
| Turnout | 40.90 | ||||
| Conservative win (new seat) | |||||
Stalbridge and The Beacon
| Party | Candidate | Votes | % | ± | |
|---|---|---|---|---|---|
| Conservative | Graham Carr-Jones | 1,879 | |||
| Liberal Democrat | Dorothy Jane Webb | 424 | |||
| UKIP | Rory Herbert | 235 | |||
| Labour | Richard George Harvey | 203 | |||
| Turnout | 39.68 | ||||
| Conservative win (new seat) | |||||
Swanage
| Party | Candidate | Votes | % | ± | |
|---|---|---|---|---|---|
| Conservative | William Stanley Trite | 1,856 | |||
| Labour | Cherry Ann Bartlett | 679 | |||
| Liberal Democrat | Gill Calvin–Thomas | 540 | |||
| Independent | Jason Paul Haiselden | 140 | |||
| Turnout | 40.60 | ||||
| Conservative hold | Swing | ||||
Three Valleys
| Party | Candidate | Votes | % | ± | |
|---|---|---|---|---|---|
| Conservative | Jill Haynes | 1,853 | |||
| Liberal Democrat | David Taylor | 720 | |||
| Green | Peter John Barton | 349 | |||
| Labour | Janine Miller | 301 | |||
| Turnout | 39.28 | ||||
| Conservative hold | Swing | ||||
Verwood
| Party | Candidate | Votes | % | ± | |
|---|---|---|---|---|---|
| Conservative | Toni Bartley Coombs | 3,160 | |||
| Conservative | Spencer Grant Flower | 2,878 | |||
| Liberal Democrat | David Lawrence Tooke | 820 | |||
| Green | Kate Bisson | 545 | |||
| UKIP | John Baxter | 527 | |||
| Labour | Christopher John Archibold | 387 | |||
| Labour | Peter Thomas Parsons | 276 | |||
| Turnout | 33.15 | ||||
| Conservative hold | Swing | ||||
| Conservative hold | Swing | ||||
Walkford
| Party | Candidate | Votes | % | ± | |
|---|---|---|---|---|---|
| Conservative | Colin Jamieson | 2,186 | |||
| Labour | Lindsay Turner | 516 | |||
| Turnout | 34.81 | ||||
| Conservative win (new seat) | |||||
Wareham
| Party | Candidate | Votes | % | ± | |
|---|---|---|---|---|---|
| Liberal Democrat | Beryl Rita Ezzard | 1,778 | |||
| Conservative | Laura Jane Miller | 1,234 | |||
| Labour | Roy Holliday | 185 | |||
| UKIP | Keith Allen Simpson | 165 | |||
| Turnout | 44.80 | ||||
| Liberal Democrat hold | Swing | ||||
Westham
| Party | Candidate | Votes | % | ± | |
|---|---|---|---|---|---|
| Liberal Democrat | David Best Harris | 1,155 | |||
| Conservative | Shenis Cant | 791 | |||
| Labour | Kieron Womble | 488 | |||
| Green | James Robert Askew | 158 | |||
| Turnout | 35.80 | ||||
| Liberal Democrat hold | Swing | ||||
Weymouth Town
| Party | Candidate | Votes | % | ± | |
|---|---|---|---|---|---|
| Green | Jon Orrell | 810 | |||
| Conservative | Jason Louis Osborne | 698 | |||
| Labour | Ann Linda Rosina Weaving | 464 | |||
| Liberal Democrat | Christine Mary James | 387 | |||
| UKIP | Francis George Drake | 206 | |||
| Turnout | 35.40 | ||||
| Green gain from Labour | Swing | ||||
Winterborne
| Party | Candidate | Votes | % | ± | |
|---|---|---|---|---|---|
| Conservative | Hilary Ann Cox | 1,527 | |||
| Liberal Democrat | David Charles Thomas Fox | 506 | |||
| Labour | Haydn Roger White | 284 | |||
| Turnout | 36.01 | ||||
| Conservative hold | Swing | ||||
References
- ↑ "Upcoming elections & referendums". Electoral Commission. Retrieved 16 September 2016.
- ↑ "The Dorset (Electoral Changes) Order 2016". legislation.gov.uk. Retrieved 16 September 2016.
- ↑ "Dorset County Council". Local Government Boundary Commission for England. Retrieved 16 September 2016.
| Dorset County Council | |
|---|---|
| Bournemouth Borough Council | |
| Christchurch Borough Council | |
| East Dorset District Council | |
| North Dorset District Council |
|
| Poole Borough Council | |
| Purbeck District Council | |
| West Dorset District Council | |
| Weymouth and Portland Borough Council | |
| |
This article is issued from
Wikipedia.
The text is licensed under Creative Commons - Attribution - Sharealike.
Additional terms may apply for the media files.