Cumbria County Council election, 2017
|
| |||||||||||||||||||||||||||||||||||||
| |||||||||||||||||||||||||||||||||||||
All 84 seats to Cumbria County Council 43 seats needed for a majority | |||||||||||||||||||||||||||||||||||||
|---|---|---|---|---|---|---|---|---|---|---|---|---|---|---|---|---|---|---|---|---|---|---|---|---|---|---|---|---|---|---|---|---|---|---|---|---|---|
| |||||||||||||||||||||||||||||||||||||
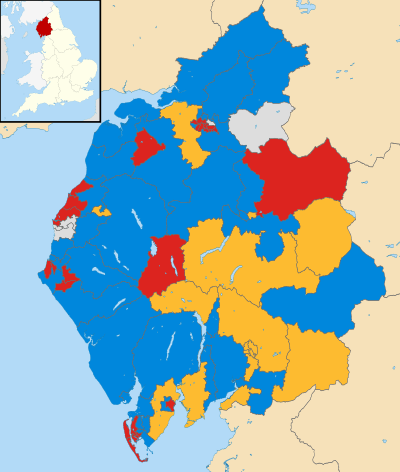 Map showing the results of the 2017 Cumbria County Council elections. | |||||||||||||||||||||||||||||||||||||
| |||||||||||||||||||||||||||||||||||||
The 2017 Cumbria County Council election took place on 4 May 2017 as part of the 2017 local elections in the United Kingdom.[1] All 84 councillors were elected from electoral divisions which return one county councillor each by first-past-the-post voting for a four-year term of office.
Result summary
| Party | Seats | Gains | Losses | Net gain/loss | Seats % | Votes % | Votes | +/− | |
|---|---|---|---|---|---|---|---|---|---|
| Conservative | 37 | 14 | 2 | +12 | 44.0 | 44.3 | 62,696 | +13.1 | |
| Labour | 26 | 2 | 12 | -10 | 31.0 | 26.3 | 32,276 | -2.0 | |
| Liberal Democrat | 16 | 3 | 2 | +1 | 19.0 | 17.9 | 25,308 | -0.1 | |
| Independent | 5 | 1 | 3 | -2 | 6.0 | 5,5 | 7,797 | -0.9 | |
| Green | 0 | - | - | - | - | 4,0 | 5,632 | +1.8 | |
| UKIP | 0 | - | - | - | - | 2,0 | 2,791 | -9.7 | |
Results by electoral division
Allerdale District
(16 seats, 16 electoral divisions)
| Allerdale District | |||||||||||||||
|---|---|---|---|---|---|---|---|---|---|---|---|---|---|---|---|
| Party | Candidates | Votes | |||||||||||||
| Stood | Elected | Gained | Unseated | Net | % of total | % | № | Net % | |||||||
| Conservative | 16 | 6 | 1 | 1 | 0 | 38.7 | 10,381 | ||||||||
| Labour | 15 | 6 | 1 | 2 | -1 | 35.0 | 9,379 | ||||||||
| Independent | 4 | 3 | 1 | 0 | 1 | 10.0 | 2,689 | ||||||||
| Liberal Democrat | 5 | 1 | 1 | 0 | 1 | 6.6 | 1,767 | ||||||||
| Green | 14 | 0 | 0 | 0 | 0 | 6.4 | 1,724 | - | |||||||
| UKIP | 3 | 0 | 0 | 0 | 0 | 3.6 | 969 | ||||||||
Aspatria
| Party | Candidate | Votes | % | ± | |
|---|---|---|---|---|---|
| Conservative | Jim Lister | 593 | 39.3 | +1.1 | |
| Liberal Democrat | Phil Roberts | 548 | 36.4 | +33.5 | |
| Labour | Gregory Peter Kendall | 262 | 17.4 | -6.7 | |
| UKIP | David Wilson | 211 | 6.7 | n/a | |
| Turnout | 1,507 | 36.5 | +6.5 | ||
| Conservative hold | Swing | ||||
Bothel and Wharrels
| Party | Candidate | Votes | % | ± | |
|---|---|---|---|---|---|
| Conservative | Alan Bowness | 1,235 | 66.4 | +5.8 | |
| Green | Jill Perry | 615 | 33.1 | +12.2 | |
| Turnout | 1,860 | 45.7 | +8.1 | ||
| Conservative hold | Swing | ||||
Cockermouth North
| Party | Candidate | Votes | % | ± | |
|---|---|---|---|---|---|
| Liberal Democrat | Rebecca Charlotte Hanson | 811 | 39.8 | +34.3 | |
| Conservative | Peter Andrew Hardie Nicholson | 609 | 29.9 | -14.7 | |
| Labour | Isabel Jeanette Burns | 546 | 26.8 | -12.2 | |
| Green | Flic Crowley | 70 | 3.4 | -6.4 | |
| Turnout | 2,040 | 40.4 | +7.0 | ||
| Liberal Democrat gain from Conservative | Swing | ||||
Cockermouth South
| Party | Candidate | Votes | % | ± | |
|---|---|---|---|---|---|
| Conservative | Alan Kennon | 1,117 | 56.2 | +22.7 | |
| Labour | Andrew Irving Semple | 579 | 29.1 | +7.2 | |
| Liberal Democrat | Roger Peck | 204 | 10.3 | -13.0 | |
| Green | Jane Christine Roy | 86 | 4.3 | -1.8 | |
| Turnout | 1,989 | 43.5 | +5.4 | ||
| Conservative hold | Swing | ||||
Dearham and Broughton
| Party | Candidate | Votes | % | ± | |
|---|---|---|---|---|---|
| Conservative | Hugo George Greenbank Graham | 805 | 48.9 | +17.0 | |
| Labour | Alan Clark | 641 | 38.9 | +2.4 | |
| UKIP | Richard Mawdsley | 112 | 6.8 | -14.6 | |
| Green | Helen Hilda Smith | 85 | 5.2 | +1.9 | |
| Turnout | 1,646 | 36.1 | +1.0 | ||
| Conservative gain from Labour | Swing | ||||
Harrington
| Party | Candidate | Votes | % | ± | |
|---|---|---|---|---|---|
| Independent | Marjorie Rae | 613 | 46.7 | -4.8 | |
| Labour | Janet Mary King | 425 | 32.4 | +7.7 | |
| Conservative | Neville John Lishman | 189 | 14.4 | n/a | |
| Liberal Democrat | Reece Fleming | 84 | 6.4 | +4.5 | |
| Turnout | 1,313 | 29.1 | -2.3 | ||
| Independent hold | Swing | ||||
Keswick
| Party | Candidate | Votes | % | ± | |
|---|---|---|---|---|---|
| Labour | Tony Lywood | 933 | 51.5 | +39.0 | |
| Conservative | Ronald Munby | 608 | 33.6 | +17.0 | |
| Green | Jack Frederick Lenox | 268 | 14.8 | +7.7 | |
| Turnout | 1,811 | 42.4 | +8.1 | ||
| Labour gain from Independent | Swing | ||||
Maryport North
| Party | Candidate | Votes | % | ± | |
|---|---|---|---|---|---|
| Labour | Carni McCarron-Holmes | 663 | 38.6 | +4.9 | |
| UKIP | George Masterton Kemp | 646 | 37.6 | +27.7 | |
| Conservative | Sarah Jane Pagan | 318 | 18.5 | +13.3 | |
| Green | Clare Brown | 86 | 5.0 | +0.7 | |
| Turnout | 1,719 | 35.1 | -4.6 | ||
| Labour hold | Swing | ||||
Maryport South
| Party | Candidate | Votes | % | ± | |
|---|---|---|---|---|---|
| Labour | Keith Anthony Little | 983 | 72.7 | +27.8 | |
| Conservative | Antony Armstrong Todd | 285 | 21.1 | +18.0 | |
| Green | Laura Rumney | 84 | 6.2 | +5.1 | |
| Turnout | 1,353 | 29.5 | -10.3 | ||
| Labour hold | Swing | ||||
Moss Bay and Moorclose
| Party | Candidate | Votes | % | ± | |
|---|---|---|---|---|---|
| Independent | Stephen Stoddart | 847 | 55.1 | +8.4 | |
| Labour | Barbara Ann Cannon | 484 | 31.5 | -16.5 | |
| Conservative | Louise Mary Donnelly | 188 | 12.2 | +7.5 | |
| Green | Douglas Maw | 17 | 1.1 | n/a | |
| Turnout | 1,538 | 32.5 | +2.1 | ||
| Independent gain from Labour | Swing | ||||
Seaton
| Party | Candidate | Votes | % | ± | |
|---|---|---|---|---|---|
| Labour | Celia Tibble | 755 | 48.4 | +1.6 | |
| Conservative | Mark Ian Jenkinson | 727 | 46.6 | +38.6 | |
| Green | Alistair John Grey | 74 | 4.7 | n/a | |
| Turnout | 1,560 | 33.5 | |||
| Labour hold | Swing | ||||
Solway Coast
| Party | Candidate | Votes | % | ± | |
|---|---|---|---|---|---|
| Conservative | Tony Markley | 884 | 50.3 | -3.2 | |
| Independent | John Cook | 525 | 29.9 | n/a | |
| Labour | Caroline Richardson | 274 | 15.6 | -1.5 | |
| Green | Richard Clive Rawson | 70 | 4.0 | -1.7 | |
| Turnout | 1,758 | 41.2 | +4.6 | ||
| Conservative hold | Swing | ||||
St John's and Great Clifton
| Party | Candidate | Votes | % | ± | |
|---|---|---|---|---|---|
| Independent | Joe Holliday | 704 | 40.0 | -3.3 | |
| Labour | Anthony David McGuckin | 635 | 36.1 | +9.3 | |
| Conservative | Ann Vipond McKerrell | 369 | 21.0 | n/a | |
| Green | Fliss Watts | 52 | 3.0 | +0.7 | |
| Turnout | 1,761 | 34.7 | +1.7 | ||
| Independent hold | Swing | ||||
St Michael's
| Party | Candidate | Votes | % | ± | |
|---|---|---|---|---|---|
| Labour | Alan Lawrence Barry | 798 | 64.4 | +13.3 | |
| Conservative | Gladys Wilson | 277 | 22.3 | +15.8 | |
| Liberal Democrat | Margaret Bennett | 120 | 9.8 | n/a | |
| Green | Peter George Rowland Rigg | 36 | 2.9 | +0.4 | |
| Turnout | 1,240 | 27.9 | -0.6 | ||
| Labour hold | Swing | ||||
Thursby
| Party | Candidate | Votes | % | ± | |
|---|---|---|---|---|---|
| Conservative | Duncan Stewart Fairbairn | 1,294 | 72.9 | +4.9 | |
| Labour | Bill Goldsmith | 343 | 19.3 | +1.7 | |
| Green | Dianne Estelle Standen | 128 | 7.2 | +0.2 | |
| Turnout | 1,776 | 42.4 | +8.6 | ||
| Conservative hold | Swing | ||||
Wigton
| Party | Candidate | Votes | % | ± | |
|---|---|---|---|---|---|
| Labour | Roger John Liddle | 1,058 | 53.0 | +14.7 | |
| Conservative | Malcolm Grainger | 883 | 44.2 | +14.1 | |
| Green | Patricia Anne Ackred | 53 | 2.7 | -0.6 | |
| Turnout | 1,998 | 38.3 | +5.0 | ||
| Labour hold | Swing | ||||
Barrow-in-Furness
| Barrow-in-Furness District | |||||||||||||||
|---|---|---|---|---|---|---|---|---|---|---|---|---|---|---|---|
| Party | Candidates | Votes | |||||||||||||
| Stood | Elected | Gained | Unseated | Net | % of total | % | № | Net % | |||||||
| Labour | 11 | 6 | 0 | 4 | -4 | 39.5 | 5,712 | ||||||||
| Conservative | 11 | 5 | 4 | 0 | 4 | 46.5 | 6,715 | ||||||||
| UKIP | 6 | 0 | 0 | 0 | 0 | 5.1 | 739 | ||||||||
| Independent | 1 | 0 | 0 | 0 | 0 | 1.0 | 148 | ||||||||
| Liberal Democrat | 1 | 0 | 0 | 0 | 0 | 0.4 | 63 | ||||||||
Dalton North
| Party | Candidate | Votes | % | ± | |
|---|---|---|---|---|---|
| Conservative | Ben Shirley | 884 | 55.2 | +31.2 | |
| Labour | Barry Doughty | 569 | 35.5 | -17.1 | |
| Independent | Glen David Higgins | 148 | 9.2 | n/a | |
| Turnout | 1,602 | 32.3 | +8.9 | ||
| Conservative gain from Labour | Swing | ||||
Dalton South
| Party | Candidate | Votes | % | ± | |
|---|---|---|---|---|---|
| Conservative | Des English | 683 | 49.7 | +24.7 | |
| Labour | Ernie Wilson | 508 | 37.0 | -10.9 | |
| UKIP | Dick Young | 115 | 8.4 | -12.8 | |
| Liberal Democrat | Raymond George Beecham | 63 | 4.6 | n/a | |
| Turnout | 1,373 | 28.4 | +5.5 | ||
| Conservative gain from Labour | Swing | ||||
Hawcoat
| Party | Candidate | Votes | % | ± | |
|---|---|---|---|---|---|
| Conservative | Roy Worthington | 1,245 | 74.1 | +20.4 | |
| Labour | Connor James Lambton | 429 | 25.5 | +2.4 | |
| Turnout | 1,681 | 35.1 | +7.0 | ||
| Conservative hold | Swing | ||||
Hindpool
| Party | Candidate | Votes | % | ± | |
|---|---|---|---|---|---|
| Labour | Anne Burns | 714 | 62.0 | -5.8 | |
| Conservative | Anne Denise English | 300 | 26.0 | +12.3 | |
| UKIP | Dave Roberts | 136 | 11.8 | -5.8 | |
| Turnout | 1,152 | 22.9 | +3.5 | ||
| Labour hold | Swing | ||||
Newbarns and Parkside
| Party | Candidate | Votes | % | ± | |
|---|---|---|---|---|---|
| Conservative | Sol Wielkopolski | 683 | 49.6 | +24.9 | |
| Labour | John Murphy | 600 | 43.5 | -3.1 | |
| UKIP | Karl Darrell Hunt | 90 | 6.5 | -16.3 | |
| Turnout | 1,378 | 26.7 | +3.2 | ||
| Conservative gain from Labour | Swing | ||||
Old Barrow
| Party | Candidate | Votes | % | ± | |
|---|---|---|---|---|---|
| Labour | Helen Wall | 577 | 60.0 | -9.1 | |
| Conservative | Brenda Joyce Lauderdale | 290 | 30.1 | n/a | |
| UKIP | Colin John Rudd | 94 | 9.8 | -20.2 | |
| Turnout | 962 | 19.9 | +1.9 | ||
| Labour hold | Swing | ||||
Ormsgill
| Party | Candidate | Votes | % | ± | |
|---|---|---|---|---|---|
| Labour | Bill McEwan | 660 | 51.7 | +2.1 | |
| Conservative | Terri-Anne Gibney | 398 | 31.2 | +17.9 | |
| UKIP | Theresa Marie McMeekin | 216 | 16.9 | +2.6 | |
| Turnout | 1,277 | 25.2 | +2.9 | ||
| Labour hold | Swing | ||||
Risedale
| Party | Candidate | Votes | % | ± | |
|---|---|---|---|---|---|
| Labour | Kevin Robert Hamilton | 667 | 63.2 | +1.4 | |
| Conservative | Jamie Samson | 382 | 36.2 | +25.8 | |
| Turnout | 1,055 | 23.0 | +2.5 | ||
| Labour hold | Swing | ||||
Roosecote
| Party | Candidate | Votes | % | ± | |
|---|---|---|---|---|---|
| Conservative | Derek Gawne | 898 | 56.4 | +21.3 | |
| Labour | Fred Chatfield | 606 | 38.0 | -9.6 | |
| UKIP | Pete Richards | 88 | 5.5 | -11.7 | |
| Turnout | 1,593 | 30.6 | -0.9 | ||
| Conservative gain from Labour | Swing | ||||
Walney North
| Party | Candidate | Votes | % | ± | |
|---|---|---|---|---|---|
| Labour | Mel Worth | 720 | 63.4 | -7.6 | |
| Conservative | Martin David McLeavy | 413 | 36.4 | n/a | |
| Turnout | 1,135 | 26.0 | 0.0 | ||
| Labour hold | Swing | ||||
Walney South
| Party | Candidate | Votes | % | ± | |
|---|---|---|---|---|---|
| Labour | Frank Cassidy | 739 | 57.7 | -5.6 | |
| Conservative | Rory McClure | 539 | 42.1 | +21.1 | |
| Turnout | 1,280 | 30.5 | +4.5 | ||
| Labour hold | Swing | ||||
Carlisle
| Carlisle District | |||||||||||||||
|---|---|---|---|---|---|---|---|---|---|---|---|---|---|---|---|
| Party | Candidates | Votes | |||||||||||||
| Stood | Elected | Gained | Unseated | Net | % of total | % | № | Net % | |||||||
| Labour | 17 | 8 | 0 | 1 | -1 | 32.1 | 9,106 | ||||||||
| Conservative | 18 | 7 | 2 | 0 | 2 | 44.9 | 12,733 | ||||||||
| Independent | 5 | 2 | 0 | 1 | -1 | 8.4 | 2,384 | ||||||||
| Liberal Democrat | 8 | 1 | 0 | 0 | 0 | 7.6 | 2,168 | ||||||||
| Green | 13 | 0 | 0 | 0 | 0 | 3.8 | 1,084 | ||||||||
| UKIP | 9 | 0 | 0 | 0 | 0 | 3.1 | 868 | ||||||||
Belah
| Party | Candidate | Votes | % | ± | |
|---|---|---|---|---|---|
| Conservative | Gareth Michael Ellis | 951 | 48.1 | +2.1 | |
| Labour | Paul Leslie Birks | 538 | 27.2 | +0.8 | |
| Independent | Alan Toole | 478 | 24.2 | n/a | |
| Turnout | 1,978 | 41.5 | +5.7 | ||
| Conservative gain from Independent | Swing | ||||
Belle Vue
| Party | Candidate | Votes | % | ± | |
|---|---|---|---|---|---|
| Labour | Christine Bowditch | 742 | 46.0 | -19.0 | |
| Conservative | Geoffrey Osbourne | 722 | 44.8 | +11.2 | |
| UKIP | Susan Riley | 91 | 5.6 | n/a | |
| Green | Helen Elizabeth Atkinson | 52 | 3.2 | n/a | |
| Turnout | 1,612 | 35.7 | +11.2 | ||
| Labour hold | Swing | ||||
Botcherby
| Party | Candidate | Votes | % | ± | |
|---|---|---|---|---|---|
| Independent | Robert William Betton | 807 | 49.9 | +11.3 | |
| Labour | Helen Anne Fisher | 431 | 26.7 | -1.7 | |
| Conservative | Paul Nedved | 337 | 20.8 | +1.5 | |
| Green | Deb Brown | 40 | 2.5 | n/a | |
| Turnout | 1,617 | 37.0 | +7.3 | ||
| Independent hold | Swing | ||||
Brampton
| Party | Candidate | Votes | % | ± | |
|---|---|---|---|---|---|
| Conservative | Lawrence Fisher | 860 | 55.4 | +7.0 | |
| Labour | Lesley Begley | 321 | 20.7 | -3.1 | |
| Liberal Democrat | Olwyn Doreen Luckley | 135 | 8.7 | +2.5 | |
| Green | Colin Luhrs | 126 | 8.1 | n/a | |
| UKIP | John James Harding | 107 | 6.9 | -15.2 | |
| Turnout | 1,553 | 37.1 | +7.9 | ||
| Conservative hold | Swing | ||||
Castle
| Party | Candidate | Votes | % | ± | |
|---|---|---|---|---|---|
| Labour | Alan Robert McGuckin | 469 | 43.3 | +2.8 | |
| Conservative | James Bainbridge | 364 | 33.6 | +23.0 | |
| Liberal Democrat | David John Wood | 117 | 10.8 | -12.3 | |
| UKIP | Robbie Reid-Sinclair | 77 | 7.1 | -12.9 | |
| Green | Richard Sebastian Hunt | 53 | 4.9 | +0.9 | |
| Turnout | 1,084 | 28.0 | +4.4 | ||
| Labour hold | Swing | ||||
Corby and Hayton
| Party | Candidate | Votes | % | ± | |
|---|---|---|---|---|---|
| Independent | William James Graham | 830 | 47.6 | -25.4 | |
| Conservative | Keith Meller | 608 | 34.9 | +8.6 | |
| Liberal Democrat | Alison Elizabeth Hobson | 177 | 10.2 | n/a | |
| Green | Charmian Jess McCutcheon | 124 | 7.1 | n/a | |
| Turnout | 1,742 | 46.3 | +8.9 | ||
| Independent hold | Swing | ||||
Currock
| Party | Candidate | Votes | % | ± | |
|---|---|---|---|---|---|
| Labour | Reg Watson | 562 | 54.4 | +1.4 | |
| Conservative | Geoff Mitchell | 309 | 29.9 | +15.1 | |
| Independent | Jeffrey Bomford | 96 | 9.3 | n/a | |
| Green | Sky Fiona Higgins | 64 | 6.2 | -2.8 | |
| Turnout | 1,033 | 24.5 | +3.5 | ||
| Labour hold | Swing | ||||
Dalston and Burgh
| Party | Candidate | Votes | % | ± | |
|---|---|---|---|---|---|
| Liberal Democrat | Trevor Allison | 1,048 | 46.8 | +7.6 | |
| Conservative | Katharine Oliver | 936 | 41.8 | +9.4 | |
| Labour | Ray Warwick | 248 | 11.1 | -1.8 | |
| Turnout | 2,239 | 42.8 | +4.7 | ||
| Liberal Democrat hold | Swing | ||||
Denton Holme
| Party | Candidate | Votes | % | ± | |
|---|---|---|---|---|---|
| Labour | Hugh McDevitt | 800 | 59.9 | +3.4 | |
| Conservative | Syed Ali | 360 | 26.9 | +15.2 | |
| Green | Neil Boothman | 93 | 7.0 | -1.3 | |
| UKIP | Kerryanne Mckay Wilde | 80 | 6.0 | -12.8 | |
| Turnout | 1,336 | 29.9 | +4.7 | ||
| Labour hold | Swing | ||||
Harraby North
| Party | Candidate | Votes | % | ± | |
|---|---|---|---|---|---|
| Labour | Cyril Frederick Weber | 737 | 66.5 | +2.1 | |
| Conservative | Barbara Eden | 358 | 32.3 | +20.4 | |
| Turnout | 1,108 | 25.2 | +1.5 | ||
| Labour hold | Swing | ||||
Harraby South
| Party | Candidate | Votes | % | ± | |
|---|---|---|---|---|---|
| Labour | Deborah Anne Earl | 671 | 44.7 | +0.4 | |
| Conservative | Michael Randall | 655 | 43.6 | +16.7 | |
| Independent | Jack Paton | 173 | 11.5 | n/a | |
| Turnout | 1,501 | 36.8 | +8.2 | ||
| Labour hold | Swing | ||||
Houghton and Irthington
| Party | Candidate | Votes | % | ± | |
|---|---|---|---|---|---|
| Conservative | John Mallinson | 1,112 | 65.5 | +13.1 | |
| Labour | Maggie Robinson | 262 | 15.4 | -3.7 | |
| Liberal Democrat | Brendan Murphy | 140 | 8.2 | n/a | |
| UKIP | Fiona Rachel Mills | 90 | 5.3 | -22.7 | |
| Green | Hazel Jane Graham | 88 | 5.2 | n/a | |
| Turnout | 1,697 | 39.7 | +5.9 | ||
| Conservative hold | Swing | ||||
Longtown
| Party | Candidate | Votes | % | ± | |
|---|---|---|---|---|---|
| Conservative | Val Tarbitt | 921 | 73.9 | +26.8 | |
| Labour | Stephen Ronald Sidgwick | 215 | 17.3 | -3.7 | |
| UKIP | Graham Moore | 109 | 8.7 | -19.8 | |
| Turnout | 1,246 | 33.2 | +5.3 | ||
| Conservative hold | Swing | ||||
Morton
| Party | Candidate | Votes | % | ± | |
|---|---|---|---|---|---|
| Labour | John Bell | 804 | 58.7 | +0.9 | |
| Conservative | David Shepherd | 477 | 34.8 | +20.8 | |
| Green | Rob Morrison | 84 | 6.1 | n/a | |
| Turnout | 1,369 | 31.3 | -0.5 | ||
| Labour hold | Swing | ||||
Stanwix Urban
| Party | Candidate | Votes | % | ± | |
|---|---|---|---|---|---|
| Conservative | Elizabeth Mallinson | 1,123 | 57.0 | +16.3 | |
| Labour | Tim Linford | 548 | 27.8 | -2.5 | |
| Green | Helen Davison | 216 | 11.0 | +3.8 | |
| UKIP | Phil Douglass | 83 | 4.2 | -13.3 | |
| Turnout | 1,970 | 45.2 | +5.0 | ||
| Conservative hold | Swing | ||||
Upperby
| Party | Candidate | Votes | % | ± | |
|---|---|---|---|---|---|
| Labour | Stewart Farries Young | 703 | 52.4 | -10.4 | |
| Conservative | Fiona Robson | 415 | 30.9 | +14.6 | |
| UKIP | John Gordon Denholm | 120 | 8.9 | n/a | |
| Liberal Democrat | James Ernest Osler | 70 | 5.2 | -4.2 | |
| Green | Penelope Bothepa Foster | 31 | 2.3 | n/a | |
| Turnout | 1,341 | 30.2 | +1.3 | ||
| Labour hold | Swing | ||||
Wetheral
| Party | Candidate | Votes | % | ± | |
|---|---|---|---|---|---|
| Conservative | Nick Marriner | 1,297 | 65.2 | +25.9 | |
| Liberal Democrat | Michael Anthony Gee | 307 | 15.4 | +5.3 | |
| Labour | Stephen John William Bowditch | 300 | 15.1 | -5.2 | |
| Green | Dallas Jane Brewis | 85 | 4.3 | +0.1 | |
| Turnout | 1,990 | 45.3 | +6.6 | ||
| Conservative hold | Swing | ||||
Yewdale
| Party | Candidate | Votes | % | ± | |
|---|---|---|---|---|---|
| Conservative | Stephen Haraldsen | 928 | 46.3 | +20.9 | |
| Labour | Beth Furneaux | 755 | 37.6 | -10.2 | |
| Liberal Democrat | Jeff Coates | 174 | 8.7 | n/a | |
| UKIP | Malcolm Fraser Craik | 111 | 5.5 | -21.1 | |
| Green | Henry Bryson Goodwin | 28 | 1.4 | n/a | |
| Turnout | 2,006 | 43.6 | +8.7 | ||
| Conservative gain from Labour | Swing | ||||
Copeland
| Copeland District | |||||||||||||||
|---|---|---|---|---|---|---|---|---|---|---|---|---|---|---|---|
| Party | Candidates | Votes | |||||||||||||
| Stood | Elected | Gained | Unseated | Net | % of total | % | № | Net % | |||||||
| Conservative | 12 | 8 | 5 | 0 | 6 | 48.9 | 8,377 | ||||||||
| Labour | 12 | 4 | 0 | 5 | -5 | 40.2 | 6,887 | ||||||||
| Independent | 6 | 0 | 0 | 0 | 0 | 8.4 | 1,287 | ||||||||
| Green | 5 | 0 | 0 | 0 | 0 | 2.2 | 379 | ||||||||
| UKIP | 2 | 0 | 0 | 0 | 0 | 0.8 | 140 | ||||||||
| Liberal Democrat | 1 | 0 | 0 | 0 | 0 | 0.4 | 66 | ||||||||
Bransty
| Party | Candidate | Votes | % | ± | |
|---|---|---|---|---|---|
| Conservative | Graham Robert Phillip Melville Roberts | 607 | 42.6 | -6.2 | |
| Labour | Rachel Margaret Holliday | 561 | 39.3 | -10.6 | |
| Independent | Charles Edward Maudling | 220 | 15.4 | n/a | |
| Green | Meggie Bedford | 38 | 2.7 | -n/a | |
| Turnout | 1,426 | 33.1 | +7.4 | ||
| Conservative gain from Labour | Swing | ||||
Cleator Moor East and Frizington
| Party | Candidate | Votes | % | ± | |
|---|---|---|---|---|---|
| Conservative | Arthur William Creighton Lamb | 629 | 46.9 | +17.9 | |
| Labour | Tim Knowles | 612 | 45.6 | -3.0 | |
| Green | Allan Franciscus Todd | 93 | 6.9 | +0.9 | |
| Turnout | 1,341 | 30.7 | +3.7 | ||
| Conservative gain from Labour | Swing | ||||
Cleator Moor West
| Party | Candidate | Votes | % | ± | |
|---|---|---|---|---|---|
| Labour | Frank Irving Morgan | 567 | 50.6 | -14.0 | |
| Conservative | Genna Elaine Haraldsen | 309 | 27.6 | +12.4 | |
| Independent | Christopher Patrick Ross | 112 | 10.0 | n/a | |
| Liberal Democrat | Mike Monigue | 66 | 5.9 | n/a | |
| UKIP | Nicholas Frederick Ford | 65 | 5.8 | n/a | |
| Turnout | 1,120 | 25.2 | +2.7 | ||
| Labour hold | Swing | ||||
Egremont
| Party | Candidate | Votes | % | ± | |
|---|---|---|---|---|---|
| Labour | David Edward Southward | 789 | 53.8 | +3.2 | |
| Conservative | Alistair William Millar Norwood | 677 | 46.1 | +28.1 | |
| Turnout | 1,470 | 31.5 | +4.9 | ||
| Labour hold | Swing | ||||
Egremont North and St Bees
| Party | Candidate | Votes | % | ± | |
|---|---|---|---|---|---|
| Conservative | Chris Whiteside | 626 | 42.6 | +7.1 | |
| Labour | Henry Wormstrup | 469 | 31.9 | -4.8 | |
| Independent | Wammo Walmsley | 208 | 14.2 | n/a | |
| Independent | Jayne Anne Laine | 163 | 11.1 | n/a | |
| Turnout | 1,469 | 33.8 | +9.9 | ||
| Conservative gain from Labour | Swing | ||||
Gosforth
| Party | Candidate | Votes | % | ± | |
|---|---|---|---|---|---|
| Conservative | Christopher Paul Turner | 1,144 | 60.8 | -11.4 | |
| Independent | Sam Meteer | 366 | 19.4 | n/a | |
| Labour | Peter Kane | 311 | 16.5 | -9.3 | |
| Green | Daniel James Nixon | 57 | 3.0 | n/a | |
| Turnout | 1,882 | 40.1 | +6.7 | ||
| Conservative hold | Swing | ||||
Hillcrest and Hensingham
| Party | Candidate | Votes | % | ± | |
|---|---|---|---|---|---|
| Conservative | Andrew William Wonnacott | 816 | 50.3 | +5.5 | |
| Labour | Christine Wharrier | 801 | 49.4 | -5.1 | |
| Turnout | 1,623 | 36.7 | +6.5 | ||
| Conservative gain from Labour | Swing | ||||
Howgate
| Party | Candidate | Votes | % | ± | |
|---|---|---|---|---|---|
| Conservative | Martin Steven Barbour | 623 | 47.6 | +17.0 | |
| Labour | Gillian Ruth Troughton | 566 | 43.2 | -16.7 | |
| UKIP | Eric William Atkinson | 75 | 5.7 | -n/a | |
| Green | Sharon Josephine Watson | 44 | 3.4 | -5.1 | |
| Turnout | 1,309 | 29.3 | +4.1 | ||
| Conservative gain from Labour | Swing | ||||
Kells and Sandwith
| Party | Candidate | Votes | % | ± | |
|---|---|---|---|---|---|
| Labour | Emma Louise Williamson | 684 | 51.7 | -7.4 | |
| Conservative | Brigid Anne Whiteside | 419 | 31.7 | +13.7 | |
| Independent | Michael Patrick Anthony Guest | 218 | 16.5 | -n/a | |
| Turnout | 1,322 | 28.0 | +2.1 | ||
| Labour hold | Swing | ||||
Millom
| Party | Candidate | Votes | % | ± | |
|---|---|---|---|---|---|
| Conservative | Doug Wilson | 967 | 68.4 | +26.8 | |
| Labour | Denise Barbara Burness | 442 | 31.3 | -1.7 | |
| Turnout | 1,413 | 31.4 | +3.2 | ||
| Conservative hold | Swing | ||||
Millom Without
| Party | Candidate | Votes | % | ± | |
|---|---|---|---|---|---|
| Conservative | Keith Haigh Hitchen | 1,150 | 72.7 | +10.3 | |
| Labour | Ryan Woods | 281 | 17.8 | -5.4 | |
| Green | Sally Millar | 147 | 9.3 | -3.4 | |
| Turnout | 1,582 | 39.6 | +7.9 | ||
| Conservative hold | Swing | ||||
Mirehouse
| Party | Candidate | Votes | % | ± | |
|---|---|---|---|---|---|
| Labour | Mike Hawkins | 804 | 66.0 | +4.1 | |
| Conservative | Jane Margaret Micklethwaite | 410 | 33.6 | +19.0 | |
| Turnout | 1,219 | 28.5 | +3.2 | ||
| Labour hold | Swing | ||||
Eden
| Eden District | |||||||||||||||
|---|---|---|---|---|---|---|---|---|---|---|---|---|---|---|---|
| Party | Candidates | Votes | |||||||||||||
| Stood | Elected | Gained | Unseated | Net | % of total | % | № | Net % | |||||||
| Conservative | 9 | 5 | 0 | 1 | -1 | 48.1 | 7,948 | ||||||||
| Liberal Democrat | 9 | 3 | 1 | 0 | 1 | 30.0 | 4,954 | ||||||||
| Labour | 6 | 1 | 1 | 0 | 1 | 8.9 | 1,476 | ||||||||
| Independent | 3 | 0 | 0 | 1 | -1 | 7.8 | 1,289 | ||||||||
| Green | 6 | 0 | 0 | 0 | 0 | 3.1 | 510 | ||||||||
| UKIP | 2 | 0 | 0 | 0 | 0 | 0.9 | 142 | ||||||||
Alston and East Fellside
| Party | Candidate | Votes | % | ± | |
|---|---|---|---|---|---|
| Labour | Claire Susan Driver | 836 | 35.1 | +24.7 | |
| Conservative | Walter Walker | 688 | 28.9 | +2.7 | |
| Independent | Mary Robinson | 624 | 26.2 | -9.8 | |
| Liberal Democrat | Deb Holden | 116 | 4.9 | n/a | |
| Green | Alan William Marsden | 114 | 4.8 | -8.6 | |
| Turnout | 2,380 | 46.1 | +14.0 | ||
| Labour gain from Independent | Swing | ||||
Appleby
| Party | Candidate | Votes | % | ± | |
|---|---|---|---|---|---|
| Liberal Democrat | Andy Connell | 909 | 48.1 | +19.4 | |
| Conservative | John Mervyn Owen | 844 | 44.7 | -2.7 | |
| Labour | John Potts | 78 | 4.1 | n/a | |
| Green | Kimberly Jane Lawson | 56 | 3.0 | n/a | |
| Turnout | 1,888 | 41.6 | +8.6 | ||
| Liberal Democrat gain from Conservative | Swing | ||||
Eden Lakes
| Party | Candidate | Votes | % | ± | |
|---|---|---|---|---|---|
| Liberal Democrat | Neil Hughes | 1,129 | 54.6 | +6.5 | |
| Conservative | Laura Elizabeth Kay | 931 | 45.1 | +2.1 | |
| Turnout | 2,066 | 48.0 | +8.5 | ||
| Liberal Democrat hold | Swing | ||||
Greystoke and Hesket
| Party | Candidate | Votes | % | ± | |
|---|---|---|---|---|---|
| Conservative | Tom Wentworth Waites | 1,009 | 57.2 | +5.5 | |
| Liberal Democrat | Roger Burgin | 255 | 14.5 | -7.8 | |
| Green | Doug Lawson | 205 | 11.6 | n/a | |
| Labour | Ruth Ann Wood | 201 | 11.4 | n/a | |
| UKIP | David Benson Ryland | 89 | 5.0 | -18.7 | |
| Turnout | 1,763 | 36.3 | +7.2 | ||
| Conservative hold | Swing | ||||
Kirkby Stephen
| Party | Candidate | Votes | % | ± | |
|---|---|---|---|---|---|
| Conservative | Phil Dew | 1,605 | 70.1 | +15.1 | |
| Liberal Democrat | Kelvyn Justin Simon James | 407 | 17.8 | -8.3 | |
| Labour | Ian Daniel Simkins | 194 | 8.5 | n/a | |
| Green | Richard Kevin O'Brien | 77 | 3.4 | n/a | |
| Turnout | 2,289 | 45.2 | +9.4 | ||
| Conservative hold | Swing | ||||
Penrith East
| Party | Candidate | Votes | % | ± | |
|---|---|---|---|---|---|
| Liberal Democrat | Patricia Ann Bell | 955 | 60.8 | +4.6 | |
| Conservative | John Forrester | 445 | 28.3 | +10.3 | |
| Labour | Hilary Jane Snell | 85 | 5.4 | -6.0 | |
| UKIP | Mary Elizabeth Dixon | 53 | 3.4 | -8.8 | |
| Green | Ali Ross | 29 | 1.8 | n/a | |
| Turnout | 1,570 | 34.3 | +4.6 | ||
| Liberal Democrat hold | Swing | ||||
Penrith North
| Party | Candidate | Votes | % | ± | |
|---|---|---|---|---|---|
| Conservative | Hilary Frances Carrick | 1,031 | 63.8 | +13.8 | |
| Liberal Democrat | Virginia Christine Taylor | 574 | 28.3 | -5.6 | |
| Turnout | 1,617 | 35.9 | +1.3 | ||
| Conservative hold | Swing | ||||
Penrith Rural
| Party | Candidate | Votes | % | ± | |
|---|---|---|---|---|---|
| Conservative | David Whipps | 888 | 51.3 | -22.6 | |
| Independent | Michael Christopher Tonkin | 405 | 23.4 | n/a | |
| Liberal Democrat | Lorna Ann Baker | 290 | 16.8 | -6.8 | |
| Green | Wade Tidbury | 143 | 8.3 | ||
| Turnout | 1,731 | 37.9 | +6.6 | ||
| Conservative hold | Swing | ||||
Penrith West
| Party | Candidate | Votes | % | ± | |
|---|---|---|---|---|---|
| Conservative | Helen Jane Fearon | 507 | 40.6 | +7.8 | |
| Liberal Democrat | Judith Margaret Derbyshire | 319 | 25.6 | -4.2 | |
| Independent | Lee Quinn | 260 | 16.8 | n/a | |
| Labour | Dave Knaggs | 160 | 12.8 | +2.9 | |
| Turnout | 1,248 | 28.9 | +5.1 | ||
| Conservative hold | Swing | ||||
South Lakeland
Cartmel
| Party | Candidate | Votes | % | ± | |
|---|---|---|---|---|---|
| Liberal Democrat | Sue Sanderson | 1,111 | 53.4 | -14.0 | |
| Conservative | Steve Chambers | 873 | 42.0 | +9.9 | |
| Green | Robin Smallwood Le Mare | 94 | 4.5 | n/a | |
| Turnout | 2,080 | 50.8 | +7.7 | ||
| Liberal Democrat hold | Swing | ||||
Grange
| Party | Candidate | Votes | % | ± | |
|---|---|---|---|---|---|
| Conservative | Bill Wearing | 1,318 | 62.0 | +3.1 | |
| Liberal Democrat | Dave Khan | 586 | 27.6 | -11.9 | |
| Labour | Nicola Kennedy | 135 | 6.3 | n/a | |
| Green | Laura Miller | 83 | 3.9 | n/a | |
| Turnout | 2,126 | 47.4 | +7.1 | ||
| Conservative hold | Swing | ||||
High Furness
| Party | Candidate | Votes | % | ± | |
|---|---|---|---|---|---|
| Conservative | Matt Brereton | 1,059 | 48.4 | +11.9 | |
| Liberal Democrat | David William Norman Fletcher | 798 | 36.5 | -2.8 | |
| Labour | Gerry Scott | 222 | 10.2 | +1.6 | |
| Green | Chris Loynes | 103 | 4.7 | n/a | |
| Turnout | 2,186 | 48.8 | +5.9 | ||
| Conservative gain from Liberal Democrat | Swing | ||||
Kendal Castle
| Party | Candidate | Votes | % | ± | |
|---|---|---|---|---|---|
| Liberal Democrat | Chris Hogg | 1,267 | 57.9 | -14.7 | |
| Conservative | Harry James Albert Taylor | 703 | 32.1 | +14.6 | |
| Labour | Jim Ring | 133 | 6.1 | -3.3 | |
| Green | Gwen Harrison | 83 | 3.8 | n/a | |
| Turnout | 2,188 | 46.0 | +7.9 | ||
| Liberal Democrat hold | Swing | ||||
Kendal Highgate
| Party | Candidate | Votes | % | ± | |
|---|---|---|---|---|---|
| Liberal Democrat | Geoff Cook | 922 | 53.9 | -4.9 | |
| Conservative | Emma Therese Marie Hines | 426 | 24.9 | +15.9 | |
| Labour | Paul Braithwaite | 251 | 14.8 | -5.2 | |
| Green | Phil Whiting | 107 | 6.3 | n/a | |
| Turnout | 1,710 | 37.7 | +6.6 | ||
| Liberal Democrat hold | Swing | ||||
Kendal Nether
| Party | Candidate | Votes | % | ± | |
|---|---|---|---|---|---|
| Liberal Democrat | Shirley Amelia Evans | 1,234 | 60.0 | -4.7 | |
| Conservative | Pamela Mary Flitcroft | 531 | 25.8 | +5.8 | |
| Labour | Eli Aldridge | 188 | 9.1 | -5.6 | |
| Green | Andy Mason | 100 | 4.9 | n/a | |
| Turnout | 2,056 | 43.2 | +9.4 | ||
| Liberal Democrat hold | Swing | ||||
Kendal South
| Party | Candidate | Votes | % | ± | |
|---|---|---|---|---|---|
| Liberal Democrat | Brenda Clare Gray | 1,195 | 48.5 | -14.6 | |
| Conservative | Andrew John Lucas | 1,025 | 41.6 | +13.0 | |
| Labour | Jackson Softley Stubbs | 131 | 5.3 | -2.5 | |
| Green | Meg Hill | 109 | 4.4 | n/a | |
| Turnout | 2,463 | 52.0 | +8.0 | ||
| Liberal Democrat hold | Swing | ||||
Kendal Strickland and Fell
| Party | Candidate | Votes | % | ± | |
|---|---|---|---|---|---|
| Liberal Democrat | Peter Carlyle Thornton | 1,170 | 54.6 | +2.5 | |
| Conservative | Michael Patrick Nicholson | 443 | 20.7 | +10.5 | |
| Labour | Virginia Elizabeth Branney | 353 | 16.5 | -13.4 | |
| Green | Ian Rodham | 167 | 7.8 | n/a | |
| Turnout | 2,141 | 44.2 | +6.0 | ||
| Liberal Democrat hold | Swing | ||||
Kent Estuary
| Party | Candidate | Votes | % | ± | |
|---|---|---|---|---|---|
| Liberal Democrat | Ian Stewart | 1,422 | 52.9 | -10.9 | |
| Conservative | Tom Harvey | 995 | 37.0 | +8.1 | |
| Green | Jill Abel | 162 | 6.0 | n/a | |
| Labour | Lois Katherine Sparling | 103 | 3.8 | -3.0 | |
| Turnout | 2,686 | 52.4 | +7.6 | ||
| Liberal Democrat hold | Swing | ||||
Lakes
| Party | Candidate | Votes | % | ± | |
|---|---|---|---|---|---|
| Liberal Democrat | Will Clark | 782 | 52.9 | -1.8 | |
| Conservative | Tim Brown | 564 | 38.2 | -0.2 | |
| Labour | Alison Faith Gilchrist | 79 | 5.3 | -1.2 | |
| Green | Chris Rowley | 49 | 3.3 | n/a | |
| Turnout | 1,477 | 46.3 | +3.2 | ||
| Liberal Democrat hold | Swing | ||||
Lower Kentdale
| Party | Candidate | Votes | % | ± | |
|---|---|---|---|---|---|
| Conservative | Roger Kenneth Bingham | 1,715 | 69.6 | +10.1 | |
| Liberal Democrat | Gordon Victor Higton | 510 | 20.7 | -7.3 | |
| Labour | Paul John Casson | 139 | 5.6 | +0.0 | |
| Green | Simon Blunden | 97 | 3.9 | n/a | |
| Turnout | 2,463 | 52.4 | -4.3 | ||
| Conservative hold | Swing | ||||
Lyth Valley
| Party | Candidate | Votes | % | ± | |
|---|---|---|---|---|---|
| Conservative | James Bland | 1,247 | 65.0 | +3.6 | |
| Liberal Democrat | Bex Cooper | 530 | 27.6 | -0.2 | |
| Green | Adam Mark Rubinstein | 99 | 5.2 | n/a | |
| UKIP | Stephen Willmott | 43 | 2.2 | -8.3 | |
| Turnout | 1,919 | 47.5 | +5.5 | ||
| Conservative hold | Swing | ||||
Sedbergh and Kirkby Lonsdale
| Party | Candidate | Votes | % | ± | |
|---|---|---|---|---|---|
| Liberal Democrat | Nick Cotton | 1,253 | 48.7 | -2.2 | |
| Conservative | Kevin John Lancaster | 1,163 | 45.2 | -2.6 | |
| Labour | Nick Cross | 91 | 3.5 | n/a | |
| Green | Daphne Mary Jackson | 60 | 2.3 | n/a | |
| Turnout | 2,571 | 55.1 | +5.6 | ||
| Liberal Democrat hold | Swing | ||||
Ulverston East
| Party | Candidate | Votes | % | ± | |
|---|---|---|---|---|---|
| Labour | John Mark Wilson | 758 | 46.0 | -3.2 | |
| Conservative | Helen Irving | 620 | 37.6 | -6.0 | |
| Liberal Democrat | Andrew Hudson | 168 | 10.2 | -0.8 | |
| Green | Bob Gerry | 98 | 6.0 | -2.8 | |
| Turnout | 1,647 | 36.3 | +10.0 | ||
| Labour hold | Swing | ||||
Ulverston West
| Party | Candidate | Votes | % | ± | |
|---|---|---|---|---|---|
| Conservative | James Airey | 1,146 | 54.9 | +8.6 | |
| Labour Co-op | David John Webster | 552 | 26.5 | -4.4 | |
| Liberal Democrat | Loraine Birchall | 235 | 11.3 | +7.9 | |
| Green | Judy Filmore | 149 | 7.1 | +1.2 | |
| Turnout | 2,086 | 45.9 | +6.3 | ||
| Conservative hold | Swing | ||||
Upper Kent
| Party | Candidate | Votes | % | ± | |
|---|---|---|---|---|---|
| Liberal Democrat | Stan Collins | 1,104 | 51.9 | -15.7 | |
| Conservative | Margaret Bond | 756 | 35.5 | +4.3 | |
| Green | Adrian Robert Porter | 158 | 7.4 | n/a | |
| Labour | Andy Windsor | 109 | 5.1 | n/a | |
| Turnout | 2,129 | 46.1 | +10.9 | ||
| Liberal Democrat hold | Swing | ||||
Windermere
| Party | Candidate | Votes | % | ± | |
|---|---|---|---|---|---|
| Conservative | Ben Berry | 1,097 | 47.9 | +29.3 | |
| Liberal Democrat | Steve Rooke | 1,009 | 44.1 | -17.8 | |
| Labour | Penny Henderson | 124 | 5.4 | +1.7 | |
| Green | Kate Threadgold | 58 | 2.5 | n/a | |
| Turnout | 2,290 | 48.2 | +8.1 | ||
| Conservative gain from Liberal Democrat | Swing | ||||
References
- ↑ "Upcoming elections & referendums". Electoral Commission. Retrieved 15 September 2016.
- ↑ "Cumbria County Council election results 2017". Cumbria County Council. 2017-05-05. Retrieved 2017-05-08.
| Cumbria County Council | |
|---|---|
| Allerdale Borough Council | |
| Barrow-in-Furness Borough Council | |
| Carlisle City Council | |
| Copeland Borough Council | |
| Eden District Council |
|
| South Lakeland District Council | |
| Cumberland County Council |
|
| Westmorland County Council |
|
| |
This article is issued from
Wikipedia.
The text is licensed under Creative Commons - Attribution - Sharealike.
Additional terms may apply for the media files.