The 2017 East Renfrewshire Council elections took place on 4 May 2017 to elect members of East Renfrewshire Council.
Five wards were used to elect eighteen councillors, a reduction of two from 2012.
East Renfrewshire Council election, 2017
|
|
|
All 18 seats to East Renfrewshire Council
10 seats needed for a majority |
|---|
| |
First party |
Second party |
Third party |
| |
|
|
|
| Leader |
Jim Swift |
Tony Buchanan |
Paul O'Kane |
| Party |
Conservative |
SNP |
Labour |
| Leader's seat |
Newton Mearns South and Eaglesham |
Neilston and Newton Mearns North |
Newton Mearns North & Neilston |
| Last election |
6 seats |
4 seats |
8 seats |
| Seats before |
6 |
4 |
8 |
| Seats won |
7 |
5 |
4 |
| Seat change |
 1 1 |
1 |
 4 4 |
|
| |
Fourth party |
|
| |
|
|
| Leader |
Danny Devlin |
|
| Party |
Independent |
|
| Leader's seat |
Barrhead, Liboside and Uplawmoor |
|
| Last election |
2 seats |
|
| Seats before |
2 |
|
| Seats won |
2 |
|
| Seat change |
- |
|
|
|
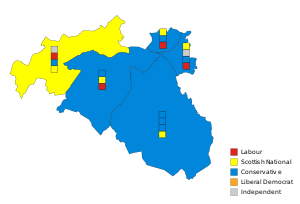 The 6 multi-member wards |
Council Leader before election
Jim Fletcher
Labour |
Council Leader after election
Tony Buchanan
SNP |
|
2017 Results
Note: "Votes" are the first preference votes. The net gain/loss and percentage changes relate to the result of the previous Scottish local elections on 3 May 2007. This may differ from other published sources showing gain/loss relative to seats held at dissolution of Scotland's councils.
Ward results
Barrhead, Liboside & Uplawmoor
- 2017: 1 x Independent, 1 x Conservative, 1 x Labour, 1 x SNP
- 2012-2017: New ward
| Barrhead, Liboside & Uplawmoor - 4 seats[2] |
| Party | Candidate | % 1st Pref | Count 1 | Count 2 | Count 3 | Count 4 | Count 5 | Count 6 | Count 7 | Count 8 |
|
Independent |
Danny Devlin (incumbent) |
26.02% |
1,840 |
|
|
|
|
|
|
|
|
Conservative |
Paul Aitken |
18.34% |
1,297 |
1,356 |
1,372 |
1,390 |
1,412 |
1,427 |
|
|
|
SNP |
Angela Convery |
16.95% |
1,199 |
1,242 |
1,242 |
1,330 |
1,347 |
1,357 |
1,358 |
2,371 |
|
SNP |
Tommy Reilly (incumbent) |
14.97% |
1,059 |
1,125 |
1,126 |
1,167 |
1,205 |
1,218 |
1,219 |
|
|
Labour |
Betty Wood Cunningham (incumbent) |
14.42% |
1,020 |
1,111 |
1,113 |
1,160 |
1,506 |
|
|
|
|
Labour |
Kenny Hay (incumbent) |
5.71% |
404 |
463 |
465 |
481 |
|
|
|
|
|
Scottish Green |
David Allison |
3.11% |
220 |
244 |
249 |
|
|
|
|
|
|
UKIP |
John Ferguson |
0.48% |
34 |
43 |
|
|
|
|
|
|
| Electorate: TBC Valid: 7,073 Spoilt: 116 Quota: 1,415 Turnout: 52.5% |
Newton Mearns North & Neilston
- 2017: 1 x Conservative, 1 x SNP, 1 x Labour
- 2012-2017: New ward
| Newton Mearns North & Neilston - 3 seats[2] |
| Party | Candidate | % 1st Pref | Count 1 |
|
Conservative |
Charlie Gilbert (incumbent) |
28.55% |
1,729 |
|
SNP |
Tony Buchanan (incumbent) |
25.62% |
1,551 |
|
Labour |
Paul O'Kane (incumbent) |
25.29% |
1,531 |
|
Conservative |
Andrew Morrison |
10.17% |
616 |
|
Independent |
Kirsteen Allan |
4.44% |
269 |
|
Independent |
David Jesner |
2.94% |
178 |
|
Liberal Democrats |
Roy Provan |
2.28% |
138 |
|
UKIP |
Stuart Sutherland |
0.50% |
30 |
|
SDP |
Robert Malyn |
0.21% |
13 |
| Electorate: TBC Valid: 6,055 Spoilt: 79 Quota: 1,514 Turnout: 52.8% |
Giffnock and Thornliebank
- 2012: 1 x Labour, 1 x Conservative, 1 x SNP
- 2017: 1 x Labour, 1 x Conservative, 1 x SNP
- 2012-2017: No Change
| Giffnock and Thornliebank - 3 seats |
| Party | Candidate | % 1st Pref | Count 1 | Count 2 | Count 3 | Count 4 | Count 5 | Count 6 | Count 7 | Count 8 | Count 9 |
|
SNP |
Colm Merrick |
24.40% |
1,853 |
1,855 |
1,860 |
1,898 |
1,990 |
|
|
|
|
|
Conservative |
Gordon Wallace (incumbent) |
23.06% |
1,751 |
1,753 |
1,758 |
1,784 |
1,825 |
1,826 |
2,621 |
|
|
|
Labour |
Jim Fletcher (incumbent) |
18.84% |
1,431 |
1,435 |
1,438 |
1,506 |
1,615 |
1,650 |
1,715 |
1,838 |
2,224 |
|
Conservative |
Paul Smith |
11.84% |
899 |
904 |
905 |
943 |
976 |
979 |
|
|
|
|
Independent |
Paul Drury |
11.31% |
859 |
862 |
876 |
913 |
1,085 |
1,108 |
1,149 |
1,309 |
|
|
Independent |
Savio D'Souza |
6.00% |
456 |
460 |
470 |
507 |
|
|
|
|
|
|
Liberal Democrats |
Christopher Park |
3.50% |
266 |
274 |
278 |
|
|
|
|
|
|
|
Independent |
Gordon McCaskill * |
0.63% |
48 |
50 |
|
|
|
|
|
|
|
|
Libertarian |
Alan Findlay |
0.42% |
32 |
|
|
|
|
|
|
|
|
| Electorate: TBC Valid: 7,595 Spoilt: 92 Quota: 1,899 Turnout: 60.2% |
Clarkston, Netherlee and Williamwood
- 2017: 1 x SNP, 1 x Independent, 1 x Conservative, 1 x Labour
- 2012-2017: New ward
| Clarkston, Netherlee & Williamwood - 4 seats[2] |
| Party | Candidate | % 1st Pref | Count 1 | Count 2 | Count 3 | Count 4 | Count 5 | Count 6 | Count 7 | Count 8 | Count 9 | Count 10 |
|
Conservative |
Stewart Miller* |
16.81% |
1,715 |
1,719 |
1,734 |
1,738 |
1,762 |
1,772 |
1,777 |
1,915 |
1,936 |
3,328 |
|
Conservative |
Andrea Gee |
15.49% |
1,580 |
1,585 |
1,598 |
1,604 |
1,624 |
1,628 |
1,634 |
1,767 |
1,783 |
|
|
SNP |
Annette Ireland |
14.78% |
1,508 |
1,509 |
1,521 |
1,634 |
1,671 |
2,400 |
|
|
|
|
|
Independent |
David MacDonald |
13.25% |
1,352 |
1,354 |
1,391 |
1,439 |
1,505 |
1,571 |
1,659 |
2,189 |
|
|
|
Independent |
Ralph Robertson (incumbent) |
9.75% |
995 |
995 |
1,012 |
1,044 |
1,110 |
1,126 |
1,175 |
|
|
|
|
Labour |
Alan Lafferty* |
9.66% |
986 |
989 |
1,018 |
1,048 |
1,536 |
1,573 |
1,651 |
1,791 |
1,829 |
1,949 |
|
SNP |
James Mills |
7.93% |
809 |
810 |
813 |
883 |
908 |
|
|
|
|
|
|
Labour |
Mary Montague (incumbent) |
6.78% |
692 |
692 |
717 |
761 |
|
|
|
|
|
|
|
Scottish Green |
Laura Stevens |
3.44% |
351 |
352 |
378 |
|
|
|
|
|
|
|
|
Liberal Democrats |
Alex Mackie |
1.91% |
195 |
195 |
|
|
|
|
|
|
|
|
|
UKIP |
Sarah Louise Hemy |
0.20% |
20 |
|
|
|
|
|
|
|
|
|
| Electorate: TBC Valid: 10,204 Spoilt: 151 Quota: 2,041 Turnout: 63.1% |
Newton Mearns South & Eaglesham
- 2017: 3 x Conservative, 1 x SNP
- 2012-2017: New ward
| Newton Mearns South & Eaglesham - 4 seats[2] |
| Party | Candidate | % 1st Pref | Count 1 | Count 2 | Count 3 | Count 4 | Count 5 |
|
Conservative |
Jim Swift (incumbent) |
28.30% |
2,766 |
|
|
|
|
|
SNP |
Caroline Bamforth |
19.51% |
1,907 |
1,920 |
1,923 |
1,926 |
1,982 |
|
Conservative |
Barbara Grant (incumbent) |
18.40% |
1,798 |
|
|
|
|
|
Conservative |
Jim McLean |
14.70% |
1,437 |
1,706 |
1,924 |
1,936 |
1,987 |
|
Labour |
Ian McAlpine (incumbent) |
10.33% |
1,009 |
1,208 |
1,307 |
1,043 |
1,139 |
|
Independent |
Bev Brown |
5.23% |
511 |
545 |
552 |
562 |
620 |
|
Liberal Democrats |
Alan Rennie |
3.15% |
308 |
325 |
332 |
333 |
|
|
UKIP |
Gerry McVeigh |
0.38% |
37 |
40 |
41 |
|
|
| Electorate: TBC Valid: 9,773 Spoilt: 115 Quota: 1,955 Turnout: 58.6% |